
Modeling of the Dyeing Uptake Rate for Direct Dyestuff on Cotton in Batch Dyeing Process Based on Grey System Theory
2013-12-28 07:53ZHANGJianxinTIANYanjieZHANGYongxin
ZHANG Jian-xin(),TIAN Yan-jie(),ZHANG Yong-xin()
Faculty of Mechanical Engineering and Automation,Zhejiang Sci-Tech University,Hangzhou 310018,China
Introduction
Modeling of batch dyeing process is very important to develop control strategies for improving the possibility of achieving the “right first time” production.However,the batch dyeing process is a very complicated process where many factors,including temperature,pH,and salt concentration,influence the final product shade.Usually,modeling of this process involves describing the relationship between these parameters with the dyeing uptake rate,which directly affects the final shade and can reflect the dyeing process intuitively.However,a great number of experiments are often required for obtaining a reliable model.Moreover,the dynamic behavior of dyeing processes is nonlinear,so it is not easy to find appropriate forms of models.
At present,many researchers have been trying to develop the dynamic models of the dyeing uptake rate,for example,three basic dyeing uptake rate models were developed[1]using the first-order and the second-order differential equations respectively,proving that the second-order differential equation was more suitable for the actual dyeing uptake rate curve.Some researchers used the reaction rate equation to establish models which had shown promising results[2- 3].Most of models were developed based on the physical-chemistry law[4-5],and had good accuracy and reliability.However there are many difficulties while applying them to actual dyeing processes such as the difficulty of determining the model coefficients,the large scale of calculation,and the poor interoperability[6-8].Grey system theory,firstly proposed by professor Deng[9],is a new subject of studying the uncertain systems which treats any random variation as variation in the grey values within a certain range and a random process as a time-varying grey process within a certain range.It can be used to deal with data,analyze features,develop models,and predict trends for systems which have characteristics of sub-sample and poor information.The grey model naturally is a non-parametric model,which regards its internal structure,characteristics,and parameters as unknown and reduces data randomness by grey generation of disorderly data and then using the grey differential equation to reflect data diversity.It has high accuracy especially for small samples.In recent years,many applications of grey models were reported in Refs.[10-17].In theses literatures,different grey models were successfully employed to predict the uncertainties of different systems,such as the axle temperature in the passenger car[12],the fatigue life of samples[13],the power transformer faults in electrical industry[14],the cutting force in turning process[15],the indoor air quality[16],and the yarn weight in textile industry[17].Therefore,the application of the grey model into textile dyeing process is also feasible in spite of its non-popularity.
In this paper,we proposed a novel method for modeling the dyeing uptake rate for batch dyeing process by integrating the traditional parametric model with the grey model.The typical combination of dyestuff-fabric,direct dyestuff on cotton,was chosen as a representative of the common dyeing methods.The parametric model was developed based on the physical-chemistry law,where some unknown parameters were solved by the grey model.Then an integrated model was deduced.This method can reduce the difficulty of modeling and the scale of computation.Furthermore the integrated model can be modified easily.
1 Grey Model
In recent years,the grey model has been widely discussed and gradually improved.It deduces the evolvement law of system from the generated behavior characteristics and then uses them to predict the future behaviors of system.It employs the data generation method to obtain a more regular generating sequence from the initial random data.The accumulated generating operation (AGO) and the inverse accumulated generating operation (IAGO) are the basic tools for searching the grey model.Since the grey model focuses on pre-control and lead-control of the future behaviors of system,it has stronger self-adaptability,generalization-ability,real-time ability,and accuracy.In this section,some of the grey models used in this paper were introduced.In these models,variation of certain dyeing parameter was treated as a time-varying process in the “grey” value within a certain range.
1.1 GM(1,1) model
The GM(1,1) model is widely employed in various grey systems,where the first “1” denotes the order of the ordinary differential equation of the grey model and the second “1” denotes the number of variables.It can be used to approximate data of the interval sequence and the non-interval sequence,which evolve over time with an exponential law.
SupposeX(0)=[x(0)(1),x(0)(2),…,x(0)(n)]to be the original data sequence,and the first order AGO sequenceX(1)ofX(0)is
X(1)=[x(1)(1),x(1)(2),…,x(1)(n)],

The mean value sequenceZ(1)ofX(1)is
Z(1)=[z(1)(2),z(1)(3),z(1)(4),…,z(1)(n)],
wherez(1)(k)=0.5x(1)(k)+0.5x(1)(k-1),k=2,3,…,n.
The following equation is called as the whitenization equation of GM(1,1),which is used to predict the future behaviors of system:

(1)
whereais the development coefficient reflecting the developing status ofx(1)andbis the grey input reflecting data’s variation.
The solution of Eq.(1) is
(2)

The predictive values of the original sequence can be obtained through IAGO of the solution of Eq.(2) by substitutingkwithk=0,1,2,…,n:

(3)
1.2 GM(0,N) model


The final model obtained is
(4)
where [b2,b3,…,bN,a]=(BTB)-1BTyand

2 Model Development
The modeling experiments were performed on a small infrared warming pilot dyeing machine produced by Hangzhou Sanjin Technology Corporation,China.An Agilent Cary 50 UV-Visible Spectrophotometer (Agilent Technologies Co.,USA) was used to measure the absorbance of dyebath and then converted to the dye concentration.The direct dyestuff Fast Red F3B was supplied by Tianjin Yadong Chemical & Dyestuff Factory and the salt chemical anhydrous sodium sulphate (Na2SO4≥99%) was supplied by Sichuan Shenhong Corporation,China.
In the experiments,three factors (temperature,salt concentratin,and pH) were considered to be varied in a certain scope,where the first two factors affected the dyeing process more than the third one.The pH factor was chosen for emphasizing the study of the method of multi-parameters model.The dyeing technical conditions were as follows: the weight of the dyed fabric was 2 g and the amount of dyestuff was 3% (o.w.f); the dyeing temperature ranged from 30 ℃ to 95 ℃; the bath ratio was 1∶30.
2.1 Relationships between the equilibrium percentage of dyeing uptake rate and the salt concentration,temperature and pH
It is well known from the Fick’s laws of diffusion that the dyeing uptake rate is closely related to the dye concentrationC∞at the equilibrium state,which is determined by the equilibrium percentage of dyeing uptake rate if the material ratio and bath ratio are all fixed.So firstly the relationships between the equilibrium percentage of dyeing uptake rate and the salt concentration,temperature and pH were modeled with grey models.
Figure 1 shows the curve of relationship of the concentration of anhydrous sodium sulphate and the equilibrium percentage of dyeing uptake rate at 95 ℃.It can be seen that the curve conforms to the exponential law,indicating that the GM (1,1) can be used for modeling.Note that the pH value of dyebath remained unchanged in experiments unless pointed out specially.

Fig.1 Relationship between equilibrium percentage of dyeing uptake rate and concentration of anhydrous sodium sulphate at 95 ℃
Figure 2 plots the relationship between the equilibrium percentage of dyeing uptake rate and temperature.The concentration of anhydrous sodium sulphate in dyebath was 18 g·L-1.The equilibrium percentage of dyeing uptake rate increases linearly before temperature reaches 62 ℃,whereas it almost does not vary after that point.Therefore,the GM (0,N) can be used for modeling.

Fig.2 Relationship between temperature and the equilibrium percentage of dyeing uptake rate
In order to develop the relationship between the equilibrium percentage of dyeing uptake rate and pH,the temperature was fixed at 95 ℃,and the concentration of anhydrous sodium sulphate was 8 g·L-1.It should be pointed out that if the salt concentration is not suitable,the equilibrium percentage of dyeing uptake rate will be smaller or too close to the saturation value,resulting in difficulty of observing the effect of pH.The experimental results show that the effect of pH is not obvious,and has no regularity as shown in Fig.3.

Fig.3 The relationship between pH and the equilibrium percentage of dyeing uptake rate at 95 ℃
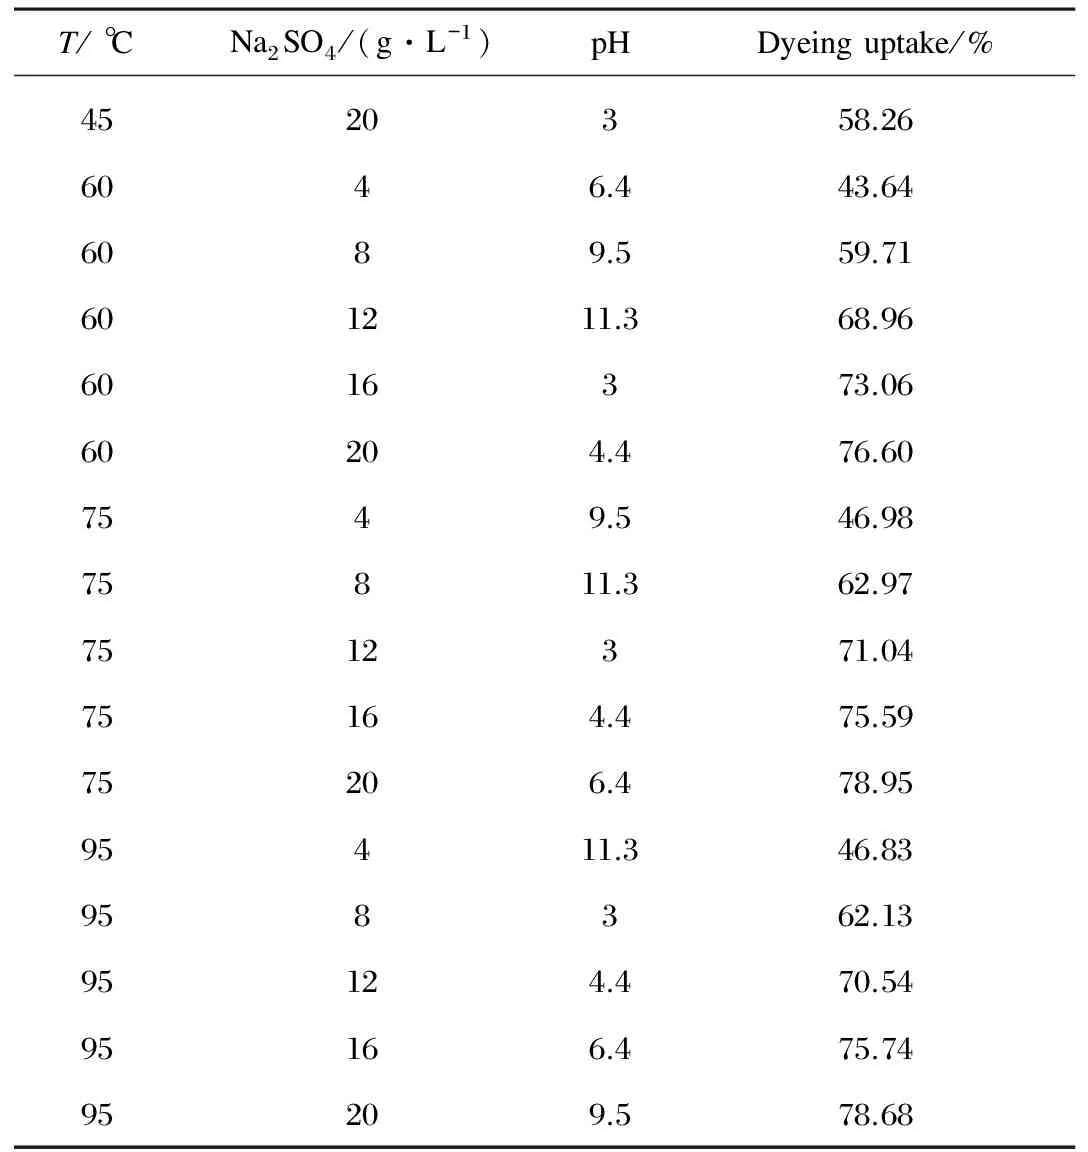
Based on the principles between each parameter with the equilibrium percentage of dyeing uptake rate,the multi-parameters model can be deduced through the appropriate orthogonal experiment design.An orthogonal table of three factors with five levels was designed as shown in Table 1.

Table 1 Orthogonal experiment of 3 factors and 5 levels
(Table 1 continued)
In the following sections,two models of the equilibrium percentage of dyeing uptake rate would be built and discussed using two different grey modeling methods.
2.1.1ModelwithGM(1,1)
As mentioned above,the relationship between the equilibrium percentage of dyeing uptake rate and the salt concentration at each temperature point can be described with GM(1,1) model,and the effects of temperature and pH can also be included using the orthogonal experiment.
Because there were over 5 points in Fig.1 at the same temperature which conformed to the exponential law,they were taken as the original sequence or accumulate sequence in GM(1,1) model.The accumulate sequence was used for modeling because of its higher precision and free of IAGO operation.
Here,the model at 30 ℃ was taken as an example in order to explain the modeling process with GM(1,1) as follows.
The modeling sequenceX(1)(representing the equilibrium percentage of dyeing uptake rate at each sampling point)is:
X(1)=[x(1)(1),x(1)(2),x(1)(3),x(1)(4),x(1)(5)]=
[25.90,32.46,37.28,39.61,40.36].
(5)
Then,the whitenization form of GM (1,1) model is

(6)


(7)
The model calculation and error values at different sampling points were listed in Table 2.It can be seen that the relative errors are very small,verifying that these models are of relatively satisfying accuracy.

Table 2 The calculated values and relative errors of the models
To obtain the equilibrium percentages of dyeing uptake rate at any temperatures and concentrations,a two dimension linearly interpolation equation based on the five GM(1,1) models was defined as follows:

(8)
wherexkandxk+1denote the two temperature sampling points before and after the current temperaturexrespectively;skandsk+1are the equilibrium percentages at temperaturexkandxk+1which are calculated by the equations similar to formula (6) based on the corresponding GM(1,1) models at those temperatures.Since the equilibrium dyeing uptake rate does not change as temperature increases when the temperature is above about 62 °C,it can be calculated with any GM(1,1) model at temperature above 62 °C.The effect of pH is not obvious and not regular,so it is omitted in the models.
2.1.2ModelwithGM(1,1)andGM(0,N)
As mentioned in section 1.2,the GM(0,N) model can be used for modeling multi-parameters process.However,as the relationship between the equilibrium percentage of dyeing uptake rate and the salt concentration of anhydrous sodium sulphate is non-linear,it can not be described directly using the linear GM(0,N) model.So,a mixed modeling method was presented in this section by combining the GM(1,1) and GM(0,N) models,where the GM(1,1) model was firstly used to describe the equilibrium dyeing uptake rate at 30 ℃ as mentioned in section 2.1.1,and the GM(0,N) model was then used to express its linear relationship between other temperatures and 30 ℃.
The GM(0,N) model was built based on the orthogonal experimental data in Table 1 at 45,60,and 75 ℃ respectively.As the effect of temperature above 62 ℃ kept constant,the experimental data at 75 ℃ were replaced by 62 ℃ in order not to affect the linear relationship in sequences.Either the original experimental data or the AGO data could be used for modeling without difference in accuracy,while the original data were employed for they were more convenient to calculate the equilibrium percentages of dyeing uptake rate with different values of temperature,salt concentration,and pH.
Considering the linear relationship between the equilibrium dyeing uptake rate and temperature less than 62 ℃ ,the model can be expressed as
s=b2xy+b3z+a,
(9)
wheresis the equilibrium dyeing uptake rate;xis temperature;yis the equilibrium dyeing uptake rate related to the concentration of anhydrous sodium sulphate which is calculated with the GM(1,1) model at 30 ℃,zis pH;b2,b3,andaare coefficients.Different from the model in section 2.1.1,this model contained the pH parameter.
Similar to GM(1,1) modeling,the GM(0,N)(N=3) model was obtained by using Eq.(4) as:

Considering Eq.(9),it can be rewritten as follows:
s=0.033 3xy-0.035 6z-3.879 6.
(10)
The model calculation and error values of the model (10) were shown in Table 3.It can be seen that the average errors of this model are larger than those in Table 2.

Table 3 Model calculated value and relative error
2.2 Modeling of dyeing uptake rate of direct dye on cotton
In this section,the GM(1,1) model Eq.(8) of the equilibrium dyeing uptake rate was employed to model the instantaneous dyeing uptake rate because it had higher accuracy compared with model Eq.(10).Base on this model and the adsorption rate equation,an integrated dyeing uptake rate model with three parameters was obtained to describe the dyeing kinetic behavior with the direct dyestuff Fast Red F3B on cotton.
The adsorption rate equation[18]is
(11)

Multipling Eq.(11) by the fabric weight,and dividing it by the total dyestuff weight on both sides,the derivative of the dyeing uptake rate(%) with respect to timetis
(12)
wherepis the dyeing uptake rate(%) andsis the equilibrium percentage of dyeing uptake rate calculated by Eq.(8).The discrete form of Eq.(12) is
(13)
wherea<0 and min(ax+b)=1.The item (ax+b) is called the initial dyeing factor introduced to express the initial dyeing uptake behavior because it occurs very fast just when the fabric is submerged into the dyebath.Obviously,it is a monotonic decreasing function and will be 1 after the end of the initial dyeing stage.
3 Model Validation and Discussion
On the basis of Eq.(13),three curves of dyeing uptake rate (%) under different conditions are calculated and shown in Fig.4.They are compared with the experimental results (the black dots in figure) in the same figure.It can be seen that the model has good fit with the experimental results.Therefore,it has good accuracy and can meet the need for predicting the dyeing result.According to the same method of modeling,it can also contain more parameters such as bath ratio and the fabric loop speed.

Fig.4 Dyeing uptake rate of direct dyestuff Fast Red F3B
In actual dyeing process,the anhydrous sodium sulphate is usually dosed into the dyebath in twice or three times in order to obtain better dyeing effect.If its concentration in dyebath is dosed to 8 g·L-1for the first time under conditions of the maximum temperature 95 ℃ with heating gradient 2 ℃·min-1and pH 6.4,and then is dosed to 18 g·L-1after 40 min,the dyeing uptake rate curve calculated with Eq.(13) is shown in Fig.5.

Fig.5 Dyeing uptake rate calculated with dosing anhydrous sodium sulphate twice
4 Conclusions
In this paper a new way to model dyeing uptake rate with grey system theory was presented.Experimental results verified the feasibility of the new model of dyeing uptake rate.As grey system theory has the characteristics of fewer modeling data,good results can be obtained especially for some dyestuffs whose exhaustion process can not be modeled accurately with mechanism model.
The new integrated model combined the classical adsorption rate equation with the grey system theory,and thus it had the advantages of both mechanism model and non-mechanism model,such as good generalization ability and less calculation scale.It can be used to predict the instantaneous concentration of dyestuff in solution,making it possible for achieving on-line control of the batch dyeing process.Moreover it can be applicable to other dyestuffs and fabrics of the same group because of its generalization ability.As the grey system theory was used in the modeling process,the model can be updated only with little experimental data.
[1] Allen S J,Gan Q,Matthews R,etal.Kinetic Modeling of the Adsorption of Basic Dyes by Kudzu[J].JournalofColloidandInterfaceScience,2005,286(1): 101-109.
[2] Reddy M,Lee G,McGregor R,etal.Modeling of the Batch Dyeing Process[C].Proceedings of the American Control Conference,Washington DC,1995: 2180- 2184.
[3] Lu J,Spiekermann C,McGregor R,etal.A Novel Approach to Modeling and Controlling Dyeing Process[J].AATCCInternationalDyeingSymposium,1995,27(3): 161-181.
[4] Ferus-Comelo M.An Analysis of the Factors Influencing Unlevelness of a Direct Dye on a Pilot-Scale Jet Dyeing Machine[J].ColorationTechnology,2008,124(2): 100-105.
[5] Ferus-Comelo M,Clark M.Physico-Chemical Modeling of the Dyeing of Cotton with Reactive Dyes[J].ColorationTechnology,2004,120(6): 301-306.
[6] Zhao X,Wardman R H,Shamey R.Theoretical Study of the Influence of Dispersion Factor on Dye Transport during the Dyeing Process[J].ColorationTechnology,2006,122(2): 110-114.
[7] Fu Z J,Yu L S.Researching of Mathematical Model for Dyeing Kinetics[J].DyestuffsandColoration,2003,40(1): 23- 26.(in Chinese)
[8] Ujhelyiova A,Bolhbova E,Oravkinova J,etal.Kinetics of Dyeing Process of Blend Polypropylene/Polyester Fibers with Disperse Dye[J].DyesandPigments,2007,72(2): 212- 216.
[9] Deng J L.Grey System Theory Basic[M].Wuhan: Huazhong
University of Science and Technology Press,2002: 56-78.(in Chinese)
[10] Estrada-Flores S,Merts I,de Ketelaere B,etal.Development and Validation of “Grey-Box” Models for Refrigeration Applications: a Review of Key Concepts[J].InternationalJournalofRefrigeration,2006,29(6): 931-946.
[11] Wu C G.Improvement and Application of GM (1,1) Model and MATLAB Realization[D].Shanghai: East China Normal University, 2010: 12- 45.(in Chinese)
[12] Cao Y D.Passenger Car Axle Temperature Prediction Algorithm Based on Metabolic GM (1,1) Model[J].RailwayLocomotive&CAR,2011,311(1): 49-51.(in Chinese)
[13] Sun Y L,Wang M T.Prediction for Fatigue Life Based on Grey Model GM(1,1)[J].ScienceTechnologyandEngineering, 2011,11(3): 560-562.(in Chinese)
[14] Hao N B,Liao H B.Prediction of Power Transformer Faults Based on Grey Theory[J].Computer&DigitalEngineering, 2011,39(1): 138-142.(in Chinese)
[15] Lian R J,Lin B F,Huang J H.A Grey Prediction Fuzzy Controller for Constant Cutting Force in Turning[J].InternationalJournalofMachineToolsandManufacture,2005,45(9): 1047-1056.
[16] Zhu C H,Li N P,Re D,etal.Uncertainty in Indoor Air Quality and Grey System Method[J].BuildingandEnvironment,2007,42(4): 1711-1717.
[17] Li X F.Predicting GM(1,N) Model for the Coefficient of Variation of Hectometer Yarn’s Weight [J].JournalofDonghuaUniversity, 2010,27(3): 391-394.
[18] Zhao T.Dyeing & Finishing Technology and Principle[M].Beijing: Textile Industry Press,2009: 42- 45.(in Chinese)
 Journal of Donghua University(English Edition)2013年6期
- Journal of Donghua University(English Edition)的其它文章
- Comparison of the Vortex and Ring Spun Cotton Yarns and Their Knitted Fabric Properties
- Determination Method on Initial Pretension of Cables in Steel Mega Frame and Pre-stressed Composite Bracing Structure
- Curing Behaviors and Thermal Properties of Dimer Fatty Acid(DFA) Modified Multifunctional Epoxy Resin
- Scheduling Multiple Orders per Job with Multiple Constraints on Identical Parallel Machines
- Properties of Novel Reactive Transfer Printing of Silk
- Mechanical and Abrasion Properties of Polyethylene Terephthalate Films Coated with SiO2/Epoxy Hybrid Material