NPLS 技术及其在高速飞行器气动研究中的应用
2014-11-21 00:42易仕和田立丰
实验流体力学 2014年1期
易仕和,陈 植,何 霖,武 宇,田立丰
(1. 国防科学技术大学 航天科学与工程学院,长沙 410073; 2. 防空兵学院,郑州 450052)
0 Introduction
Complex flow field occurs around and inside an aircraft,such as compressible boundary layer,shock/boundary layer interaction,complex engine flows and so on as shown in Fig.1,when it speeds up to supersonic or hypersonic[1]. To improve the performance of high speed flight,endeavors have been made in the past several decades. However,for the complexity and instability of the supersonic turbulence,studying its fine structures and flow mechanism is very difficult. The existing experimental methods have their own shortages for supersonic turbulence study,such as Schlieren,filtered Rayleigh scattering ( FRS) ,and planar laser induced fluorescence ( PLIF) ,and the main reasons are their low resolution and signal noise ratio ( SNR)[2]. NPLS,as a newly developed flow visualization technique by the authors'group,can visualize temporal-resolved flow structures in a cross-section of instantaneous 3D supersonic flow at high spatiotemporal resolution[3]. In recent years,Yi's many studies have demonstrated that NPLS is a powerful tool to study supersonic flow,especially for supersonic turbulence[4-6]. In 2007,Zhao et al visualized the flow structure of pressure unmatched supersonic mixing layer using NPLS,and discussed the influence of shock wave and expand wave on structures of mixing layer and the influence of pressure unmatched[7]. Based on NPLS,Zhao Yuxin et al studied the shocklet in supersonic turbulent mixing layer,and in NPLS images the shocklets could be easily distinguished[8]. Zhao et al studied the interaction between shock wave and turbulent mixing layer based on NPLS[9],and observed the interaction between oblique shock wave and boundary layer and the influence of large vortex in mixing layer on oblique shock wave. In 2008,based on NPLS images of supersonic turbulent mixing layer,Yi et al studied the fractal dimension of transition region and turbulence region of supersonic mixing layer. And they found that in the transition region,the fractal dimension increases with turbulence,and in the turbulence region,the fractal dimension doesn't vary apparently[10]. TIAN et al visualized the supersonic flow around a concave optical spheric conic model by NPLS,and the NPLS images revealed shock wave,expansion wave,turbulent boundary layer and wake in the flow. In 2009,Yi et al studied the supersonic mixing layer with the convective Mach number of 0.5. From the NPLS image of supersonic mixing layer,readers can easily distinguish the fine structures,and estimate its transitional region. Based on the NPLS images,the control effect could be estimated easily[11-12]. And as shown in the NPLS images,Yi et al analyzed geometrical character and temporal evolution of large-scale structure of turbulent boundary layer. In 2009,Yi et al introduced NPLS technique in detail[13-15]. Nanoparticles are used as NPLS tracer,and pulse planar laser is used as its light source. By recording location of the tracer particles with CCD,the flow structure with high spatiotemporal resolution can be imaged in NPLS image. In literature,the flow-following ability and the scattering characteristics of nanoparticles were studied,and the results showed that the dynamic behavior and light scattering characteristics of nanoparticles make NPLS be able to image the supersonic flow structure at high spatiotemporal resolution and SNR.
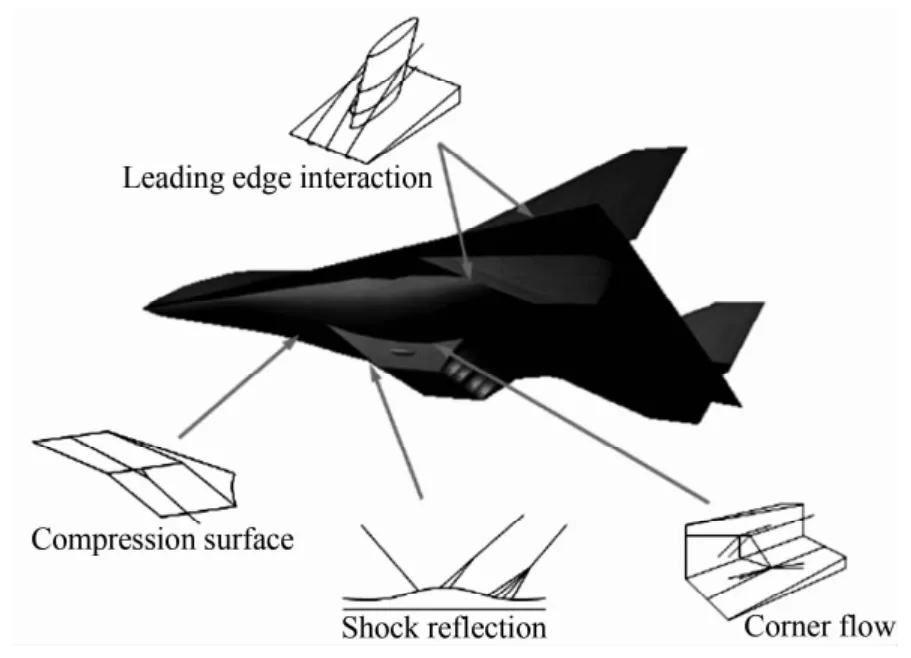
Fig.1 Schematic of complex flow field involved with a high speed vehicle[1]图1 高速飞行器相关的复杂流场结构示意图[1]
Based on NPLS technique,several methods have been developed by the authors. In 2009,Tian et al developed a density measurement method named NPLSbased density technique ( NPLS-DT) . This technique can measure planar instantaneous density field in 3D supersonic flow by calibrating the relationship between density field and gray of NPLS image,and has high spatiotemporal resolution[16-18]. In 2010,YI S H et al proposed an aero-optical aberration measuring method,NPLS-based wavefront technique ( NPLS-WT) . This method has three significant innovations: (1) high spatiotemporal resolution; ( 2) it can avoid the integral effects and study the wavefront aberration induced by the flow field of interest locally; (3) it can avoid the influence from the test section wall boundary layers and environmental disturbances[19-20]. Based on the density-velocity simultaneous measurement method, Reynolds stress of supersonic turbulence can be obtained through special experimental arrangement.
1 NPLS techniques
The authors have studied on measuring the structures of supersonic turbulence by non-intrusive method in recent years,including the traditional interferometry and the optical scattering. The results indicate that because of the influences of compressibility,shock wave,instability and other factors,the traditional visualization and measurement methods encounter some difficulties.For supersonic flow,the flow visualization technique based on Mie scattering cannot satisfy the requirement of following the flow faithfully,especially when there are shock waves. On the other hand,for the techniques based on molecule tracer,more expensive intensified CCD is necessary because of its weak signal. Thus,it is difficult to achieve high spatiotemporal resolution for these techniques.
Rapid developments and extensive applications of modern laser technology,imaging,image process technologies,and nanotechnology offer the opportunity for measuring the fine structures of supersonic flow. And in this condition,the authors developed NPLS technique several years ago,which can image fine structures of supersonic flow at high spatiotemporal resolution.
As shown in Fig.2,the NPLS system is composed of light source system,nanoparticle generator,recording system,synchronization system,and a computer. The light source is a dual-cavity Nd: Yag laser,whose wavelength is 532nm,laser pulse width is 6ns,and the maxima pulse energy is 500mJ. A laser sheet with thickness of about 0.5mm is formed by the sheet optics system,and then illuminates the flow region of interest. The nanoparticle generator is driven by high pressure,and the concentration of the output particles can be adjusted. The recording system is an interline transfer CCD whose resolution is 2048 ×2048 and the shortest time interval of double-exposure is 0.2μs. The synchronizer receive signals sent from the computer,and control the time sequences of laser and the CCD to make sure that the two laser beams are exposed in the frames of dualexposure respectively. The computer not only sends synchronization signals to the synchronizer,but also stores and processes NPLS images. With the dual-exposure technique,NPLS can measure the instantaneous flow structure,and the temporal evolution of the flow between the two pulses can also be yielded.
The flow-following ability of the NPLS tracer particle in supersonic flow was studied from particle dynamics by Zhao Y X,et al[3],and the particle diameter was measured with oblique shock wave calibration experiment,as shown in Fig.3. The effective diameter of nanoparticle of NPLS is 42.5nm,and its relaxation time is 66.3ns. As a flow visualization technique,NPLS focuses on holistic scattering character of a cluster of particles,whose scattering character can be calculated from Mie scattering theory,and the results revealed that its scattering character is relative to scattering angle,wavelength of incident laser,its diameter and refractive index.

Fig.2 The schematic of NPLS system图2 NPLS 系统示意图

Fig.3 NPLS image of shock wave and relative grey across it图3 斜激波NPLS 图像及垂直激波方向的相对灰度分布
Based on NPLS,a density measurement method( NPLS-DT,NPLS-based Density Technique)was first proposed by Tian et al. The main principle is that in the working range of CCD,the variation of gray scale of the images represents the variation of local density in the flow. The relationship between gray scale and local density can be qualified after removing the effects from background,dark signal and non-uniform distribution of laser sheet. To be brief,it can be divided into 3 steps. First,NPLS is affirmatively used to get high SNR images of testing flow field. Second,these NPLS images should be calibrated to eliminate impacts from background,dark signal and laser non-uniformity. Third,perform a density field calibration to work out the relationship:

To solve this problem,a series of ρi=f( Ii) ,i =1,2,3…is needed. Mount a wedge in the testing chamber and get NPLS images of oblique shock,then work out the density of sampling region downstream of the oblique shock based on the oblique shock equation,and get a first pair of sample data ( ρ1,I1) . Change the angle of the wedge; repeat this process to obtain a series of ρi=f( Ii) ,i=1,2,3…,as shown in Fig.4( c) . Owning to this method,Reynolds stress distribution can be obtained by performing density-velocity simultaneous measurement.
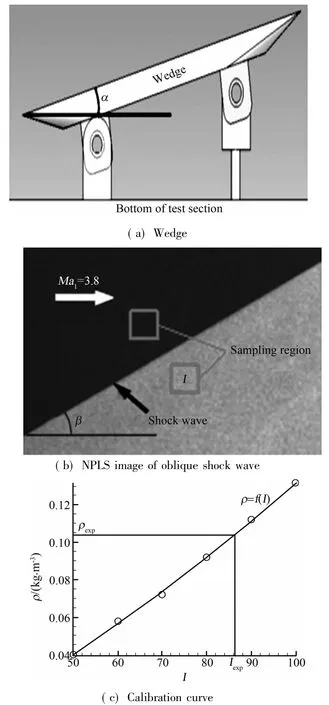
Fig.4 Density field calibration图4 密度场校准
2 NPLS application in supersonic flows
For the advantages of NPLS in measuring fine structures of supersonic turbulence,several typical supersonic flows were studied, including supersonic boundary layer,shock/boundary layer interaction,mixing layer and so on.
2.1 Supersonic boundary layer
Supersonic boundary layer,a typical flow,has been studied using NPLS in the past several years. The flow structures of the supersonic boundary layer in vertical plane and spanwise plane were captured by NPLS.As shown in Fig. 5,it is a NPLS image of flat plate boundary layer in vertical plane in Ma = 3 flow. The flow region is 100 ~320mm from the leading edge of plate. Fig.5 displays the whole transition process of the boundary layer. Until 180mm distance from the leading edge,the flow is still laminar. Then the flow transits into turbulence and becomes fully developed from X =250mm. Fig. 6 and Fig. 7 are the flow regions within 170 ~250mm and 190 ~220mm from the leading edge of the plate,respectively. From these images,it is easy to find the development of instability and the emergence of hairpin vortexes. Fig.8 is the NPLS image of fully developed turbulent boundary layer,which is at the location of 250 ~320mm from the leading edge. Compared with the cases in Fig.6 and Fig.7,the flow structures in Fig.8 are different absolutely and much more complex.However,the fine structures in the turbulent boundary layer are revealed clearly in Fig.8 all the same. Fig.9( a) shows the spanwise NPLS image of supersonic boundary layer corresponding to Fig. 8. And in addition,the fully developed turbulent boundary layer of wind tunnel is different from that on a flat plate,as shown in Fig. 9 ( b) . By performing PIV technique,time-averaged streamwise velocity profiles at different locations and Reynolds stress distributions of turbulent boundary layer are present as shown in Fig.10 to Fig.12 by velocity-density measurements.The flow structures of the transition region of supersonic boundary layer in different spanwise planes are shown in Fig.13 which reveals the hairpin vortex. While that of fully developed turbulent boundary layer is shown in Fig. 14 revealing the self-similar feature of turbulent boundary layer.

Fig.5 NPLS image of supersonic boundary layer in Ma=3 flow图5 Ma=3 超声速边界层NPLS 图像
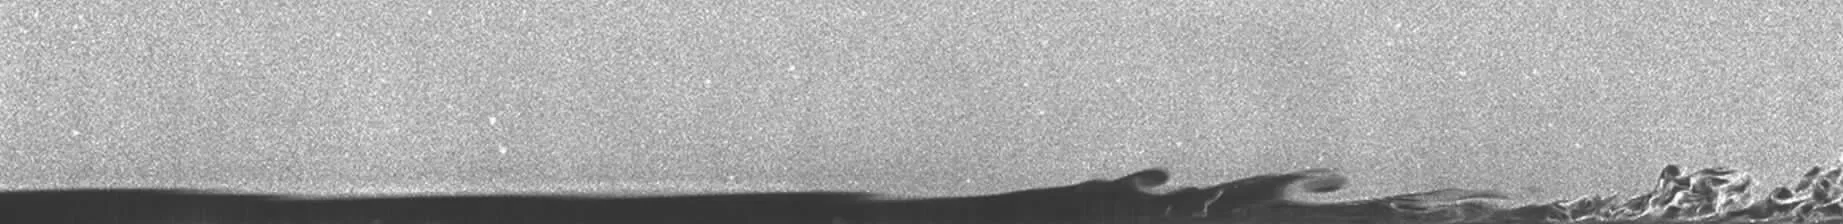
Fig.6 NPLS image of supersonic boundary layer in the front of the plate图6 平板前缘区域的超声速边界层NPLS 图像
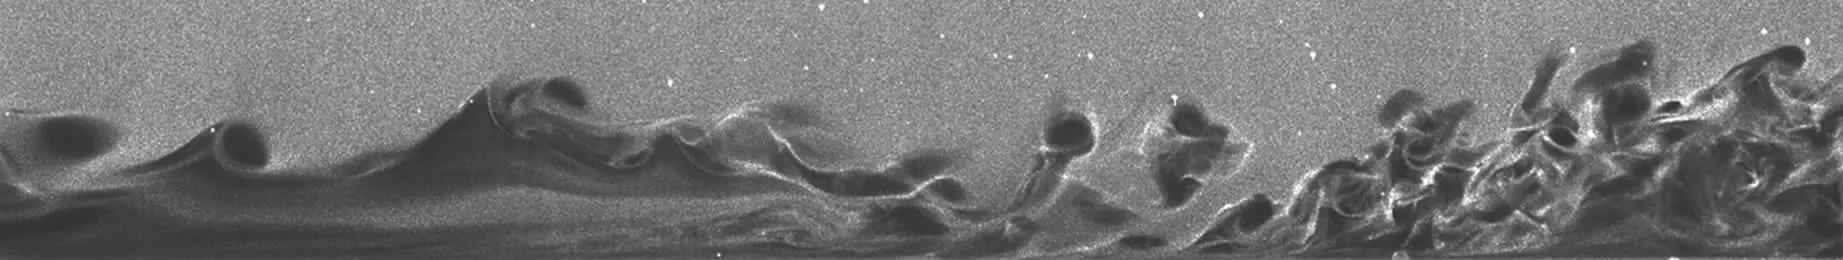
Fig.7 NPLS image of supersonic boundary layer in the middle of the plate图7 平板中段的超声速边界层NPLS 图像

Fig.8 NPLS image of fully developed supersonic turbulent boundary layer图8 充分发展的超声速边界层NPLS 图像

Fig.9 Spanwise NPLS image of supersonic boundary layer in Ma=3 flow ( a) and the fully developed supersonic turbulent boundary layer of the wind tunnel ( b)图9 超声速边界层展向结构的NPLS 图像( a) ; 超声速风洞充分发展的湍流边界层的NPLS 图像( b)
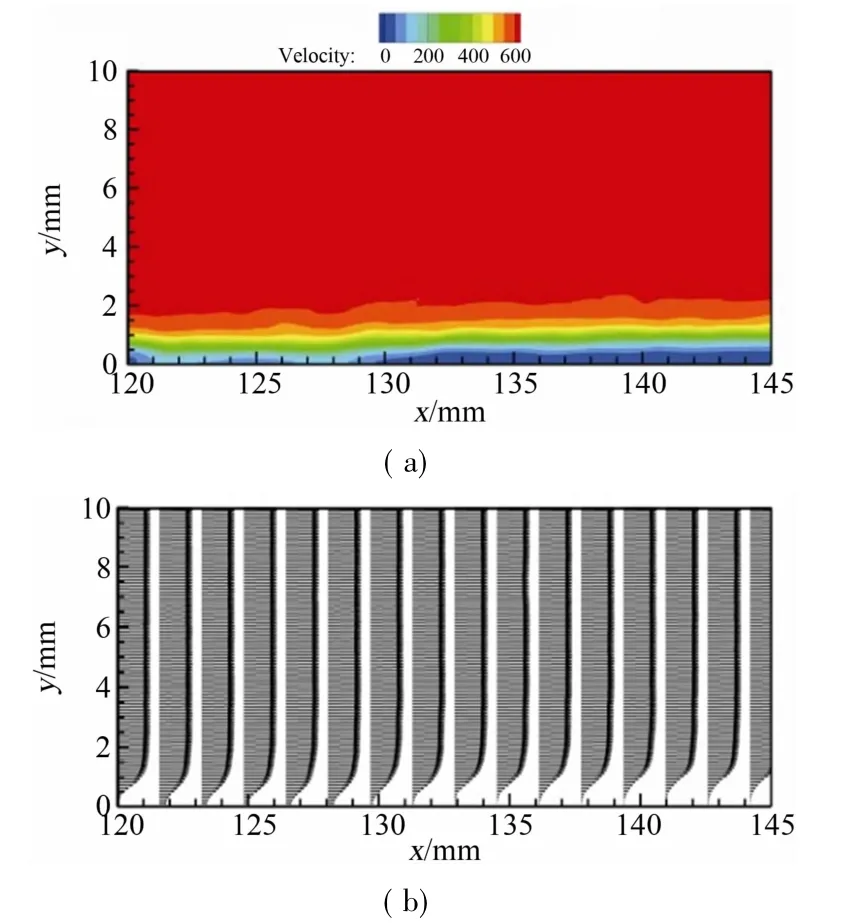
Fig.10 Time-averaged velocity of supersonic boundary layer in the front of the plate corresponding to Fig.6图10 与图6 对应的平板前缘超声速边界层的时间平均速度剖面
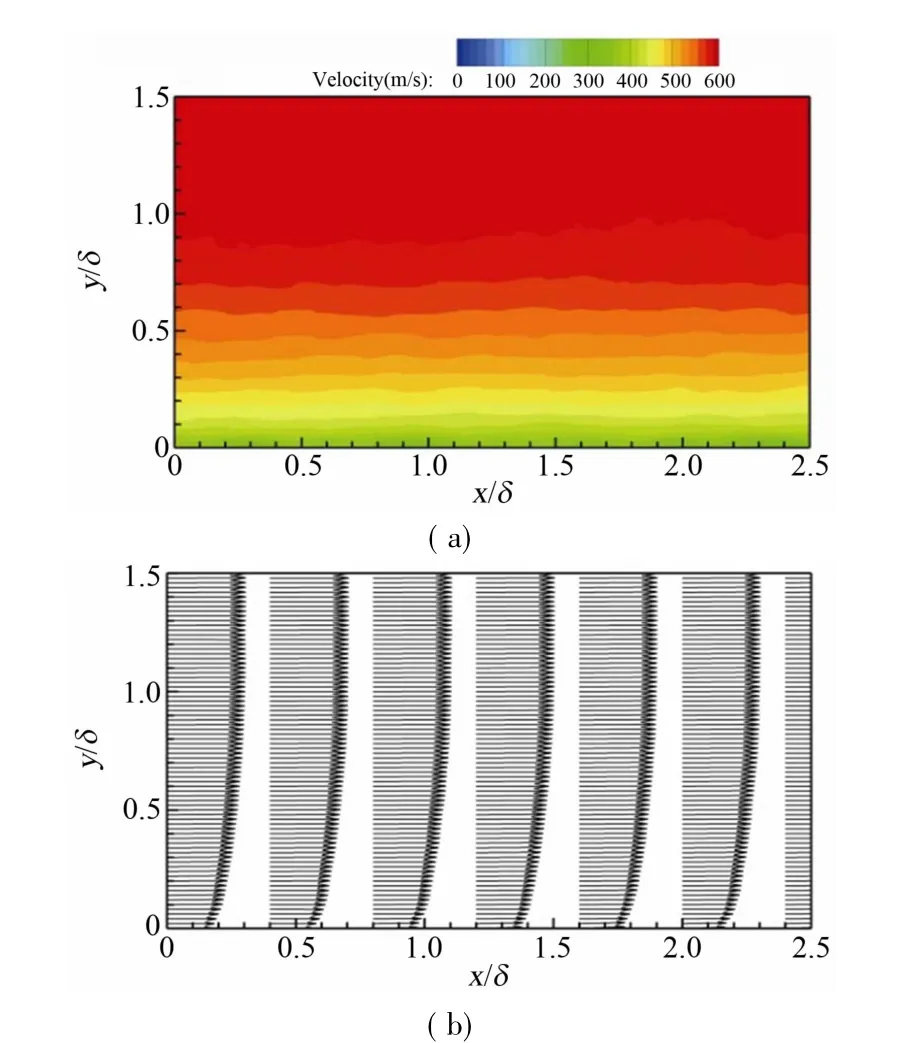
Fig.11 Time-averaged velocity of fully developed supersonic turbulent boundary layer corresponding to Fig.8图11 与图8 对应的充分发展的超声速湍流边界层的时间平均速度剖面
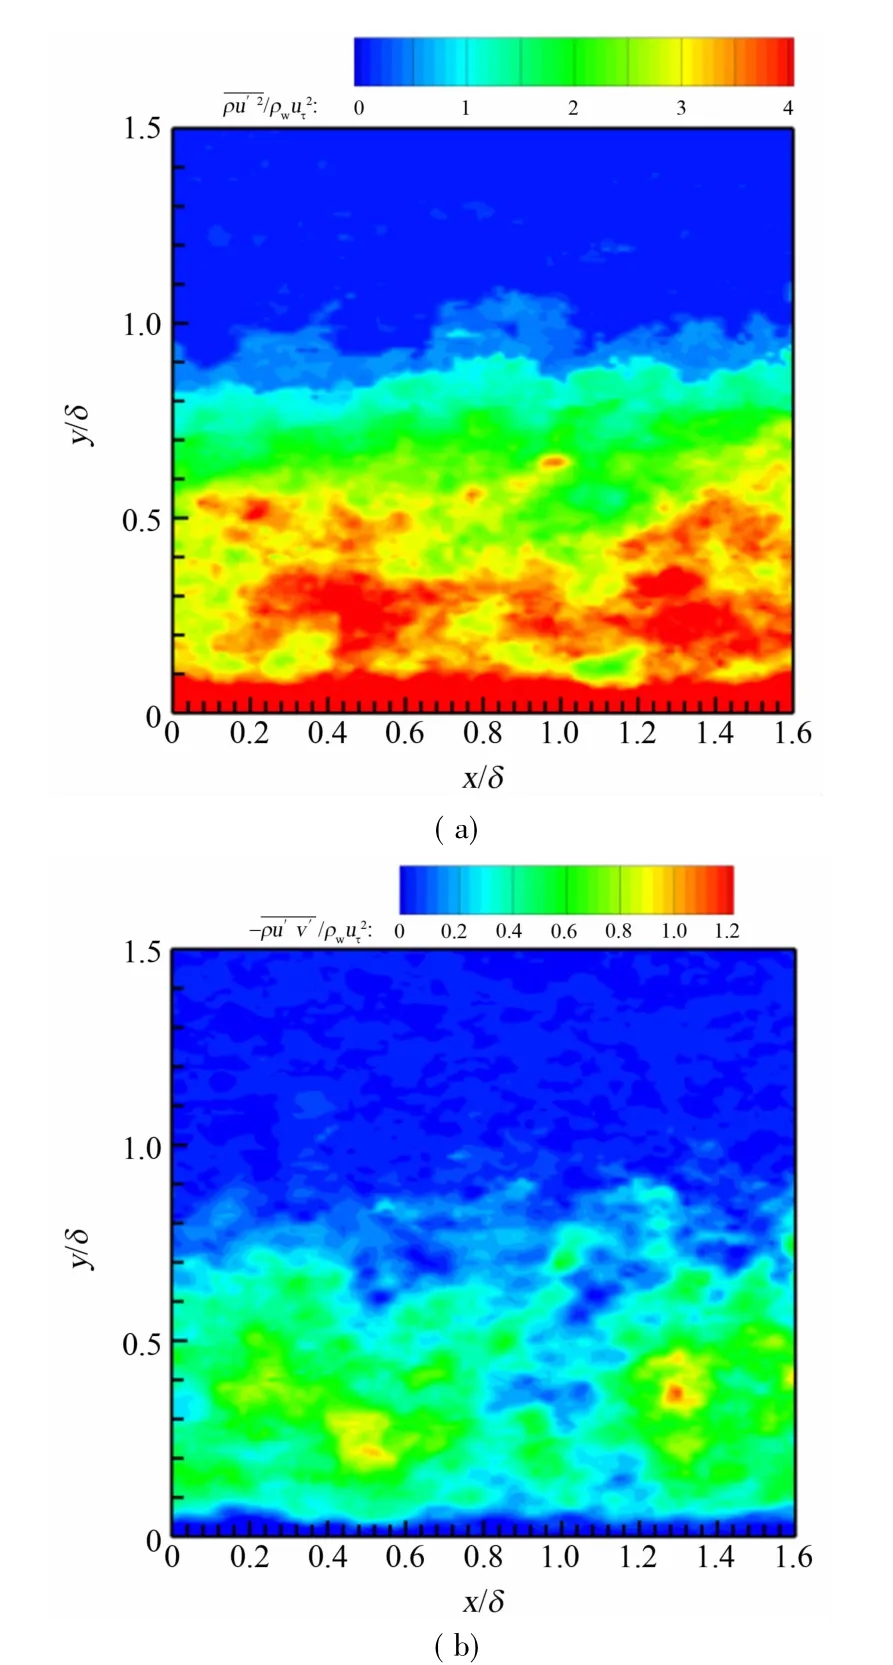
Fig.12 Reynolds stress distribution of fully developed supersonic turbulent boundary layer corresponding to Fig.9( b)图12 与图9(b)对应的充分发展的超声速湍流边界层的雷诺应力分布
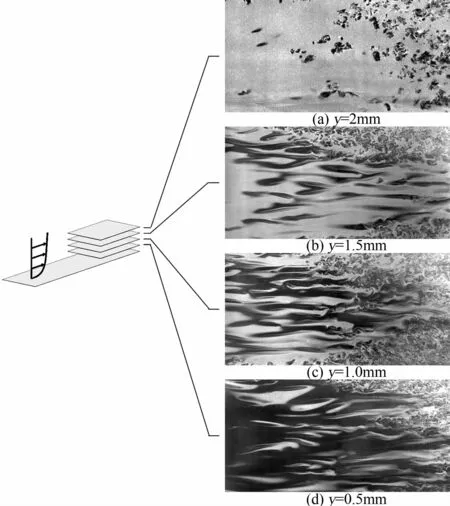
Fig.13 Spanwise structures in the transition region of supersonic boundary layer图13 超声速边界层转捩区的展向结构

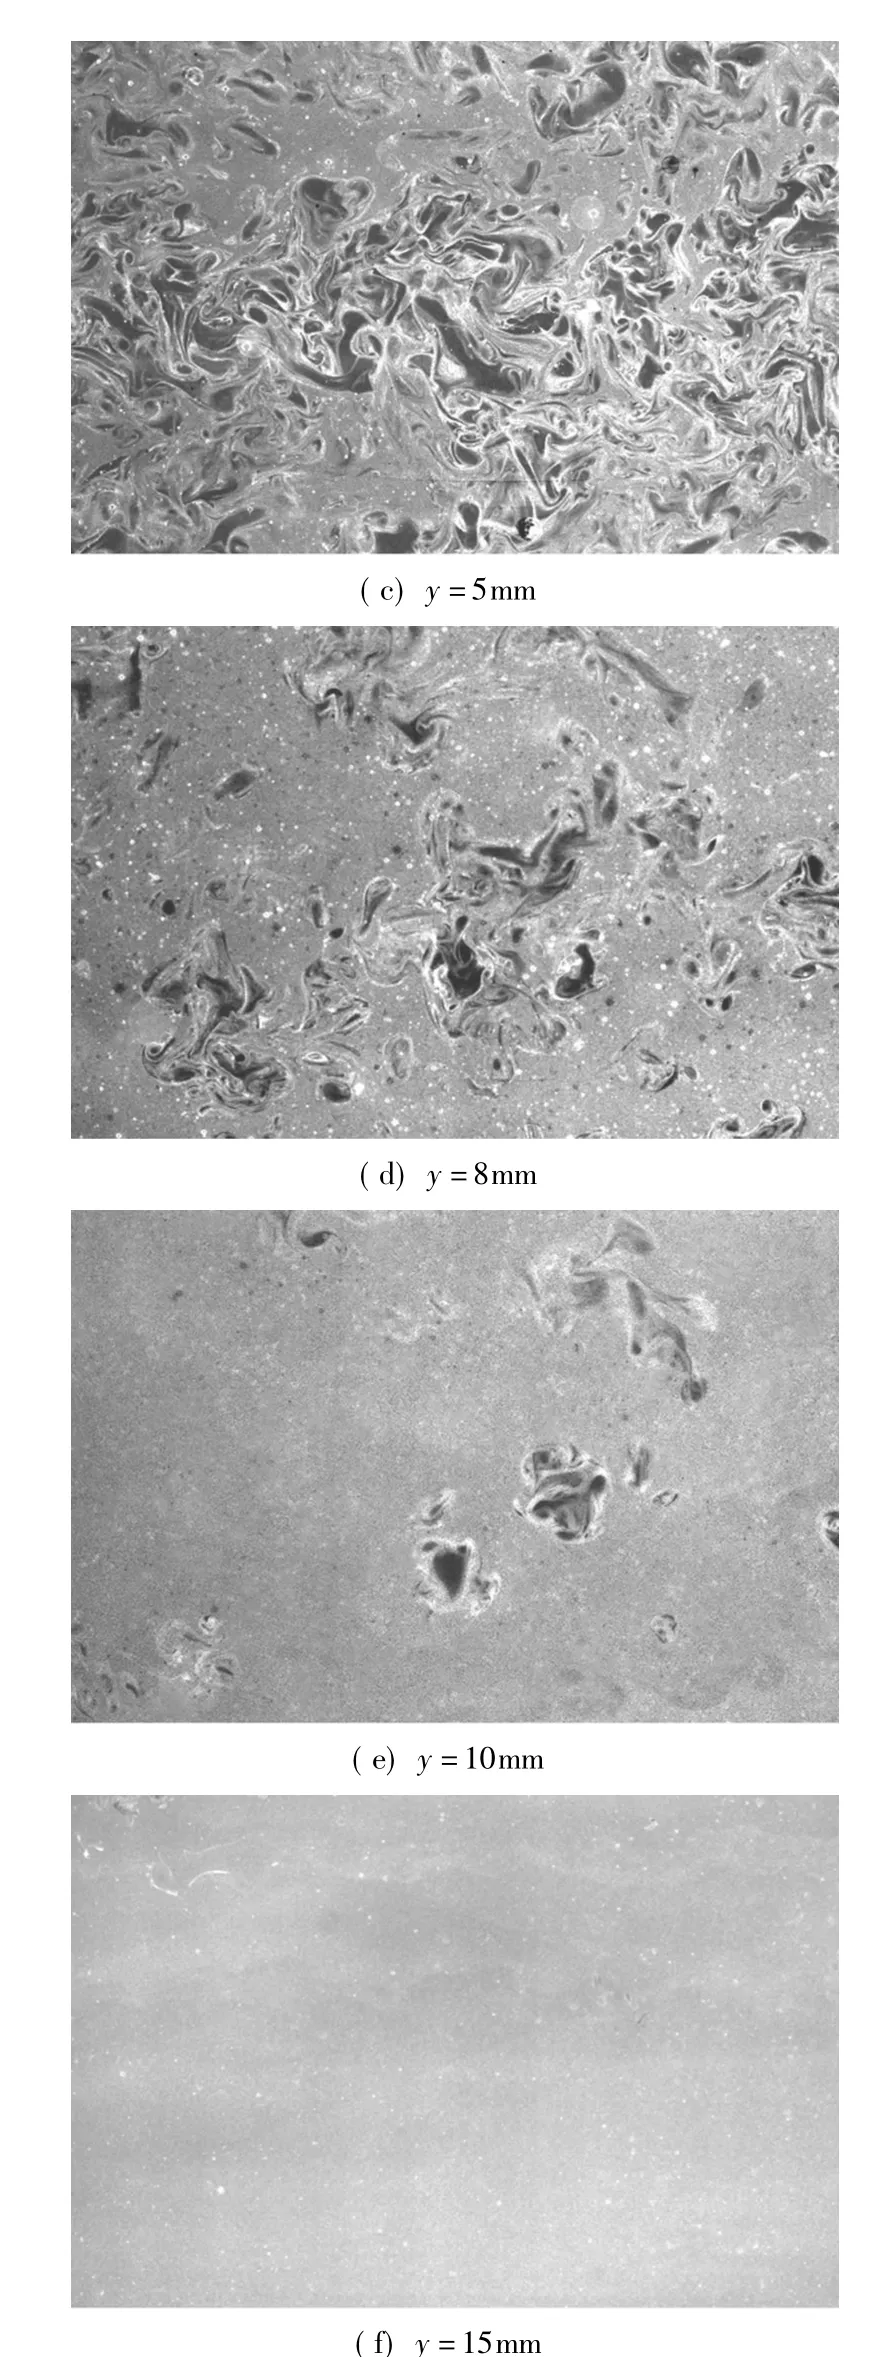
Fig.14 Spanwise structures of fully developed supersonic turbulent boundary layer图14 充分发展的超声速湍流边界层的展向结构
2.2 Shock/boundary layer interaction
Based on NPLS,the structure of shock/boundary layer interaction ( SWBLI) was studied. As shown in Fig.15,it is the NPLS image of SWBLI in Ma=3 flow,and its spatial resolution is 43.5μm/pixel. The image revealed shock wave,expansion wave,turbulent boundary layer,and separation bubble. From the NPLS image,we can find that the vortex moves downstream,and its transfiguration is not obvious. Using NPLS_DT,the density field of the flow field shown in Fig.15 was measured at high spatial resolution. Density variation and temporal evolution of the SWBLI can be distinguished easily. Fig.16 is the velocity field and the stream lines of the SWBLI flow field.
2.3 Supersonic flow over a compression ramp
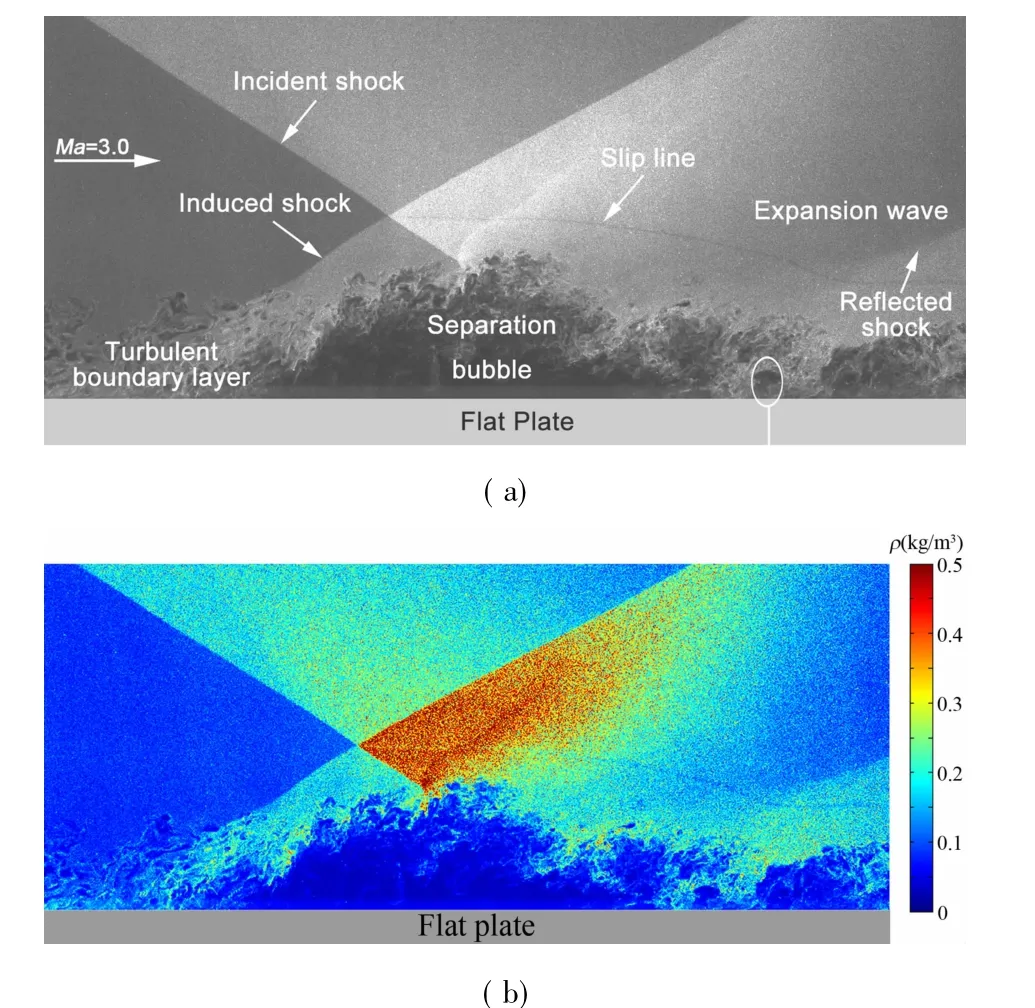
Fig.15 NPLS image ( a) and the corresponding density field( b) of shock/boundary layer interaction in Ma=3 flow图15 Ma=3 激波/边界层相互作用流场的NPLS 图像( a) 以及相应的密度场分布( b)
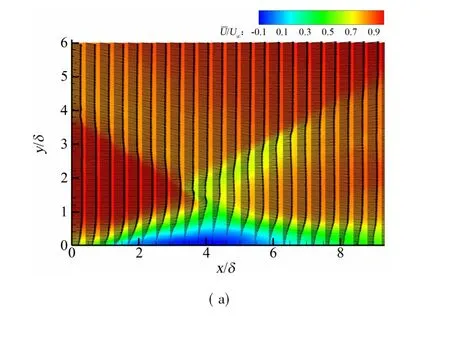
Fig.16 Velocity filed ( a) and the corresponding stream lines ( b) of the flow field as shown in Fig.15图16 与图15 流场对应的速度场( a) 及相应的流线( b)
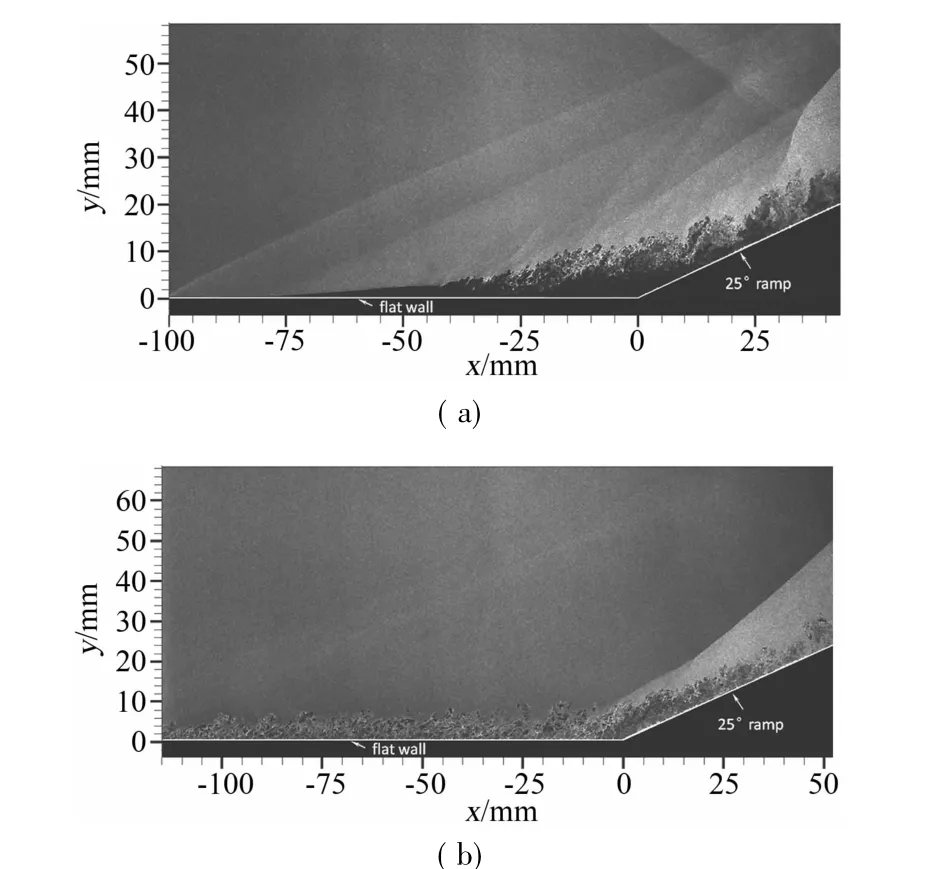
Fig.17 Supersonic laminar flow ( a) and supersonic turbulent flow ( b) over a compression ramp图17 超声速层流压缩拐角流动( a) 及超声速湍流压缩拐角流动( b)
NPLS images of supersonic laminar/turbulent flow over a compression ramp are shown in Fig.17,it can be seen distinctly from the images that there are obvious differences between the laminar flow and the turbulent flow in compression ramp,even though the ramp angle is the same. For laminar flow,the of the supersonic flow and its transition to turbulence are rapid. Flow separation occurs due to the influence of adverse pressure gradient. Some typical flow structures such as K-H vortices,shear layer,separation shock and reattachment shock are visible clearly. However the thickness of turbulent boundary layer does not increase obviously and there is not evident separation in the flow field,as shown in Fig.17 ( b) . The boundary layer adheres to the wall in the whole flow field. These experimental results of flow visualization have revealed that,compared with laminar flow,the performance of turbulent flow is more stable when suffering the effects of adverse pressure gradient,and is more difficult to separate.
2.4 Transition of the hypersonic boundary layer
The following ability,scattering characteristic and reuniting of nano particles are the key points under the consideration of NPLS. The distribution of nano particles can reveal the exact flow field structures as long as its following ability meets the flows. However,when tested flow accelerates to hypersonic,the following ability of nano particles would be challenged again. NPLS was applied in the KD-01 shock wind tunnel to study hypersonic flow as shown in Fig 18. In Fig.19,it is the hypersonic flow structure of boundary layer transition measured by NPLS. The boundary layer changed from laminar to turbulent. By now,investigations on separating and scattering nano particles have to be kept going on,in order to improve NPLS technique and make it more applicable in hypersonic flow measurements development
2.5 Supersonic mixing layer
Fig.18 The schematic diagram of the model图18 模型示意图

Fig.19 NPLS image of hypersonic boundary layer transition图19 高超声速边界层转捩结构的NPLS 图像
In the past several years,spatiotemporal characteristic of supersonic mixing layers with convective Mach number 0.12,0.21,0.24,0.32,0.50 and 0.60 were studied by the authors. The supersonic mixing layer wind tunnel is designed using double supersonic laminar nozzle and optical accesses for non-intrusive measurement,which can generate uniform flow filed with low noise,as shown in Fig.20. Changing the Mach number of the double nozzle,various convective Mach number can be gained for experimental study. The results revealed Kelvin-Helmholtz instable vortexes in the flow field. Its spatial features and temporal evolution can be yielded from NPLS images,which are shown in Fig.21.Zhao et al also studied its spanwise structure,and found the intriguing vortexes due to the secondary instability.Fig.22 shows Reynolds stress of supersonic mixing layer in this plane,which is quite valuable for constructing compressible turbulent models.The NPLS technique has been widely used to study other important problems of supersonic mixing layer,including the velocity field of the transition process,the turbulent structure with unmatched pressure,the fractal characteristics of the mixing interface,and the multi-resolution analysis of the density field[11,16-18].
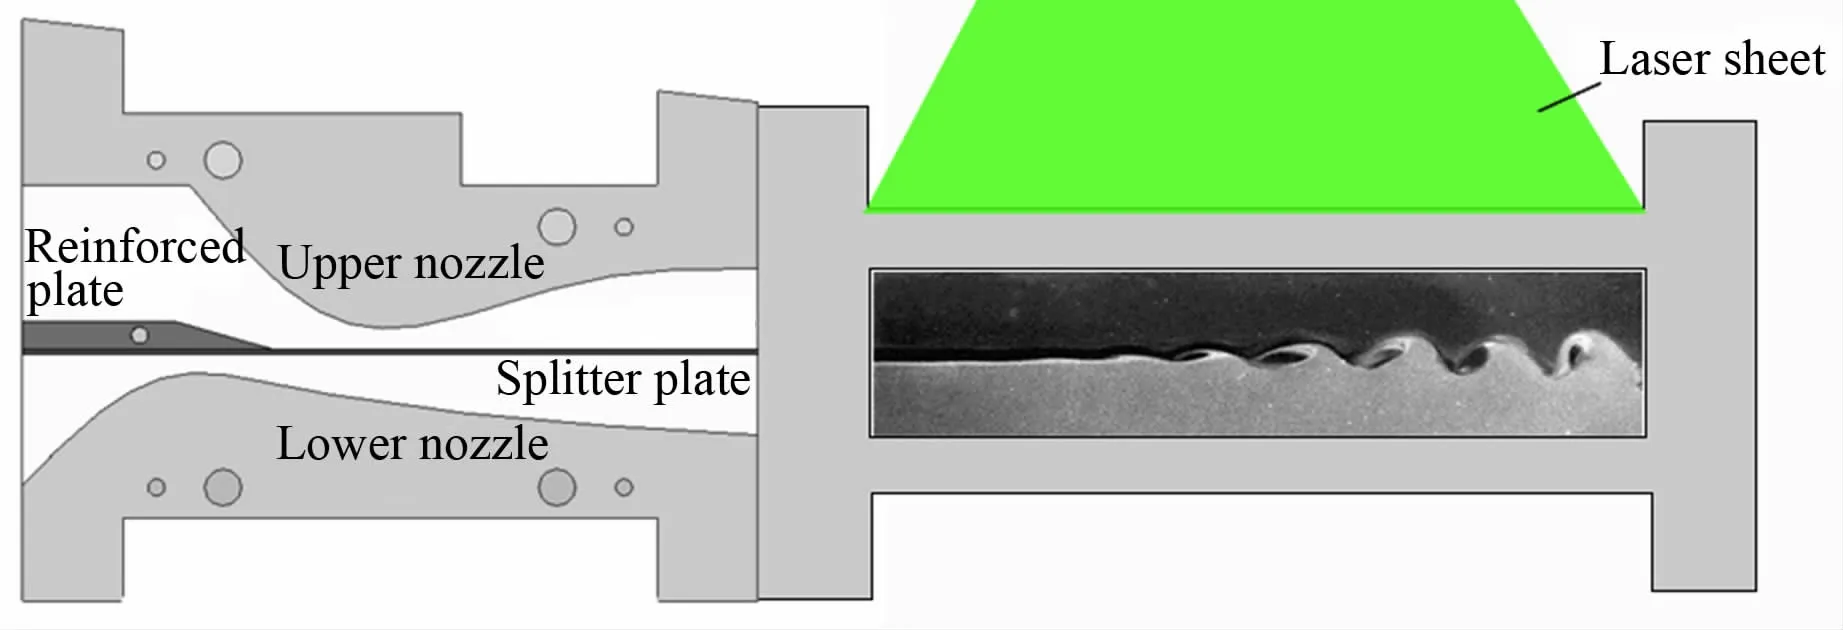
Fig.20 Nozzle section and test section of the supersonic mixing layer wind tunnel图20 超声速混合层风洞喷管段和试验段
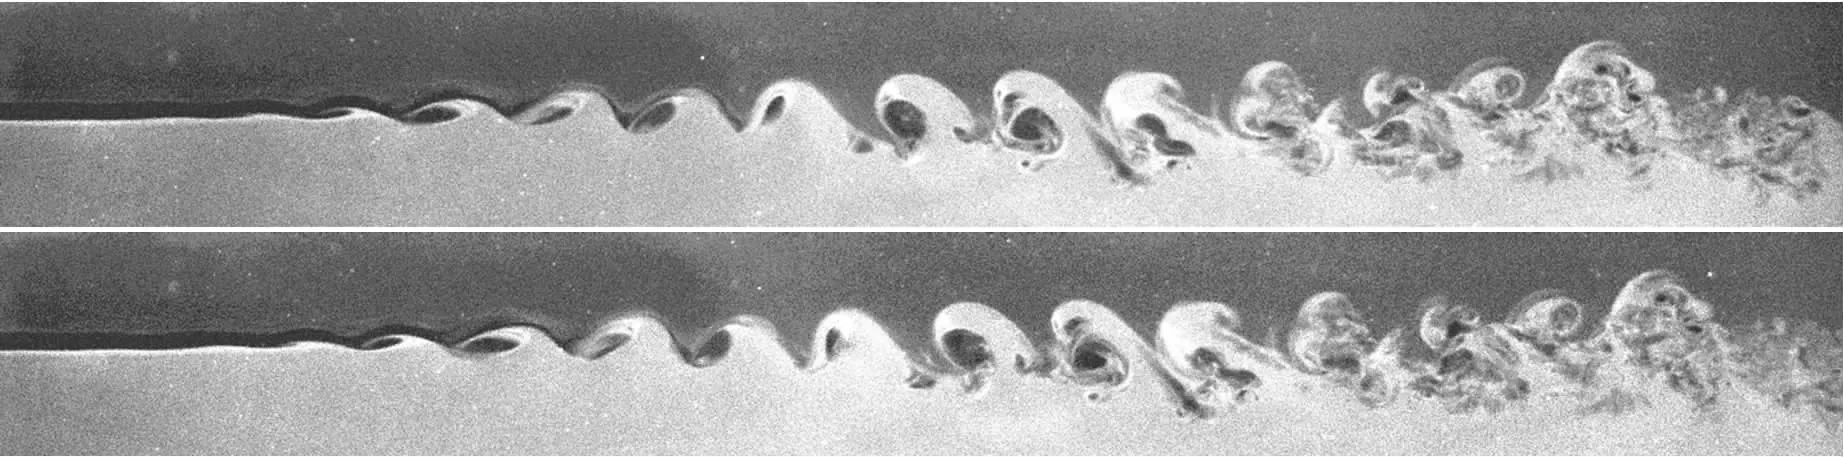
Fig.21 NPLS images of K-H vortices of supersonic mixing layer ( time interval of the images 10μs)图21 超声速混合层K-H 涡的NPLS 图像( 图像间的时间间隔为10μs)

Fig.22 Reynolds stress of supersonic mixing layer图22 超声速混合层的雷诺应力
2.6 Flow around a spheric conic model
The flow field around a spheric conic model in Ma=3.8 flow was studied using NPLS,and its flow structure[6],density field[17],aero-optical effect[19]and velocity field[20],were studied. The structure of the flow around a spheric conic model is rather complex,which includes shock wave,expansion wave,boundary layer and wake. Fig.23 is NPLS image of the flow field and the corresponding density field measured by NPLS_DT.Compared with the results obtained by schlieren,the shock waves in NPLS image is much thinner. The reason is that the spatial resolution of the NPLS is much higher than that of schlieren. The density field in Fig.23 shows clearly the existence of flow structures mentioned above,and the transition of boundary layer.
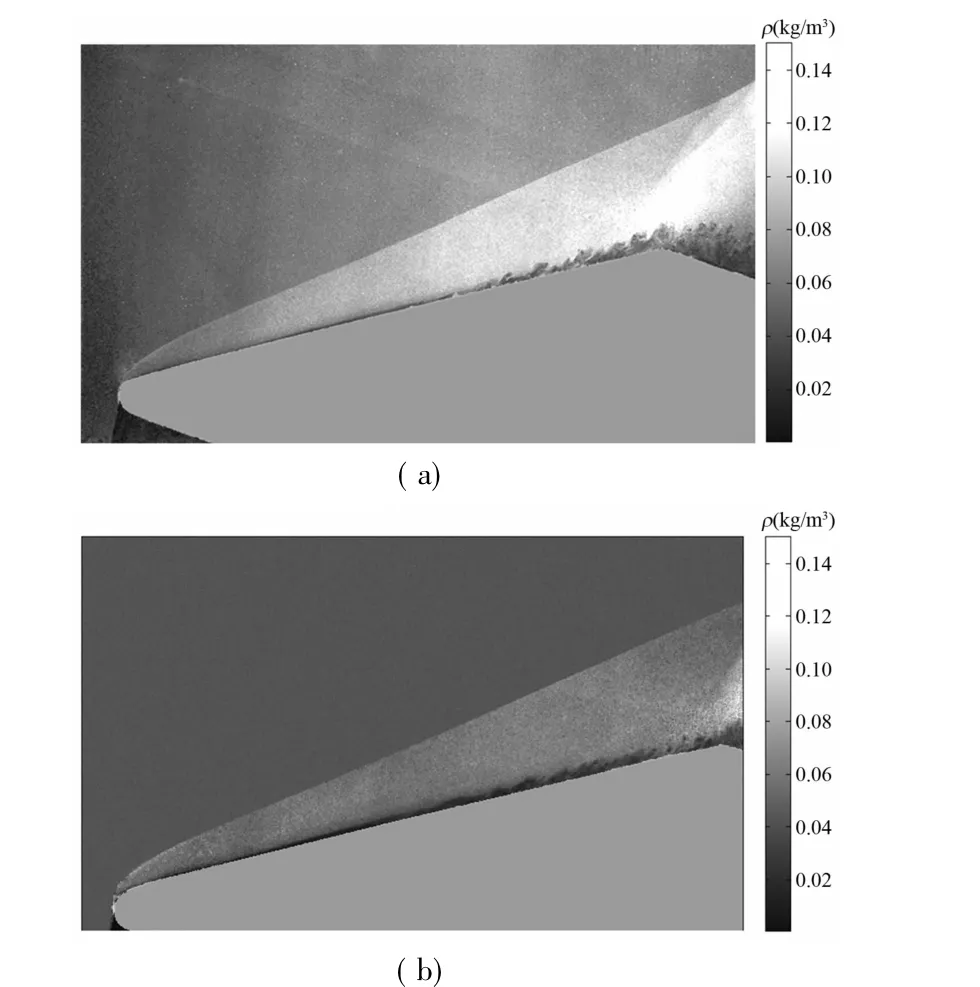
Fig.23 NPLS image and corresponding density field of the flow around a spheric conic model in Ma=3.8 flow图23 Ma=3.8 超声速球锥绕流的NPLS 图像及其相应的密度场分布
3 Conclusions
From the results mentioned above,we can find that NPLS is a powerful tool to visualize the fine structures of supersonic turbulence and measure the corresponding instantaneous density and velocity field. A great number of experiments have been performed,and several important flow structures have been revealed by NPLS images.As a newly developed technique,however,NPLS and its application are still under development.
Currently,the measurement region of NPLS is only the scattering plane of laser pulse,and the temporal-resolved images are restricted to the pair obtained by frame,which prevents it from giving a more complete description of the flow structure. We are now updating the crucial components of the system to overcome these limitations,including employing multi-cavity laser to achieve high repetition frequency ( hundreds of millions per second) ,employing proper CCD with very high recording speed and the synchronizer with accuracy of picosecond. Our ultimate goal is to synchronously measure several parameters ( including density,velocity) of super flow with temporal correlation across many frames.
:
[1] Humble R A. Unsteady flow organization of a shock waveboundary layer interaction[D]. Technische Universiteit Dlft,2008
[2] Yi S H,He L,Zhao Y X,et al. A flow control study of a supersonic mixing layer via NPLS[J]. Sci China Ser G,2009,52(12) : 2001-2006.
[3] Zhao Y X,Yi S H,Tian L F,et al. Supersonic flow imaging via nanoparticles[J]. Science China Ser E-Tech Sci,2009,52(12) : 3640-3648.
[4] Zhao Y X,Yi S H,Tian L F,et al. The quantificational measurement of supersonic mixing layer growth rate[J].Journal of Experiments in Fluid Mechanics,2009,23(3) :100-103.赵玉新,易仕和,田立丰,等. 超声速混合层增长速度定量测量与比较[J]. 实验流体力学,2009,23(3) : 100-103.
[5] Yi S H,Zhao Y X,Tian L F,et al. Recent advances of experimental study of supersonic mixing layer transition[J].Acta Aerodynamica Sinica,2009,27: 114-119.
[6] Tian L F,Yi S H,Zhao Y X,et al. Flow visualization of supersonic flow around a concave optical bow cap model[J]. Journal of Experiments in Fluid Mechanics,2009,23(1) : 15-17.田立丰,易仕和,赵玉新,等. 超声速弹头凹型光学头罩流动显示研究[J]. 实验流体力学,2009,23( 1) : 15-17.
[7] Zhao Y X,Tian L F,Yi S H,et al. Experimental study of flow structure in pressure unmatched mixing layer[J].Journal of Experiments in Fluid Mechanics,2007,21(3) :14-17.赵玉新,田立丰,易仕和,等. 压力不匹配混合层流场结构的实验研究[J]. 实验流体力学,2007,21( 3) : 14-17.
[8] Zhao Y X,Yi S H,He L,et al. The experimental research of shocklet in supersonic turbulent mix layer[J].Journal of National University of Defense Technology,2007,29(1) : 12-15.
[9] Zhao Y X,Yi S H,He L,et al. The experimental study of interaction between shock wave and turbulence[J]. Chinese Science Bulletin,2007,52(10) : 1297-1301.
[10]Zhao Y X,Yi S H,He L,et al. The fractal measurement of experimental images of supersonic turbulent mixing layer[J]. Sci China Ser G-Phys Mech Astron,2008,51( 8) :1134-1143.
[11] Zhao Y X. Experimental investigation of spatiotemporal structures of supersonic mixing layer[D]. National University of Defence Technology,2008.
[12]Yi S H,Zhao Y X,Tian L F,et al. Advances of experimental study to transition of supersonic mixing layer[C]//Proceedings of the 13th National Symposium on Shock Wave and Shock Tube Technology,2008.
[13] Yi S H,Zhao Y X,He L,et al. Experimental study of temporal and spatial characters of the transition of supersonic mixing layer[C]//Proceedings of the 12th National Symposium on Shock Wave and Shock Tube Technology,2006.
[14]Yi S H,Zhao Y X,He L,et al. Fractal study of experiment images of supersonic mixing layer[C]//Proceedings of the 12th National Symposium on Shock Wave and Shock Tube Technology,2006.
[15] Yi S H,Zhao Y X,He L,et al. The quantificational measurement of supersonic mixing layer growth rate based on NPLS image[C]//Proceedings of the 12th National Symposium on Shock Wave and Shock Tube Technology,2006.
[16]Zhao Y X,Yi S H,Tian L F,et al. An experimental study of aero-optical aberration and dithering of supersonic mixing layer via BOS[J]. Science China: Physics,Mechanics &Astronomy,2009,53(1) : 81-93.
[17]Tian L F,Yi S H,Zhao Y X,et al. Study of density field measurement based on NPLS technique in supersonic flow[J]. Sci China Ser G,2009,52(9) :1357-1363.
[18]Zhao Y X,Yi S H,Tian L F,et al. Multiresolution analysis of density fluctuation in supersonic mixing layer[J].Sci China Tech Sci,2010,53(2) : 584-591.
[19]Yi S H,Tian L F,Zhao Y X,et al. Aero-optical aberration measuring method based on NPLS and its application[J]. Chinese Sci Bull,2010,55(31) : 3545-3549.
[20]He L,Tian L F,Yi S H,et al. PIV study of supersonic flow around an optical bow cap[J]. Journal of Experiments in Fluid Mechanics,2010,24(1) : 26-29.何霖,田立丰,易仕和,等. 超声速光学头罩流场的PIV 研究[J]. 实验流体力学,2010,24(1) : 26-29.
猜你喜欢
湘潭大学自然科学学报(2022年2期)2022-07-28
军民两用技术与产品(2022年2期)2022-06-01
凤凰动漫(军事大王)(2022年1期)2022-04-19
空气动力学学报(2020年1期)2020-11-29
空间科学学报(2020年3期)2020-07-24
航空发动机(2020年3期)2020-07-24
空间科学学报(2020年4期)2020-04-22
北京航空航天大学学报(2017年1期)2017-11-24
太空探索(2016年7期)2016-07-10
国外科技新书评介(2014年12期)2015-01-05