
Cascaded projection of Gaussian m ixturemodel for emotion recognition in speech and ECG signals
2015-07-25 06:04HuangChengweiWuDiZhangXiaojunXiaoZhongzheXuYishenJiJingjingTaoZhiZhaoLi
Huang ChengweiWu DiZhang XiaojunXiao ZhongzheXu YishenJi JingjingTao ZhiZhao Li
(1College of Physics,Optoelectronics and Energy,Soochow University,Suzhou 215006,China)
(2School of Information Science and Engineering,Southeast University,Nanjing 210096,China)
Cascaded projection of Gaussian m ixturemodel for emotion recognition in speech and ECG signals
Huang Chengwei1Wu Di1Zhang Xiaojun1Xiao Zhongzhe1Xu Yishen1Ji Jingjing1Tao Zhi1Zhao Li2
(1College of Physics,Optoelectronics and Energy,Soochow University,Suzhou 215006,China)
(2School of Information Science and Engineering,Southeast University,Nanjing 210096,China)
A cascaded projection of the Gaussian mixture model algorithm is proposed.First,the marginal distribution of the Gaussian mixture model is computed for different feature dimensions,and a number of sub-classifiers are generated using the marginal distribution model.Each subclassifier is based on different feature sets.The cascaded structure is adopted to fuse the sub-classifiers dynamically to achieve sample adaptation ability.Secondly,the effectiveness of the proposed algorithm is verified on electrocardiogram emotional signal and speech emotional signal.Emotional data including fidgetiness,happiness and sadness is collected by induction experiments.Finally,the emotion feature extraction method is discussed,including heart rate variability,the chaotic electrocardiogram feature and utterance level static feature.The emotional feature reductionmethods are studied,including principle component analysis,sequential forward selection,the Fisher discriminant ratio and maximal information coefficient.The experimental results show that the proposed classification algorithm can effectively improve recognition accuracy in two different scenarios.
Gaussian mixture model;emotion recognition;sample adaptation;emotion inducing
V ariousmachine learning algorithms have been studied in realworld applications.Affective recognition is one of the emerging fields that benefit significantly from learning algorithms.Previous studies[13]proposed various ways to extract emotional features in the physical signal space.By using signal processing and machine learning algorithms,we canmap the signal features to the psychological emotional state and recognize people’s emotions.Themost common sensorswe can use to collect the emotional signals are m icrophones,cameras,and physiological body sensors.
The speech signal recorded by am icrophone orm icrophone array can be used for speech emotion analysis.Speech emotion modelling algorithms have been studied by many researchers from various backgrounds.In the recent researches on the FAU Aibo Emotion Corpus[4],the Gaussian m ixture model(GMM)-based classifiers achieved prom ising results[5].The GMM is suitable for modelling the static emotional features at the utterance level.For an alternative way to monitor people’s emotional state,we can build an emotion recognition system based on electrocardiogram(ECG)signals.A body sensor is commonly used in many health care solutions and it is easy to carry.Further research progress in the field of health monitoring can be found in the survey in Ref.[6].
There are still many challenges in emotion modelling[7].In this paper,we propose an optim ization framework that can be generalized to both speech and ECG emotion recognition.There are two reasons that we choose to use these two types of data.First,they are commonly available in human-computer interaction.Secondly,they show different characters of data distributions,which is suitable for verifying the generalizing ability of our algorithm.These two types of signals are easy to transmit in w ireless channels,requiring less bandw idth in comparison w ith video signals.The sensors are also simple to integrate in wearable systems.
In emotion recognition,some of the testing data may be located far away from the training data in the feature space.These sample points are likely to be m isclassified and often have low likelihoods.The reason for the m isclassification is that not all of the selected features fit the testing sample.Some of the feature dimensionsmay lead to the opposite decision in the classification stage.We can improve the GMM classifier by selecting different feature dimensions according to the individual testing sample.In ourmethod,feature selection is carried outafter the training stage,which is the main difference from the traditional learning framework.The emotional data is often insufficient in training,while the testing dataset often contains patterns that are not well learnt.Therefore,some of the selected features in the training stagemay be unsuitable for the testing sample.In the GMM-basedclassifier,each feature dimension corresponds to a marginal probability distribution that can be used to classify the current testing sample.Not all of the trained features contribute in the same way,and some of them lead us to w rong decisions.Therefore,if we remove these unsuitable feature dimensions,we can obtain a projected GMM distribution,w ith a high likelihood for improved recognition.
In related literature,the GMM is adopted for clustering gene expression microarray data[8].In other fields,such as networks,Singh et al.[9]used the GMM for statistical modeling of the loads in distribution networks.The expectation maxim ization(EM)algorithm is used to obtain the GMM parameter.In intelligentmanufacturing,Chen et al.[10]used the GMM for estimating the probability density function inmultivariate statisticalmonitoring of batch manufacturing processes,where principal component analysis was not applicable.In computer vision,Jian et al.[11]used the GMM for point set representation in a registration framework,which led to a reformulation of the registration problem as aligning two Gaussian m ixtures.In event detection,Kam ishima et al.[12]used the GMM to model the relationship between low-level features and visual events when the training data was insufficient.
1 Im proved Gaussian M ixture M odel
1.1 Feature reduction approaches for GMM
Feature reduction is an important step for GMM-based modelling.Them ixture number,feature dimensions,and training size need to be set carefully.When training w ith a small sample size,the m ixture number should not be too large and feature dimensions need to be reduced.If them ixture number is too large,the GMM models may be over-fitted for the training data.
The traditional feature reduction methods are used before the training stage.In this paper,we propose a feature reduction method after the training stage.We evaluate the features by GMM likelihoods at the recognition stage and reduce the worst few features.Therefore,the features used in training are fixed,and the features used in recognition are dynam ically adjusted according to the individual testing sample.We then take the marginal probability distribution of the GMM as the projection of the original model and propose a cascaded structure for classifier fusion and recognition.
1.2 Sim p le projection of Gaussian m ixturem odel
For the t-th sample in recognition,the entire selected features before the training stage can be represented as Xt={x1,x2,…,xD}.Ranking the distance between the feature point of current sample and the mean value of the closet Gaussian mixture in each dimension,we have
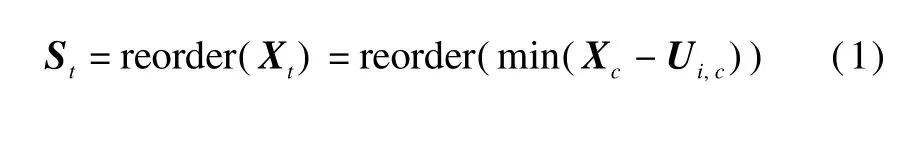
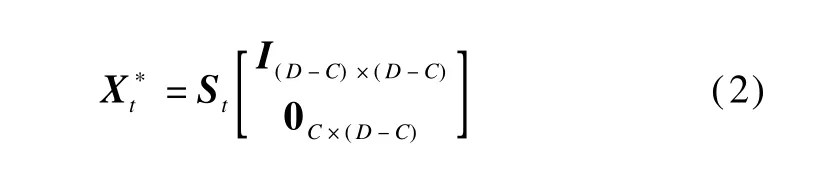
where c denotes the feature index;i denotes the Gaussian m ixture in all the emotionmodels;Strepresents the same features of the current sample w ith reordered feature dimensions.At the recognition stage,assume that D-C features are valid for all testing samples,while only C features for the current sample should be reduced.Om itting the last C features in the ranked feature vector,we have a reduced dimension space,
Sincewew ill propose amore sophisticated algorithm in the CPGMM with the ability of exploring and selecting feature dimensions in a maximum likelihood(ML)fashion,the parameter C in the PGMM is set to be 1 for the sake of simplicity.
By projecting the GMM parametersλto the reduced dimensions,the GMM parameters can be reduced in the same way.

The GMM posterior probability is calculated as

1.3 Cascaded projection of Gaussian m ixturem odel
The simple projection of the GMM provides us w ith a basic feature reductionmethod at the recognition stage.In this section,we further explore a cascaded structure of multiple sub-classifiers.Each sub-classifier is a projection of the original GMM w ith reduced dimensions.
If we remove one dimension from the original GMM,we may obtain the one-dimensional projected GMM,which is a marginal probability distribution.The likelihood of the current testing sample in the one-dimensional projected GMM is determined by the dimension we removed.We then search for the maximum likelihood among all the marginal probability distributions.If the achieved likelihood is greater than that of the original GMM,we can improve the classification performance.In an iterative fashion,we go to the next level of the projected GMM by removing more dimensions.
The marginal probability distribution function of a Gaussian distribution is still a Gaussian distribution w ith a corresponding mean vector and covariance matrix.Sup-pose that X follows a Gaussian distribution:
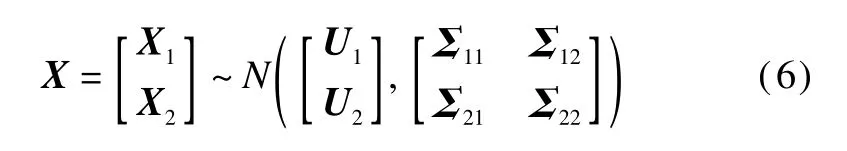
where the feature vector X can be represented in two parts,X1and X2.Either X1or X2consists of an arbitrary number of dimensions.When we remove X2from the feature vector X,X1still followsmulti-variant Gaussian distribution:

We can easily extend this property to the GMM and calculate the projection of the GMM w ith very little computational burden.
A cascaded framework is proposed to fuse the sub-classifiers and maxim ize the likelihood in an iterative fashion.The core idea of our proposed algorithm is as follows.First,for each of the testing sample,we use a threshold to validate whether the current GMM likelihood is satisfactory;if not,go to the next level of the projected GMM by removing one more dimension.Secondly,we find the maximum likelihood of the projected GMM s by exploring all the possible combinations of the feature dimensions.Thirdly,if themaximum n-dimensional projected GMM has a greater likelihood than the currentone,we replace the currentGMM model,otherw isewe use the current GMM.
The threshold in our proposed algorithm needs to be set empirically.An intuition to guide our exploration of this parameter is that:If the GMM classifier is well-trained,we do not need to calculate deeper levels of the cascaded structure.
Therefore,we have two ways to decide whether the decision should bemade using the current likelihood or the next level of the projected GMM likelihood:
1)A simple solution that uses the same threshold for all cascaded levels;
2)A threshold that depends on the GMM likelihoods of the current testing sample.
We find that the later one has an obvious advantage:the threshold ismore stable.If we use the same threshold for all cascaded levels,we need to adjust the threshold each timewhen we try to fitour algorithm to a new application.Using the follow ing empirical equation,which takes the GMM likelihoods of each class into consideration,we can achieve amore stable threshold:
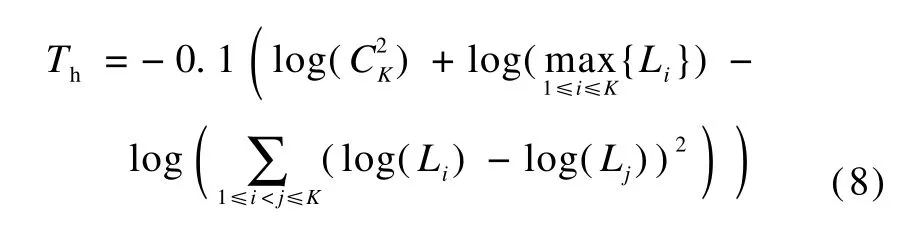
where K is the total number of emotion classes;i,j are the indices of emotion classes;Liis the normalized likelihood.

where b is the Gaussian distribution;m is the index of Gaussian m ixtures;M is the totalm ixture number;amis theweightof each Gaussianmixture;Umis themean vector of the corresponding Gaussian distribution.In our experiment,when the threshold Th>1,go to the next level of the cascaded structure of the GMM projection.
The pseudo code of the proposed algorithm is shown as follows.
Algorithm 1 Classification algorithm based on cascaded projection of the Gaussian m ixturemodel
Input:Speaker emotional feature vector X;Gaussian m ixturemodelλk(k=1,2,…,K)denoting the emotion class.
Output:Emotion class label ek.
Calculate the likelihood using the complete GMM:Lk
If Th<=1,Then end program and output ek=arg maxk{Lk}.
For d=D to 1,D is the total dimension of the feature space,do
Remove the i-th dimension and project the Gaussian m ixturemodel on the rest of the dimensions:={am,,where m is the index of Gaussian m ixtures;
Find the corresponding projected GMM w ith themaximum likelihood:

where i*denotes the selected model w ith the maximum likelihood and Xiis the feature vectorw ith the i-th dimension reduced;
Update the selected modelλ*k=λi*k,
Update the feature vector X=Xi;
If Th<=1 or Li*>L*(where L*is the likelihood before projection),
Then break,
Else update themaximum likelihood L*=Li*;
End for.
Use the selected model(λ*k)for classification:ek=arg maxk{p(X|λ*k)}.
2 Application in ECG Emotion Recognition
2.1 Database
Data collection is a key step for building an emotion recognition system.Many of current emotion recognition algorithms depend on the quality of datasets.We adopt several simulationmethods for inducing the negative emotions,including noise stimulation,math calculation and comedy video watching.The hardware devices are connected to a PC using w ireless ZigBee protocol.GUIinterface is implemented using Labview.ECG signals can becollected remotely in a laboratory environment.Detailed information can be found in Ref.[13].
Under noise stimulation,the subject is required to work on a set of math calculations.The negative emotion(fidgetiness)is then induced.The positive emotion(happiness)may be induced by watching comedy movie clips.Subjects participated in out experiment include five male volunteers and five female volunteers.The ages of the subjects range from twenty years old to forty years old,and all of the volunteers were not on medication recently.
We choose fidgetiness and happiness as our target emotions,because they cover both aspects of the valence dimension and they are of great practical value in realworld applications.A fter the induction experiment,each subject is given a self-evaluation chart to report their perceived emotional states.The intensity of the target emotion is scaled into five levels(1,3,5,7 and 9).The ECG emotion data w ith self-evaluation level equal to and higher than 5 is accepted.
2.2 ECG feature analysis
We record the typical examples of the ECG signals under three different emotional states.Based only on the time-domain waveform,it is difficult to find the differences among the three emotional states.Therefore,we need to extract and construct various statistic features for quantitative emotional analysis.
Heart rate is the number of heartbeats per unit of time,and it is a basic feature of the ECG signal.RR interval refers to R wave to R wave interval.It represents the temporal heart rate and can be used for HRV(heart rate variability)analysis.
HRV feature is extracted by the frequency domain analysismethod.Based on the RR signal,the power spectral density(PSD)is calculated using the auto-regressive model(AR).The resulting PSD provides the basic information of energy change(Y axis of power density)along w ith the frequency change(X axis of frequency).It is then divided into low frequency domain(0.01 to 0.15 Hz)and high frequency domain(0.15 to 0.4 Hz).Low frequency and high frequency features are calculated based on the power percentage.It can be calculated as
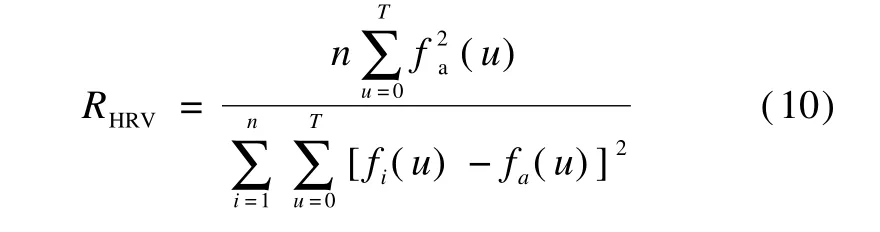
where RHRVis the heart rate variability;T is the period of the harmonic wave;u is the time index;n is the number of the periods;fi(u)is thewavew ithin one period;fa(u)is the harmonic component.
We further extract the chaotic features under various emotional states,which are shown in Tab.1.As shown in Fig.1,we construct the two-dimensional phase spaces of ECG signals corresponding to fidgetiness,happiness and neutrality.In the two-dimensional phase spaces of ECG signals,we can observe the chaotic character of ECG signals under three emotional states.We adopt the G-P(Grassberger and Procaccia)algorithm[14]for the calculation of the relevant dimension,in which the embedded dimension m is set to be 3 to 9,as shown in Fig.2.

Tab.1 Chaotic ECG features
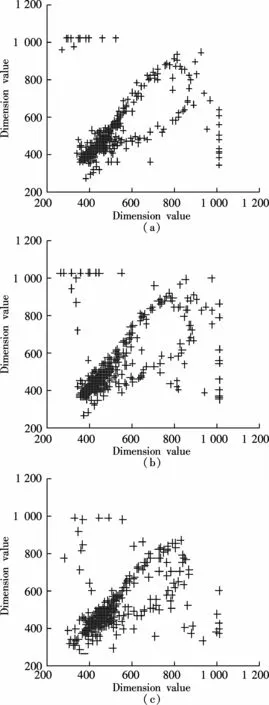
Fig.1 Depiction of phase space under various emotional states and white Gaussian noise.(a)Fidgetiness;(b)Happiness;(c)Neutrality

Fig.2 Depiction of calculating relevant dimensions using the G-P algorithm under various emotional states.(a)Fidgetiness;(b)Happiness;(c)Neutrality
Themaximal information coefficient(M IC)is ameasure of the strength of the linear or non-linear association between two variables x and y.In this paper,we apply M IC to both ECG and speech features.
M IC is based on the idea that if a relationship existsbetween two variables,a grid can be drawn on the scatterplot of the two variables that partitions the data to encapsulate that relationship[15].We can calculate the M IC of the acoustic feature and the emotional state by exploring all possible grids on the two variables.We compute every pair of integers(x,y),and the largest possiblemutual information is achieved by any x-by-y grid.Secondly,for a fair comparison,we normalize these M IC values between all acoustic features and the emotional state.A detailed study of M IC can be found in Ref.[15].Since M IC can treat linear and non-linear associations at the same time,we do not need to make any assumption on the distribution of the original features.Therefore,it is especially suitable for evaluating a large number of emotional features.We apply M IC tomeasure the contribution of these features in correlation w ith emotional states.Finally,a subset of ECG features is selected for our emotion classifier,as shown in Tab.2.
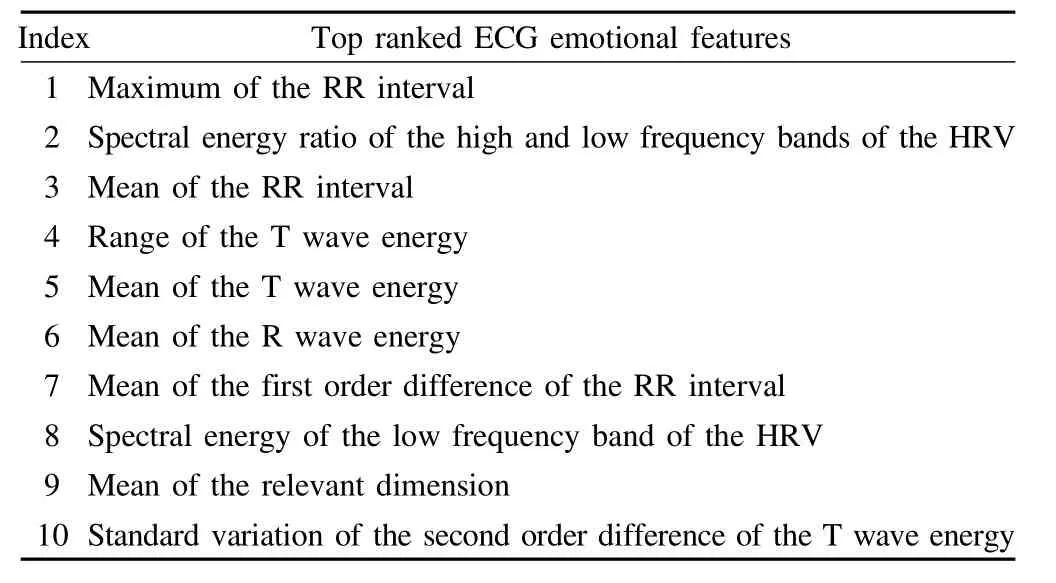
Tab.2 Selected ECG emotional features using M IC_
3 Application in Speech Emotion Recognition
3.1 Database
Besides the ECG data,we also collected emotional speech data.Fifty-one university students(the voluntary subjects)participated in the recording of the emotional speech.Their ages were between twenty and thirty-five years old.The subjects are all native Chinese speakers.The language used in the recording is Mandarin Chinese.A large number of speakers is necessary,since we aim to build a speaker-independent emotion recognition system for future call-center applications.Target emotions include happiness,neutral,sadness and fidgetiness.
We induced the target emotions in a controlled lab environment.Neutral speech was the first to be recorded,before any eliciting experiments.We induced fidgetiness by noise stimulation and repetitive boring tasks,such as math calculations.We induced sadness by the imagination technique,in which the subjectwas required to recall a sad past experience.We also induced positive emotion(happiness)by comedy movie clips.During the emotion eliciting experiments,the subject stayed in a private room and he/she was given enough time to rest between the two eliciting experiments.
3.2 Speech feature analysis
In our approach,basic speech features are extracted,including pitch,short-time energy,formant,MFCC(Mel frequency cepstrum coefficient),etc.The static features over the entire utterance are then constructed by calculating themean,themaximum,them inimum,and the variance of the basic features aswell as the first-order and the second-order of the basic features.
At the feature selection stage,various feature dimension reduction algorithms are evaluated in combination w ith a GMM-based classifier.In the speaker-independenttest,we compared the follow ing feature selection methods:principal component analysis(PCA),sequential forward selection(SFS),Fisher discrim inant ratio(FDR)and maximal information coefficient(M IC).The average recognition rates are shown in Tab.3.The optim ized feature set(ten dimensions)achieved by SFS is shown in Tab.4.

Tab.3 Recognition accuracy using various feature selection methods
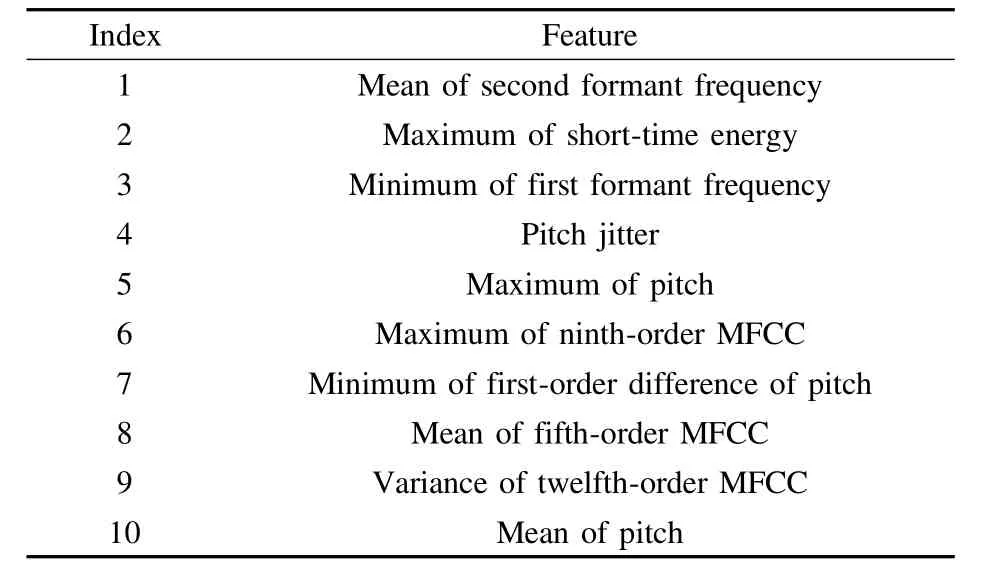
Tab.4 Optim ized feature set using SFS_
Aswe can see from Tab.3,SFS brings the highest recognition rate,where the GMM mixture number is set to be 32.However,SFS depends on the specific classifier used for classification.Principal component analysis is another popular method in feature reduction,and it cannot guarantee the discrimination ability of the optimized feature set.Among a large amount of the original acoustic features,many may be correlated to the phonetic information.Therefore,the w rappermethods,such as SFS,may outperform the filtermethods,i.e.PCA,FDR,M IC.
4 Experimental Results
In the ECG experiment,the mixture number of the GMM is set to be 6.There are 300 ECG data segments for each emotion class in the training dataset.In the test dataset,there are100 samples for each emotion class.The recognition results using the GMM,the PGMM and CPGMM are shown in Tab.5 to Tab.7,respectively.By using the proposed PGMM and CPGMM,the average recognition rates are improved by 2%and 4.3%,respectively.Notice that the recognition rates are constantly improved among all three types of emotional states.

Tab.5 ECG emotion recognition accuracy w ith GMM
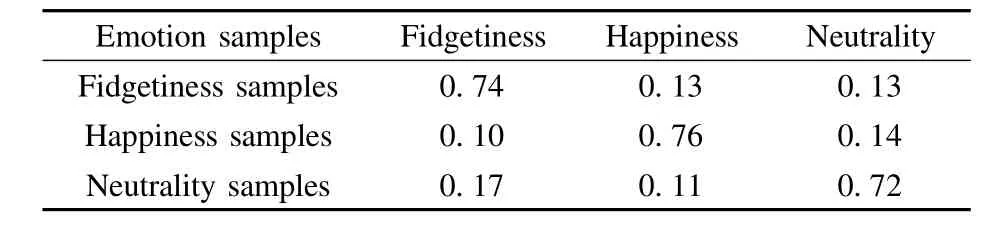
Tab.6 ECG emotion recognition accuracy w ith a simple _projection of GMM
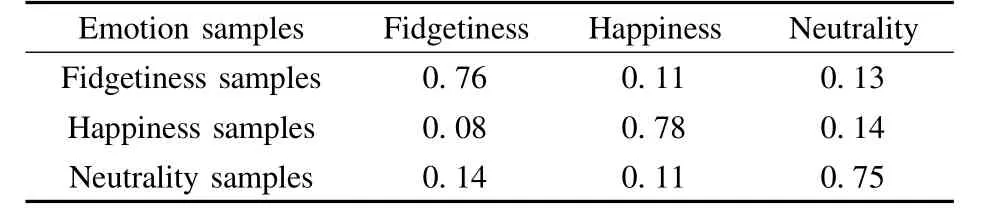
Tab.7 ECG emotion recognition accuracy w ith a cascaded projection of GMM
For the speech emotion recognition test,training and testing data sets are organized into cohorts suitable for the leave-one-out testing method.A set of high quality samples(5 699 utterances)including fifty-one speaker’s are used in the speaker-independent speech emotion recognition experiment.One of speakers’data is selected for testing and the remaining speakers’data is used for training.As shown in Tab.8,the overall speaker-independent recognition rate is improved using the PGMM and CPGMM.

Tab.8 Speaker-independent speech emotion recognition results
Compared with the basic GMM,the recognition performance is improved constantly using the simple PGMM and CPGMM,as shown in Tab.6 and Tab.7.The designed algorithms are adapted to testing samples and bring an improved classification.Different emotion types are modelled,and various subjects are involved in these tests,showing that our algorithms do not rely on emotion types nor on subject numbers.
5 Conclusion
In this paper,we discuss the emotional feature adaptation in the GMM algorithm.In the traditional training and testing framework,feature selection is carried out before themodelling stage,which poses the question of subject dependency.Various individualsmay have their own habits of emotion expression,and selecting features adaptively may be beneficial in realworld application.Therefore,we propose the simple projection of the GMM and the cascaded projection of the model to improve the adaptation ability of the recognition system.
[1]Schuller B,Rigoll G,Lang M.Hidden Markov modelbased speech emotion recognition[C]//IEEE International Conference on Acoustics,Speech,and Signal Process-ing.Hong Kong,China,2003,2:401- 404.
[2]Kim J,AndréE.Emotion recognition based on physiological changes inmusic listening[J].IEEE Transactions on Pattern Analysis and Machine Intelligence,2008,30(12):2067- 2083.
[3]Khan R A,Meyer A,Konik H,et al.Framework for reliable,real-time facial expression recognition for low resolution images[J].Pattern Recognition Letters,2013,34(10):1159- 1168.
[4]Steidl S.Automatic classification of emotion-related user states in spontaneous children’s speech[D].Erlangen-Nuremberg,Germany:FAU Erlangen-Nuremberg,2009.
[5]Kockmann M,Burget L,CˇernockýJ H.Application of speaker and language identification state-of-the-art techniques for emotion recognition[J].Speech Communication,2011,53(9/10):1172- 1185.
[6]Pantelopoulos A,Bourbakis N G.A survey on wearable sensor-based systems for health monitoring and prognosis[J].IEEE Transactions on Systems,Man,and Cybernetics,Part C:Applications and Reviews,2010,40(1):1- 12.
[7]Gunes H,Pantic M.Automatic,dimensional and continuous emotion recognition[J].International Journal of Synthetic Emotions,2010,1(1):68- 99.
[8]M cNicholas P D,Murphy T B.Model-based clustering of microarray expression data via latent Gaussian m ixture models[J].Bioinformatics,2010,26(21):2705- 2712.
[9]Singh R,Pal B C,Jabr R A.Statistical representation of distribution system loads using Gaussian m ixture model[J].IEEE Transactions on Power Systems,2010,25(1):29- 37.
[10]Chen T,Zhang J.On-line multivariate statistical monitoring of batch processes using Gaussian m ixturemodel[J].Computers&Chemical Engineering,2010,34(4):500- 507.
[11]Jian B,Vemuri B C.Robust point set registration using Gaussian m ixturemodels[J].IEEE Transactions on Pattern Analysis and Machine Intelligence,2011,33(8):1633- 1645.
[12]Kamishima Y,Inoue N,Shinoda K.Event detection in consumer videos using GMM supervectors and SVMs[J].EURASIP Journal on Image and Video Processing,2013,2013:51- 59.
[13]Yu H,Huang C W,Zhao L,et al.Research of emotional electrophysiological parameters collection system and child-emotion monitoring[J].Chinese Journal of Electronic Devices,2010,33(4):516-520.(in Chinese)
[14]Grassberger P,Procaccia I.Measuring the strangeness of strange attractors[J].Physica D,1983,9(1/2):189- 208.
[15]Reshef D N,Reshef Y A,Finucane H K,et al.Detecting novel associations in large data sets[J].Science,2011,334(6062):1518- 1524.
基于级联投影高斯混合模型的语音与心电情绪识别
黄程韦1吴 迪1张晓俊1肖仲喆1许宜申1季晶晶1陶 智1赵 力2
(1苏州大学物理与光电·能源学部,苏州215006)
(2东南大学信息科学与工程学院,南京210096)
提出了一种基于级联投影的高斯混合模型算法.首先,针对不同的特征维度计算高斯混合模型的边缘概率,依据边缘概率模型构造出多个子分类器,每个子分类器包含不同的特征组合.采用级联结构的框架对子分类器进行动态融合,从而获得对样本的自适应能力.其次,在心电情感信号和语音情感信号上验证了算法的有效性,通过实验诱发手段,采集了烦躁、喜悦、悲伤等情感数据.最后,探讨了情感特征参数(心率变异性、心电混沌特征,语句级静态特征等)的提取方法.研究了情感特征的降维方法,包括主分量分析、顺序特征选择、Fisher区分度和最大信息系数等方法.实验结果显示,所提算法能够在2种不同的场景中有效地提高情感识别的准确率.
高斯混合模型;情绪识别;样本自适应;情绪诱发
TN912.3
10.3969/j.issn.1003-7985.2015.03.004
2015-02-03.
Biographies:Huang Chengwei(1984—),male,doctor,associate professor,cwhuang@suda.edu.cn.
s:The National Natural Science Foundation of China(No.61231002,61273266,51075068,61271359),Doctoral Fund of M inistry of Education of China(No.20110092130004).
:Huang Chengwei,Wu Di,Zhang Xiaojun,et al.Cascaded projection of Gaussian mixturemodel for emotion recognition in speech and ECG signals[J].Journal of Southeast University(English Edition),2015,31(3):320- 326.
10.3969/j.issn.1003-7985.2015.03.004
猜你喜欢
昆明医科大学学报(2021年4期)2021-07-23
电子制作(2019年19期)2019-11-23
小天使·二年级语数英综合(2019年4期)2019-10-06
小学生学习指导(低年级)(2019年6期)2019-07-22
中国生物医学工程学报(2019年6期)2019-07-16
心电与循环(2019年2期)2019-02-19
电子制作(2016年15期)2017-01-15
系统工程与电子技术(2016年2期)2016-04-16
四川师范大学学报(自然科学版)(2015年2期)2015-02-28
电测与仪表(2014年1期)2014-04-04
 Journal of Southeast University(English Edition)2015年3期
- Journal of Southeast University(English Edition)的其它文章
- CoMP-transm ission-based energy-efficient scheme selection algorithm for LTE-A system s
- Detection optim ization for resonance region radar w ith densemulti-carrier waveform
- Dimensional emotion recognition in whispered speech signal based on cognitive performance evaluation
- Action recognition using a hierarchy of feature groups
- Ergodic capacity analysis for device-to-device communication underlaying cellular networks
- Intrusion detection model based on deep belief nets