
Evaluation on ldeal Test Sites and Regional Characteristics of Cotton Fiber Quality in Jiangsu Province
2015-11-07 01:34JianLlNaiyinXU
Agricultural Science & Technology 2015年10期
Jian Ll,Naiyin XU
Institute of Industrial Crop,Jiangsu Academy of Agricultural Sciences/Key Laboratory of Cotton and Rapeseed,Ministry of Agri-culture,Nanjing 210014,China
Evaluation on ldeal Test Sites and Regional Characteristics of Cotton Fiber Quality in Jiangsu Province
Jian Ll*,Naiyin XU
Institute of Industrial Crop,Jiangsu Academy of Agricultural Sciences/Key Laboratory of Cotton and Rapeseed,Ministry of Agri-culture,Nanjing 210014,China
[Objective]The aim of this study was to explore the dominant fiber quality traits of test sites in cotton regional trials,by analyzing the regional characteristics of cotton fiber quality in Jiangsu province,in order to provide the theory background for cotton fiber quality improvement. [Method]The dominant fiber quality traits of test locations were analyzed with eight main fiber quality indexes of hybrid cotton regional trials during 2009-2013 in Jiangsu province by use of the"ideal test site" view of GGE biplot. [Result]The test locations with the best integrative fiber quality were proved to be Yanliang,and followed by Dongxin and Guanyun;The better test locations in terms of the major fiber quality indexes,including fiber strength,fiber Length and micronaire value,were Guanyun,Xinyang and Yanliang;To sum up,the best test location with balanced fiber quality was Yanliang.The test locations with specialties in fiber quality index were listed as bellow:Dafeng,Xinghua and Dongtai performance better in fiber length;Qidong,Liuhe and Yanhai locations were of bet-ter fiber length uniformity;Sheyang and Dongxin were better in micronaire value;while Sheyang along was better in fiber elongation and reflectance.Moreover,the correlation between fiber yellowness and other traits was significant(P<0.01).[Conclusion]The regional characteristic of cotton fiber quality index in Jiangsu province was obvious and fiber yellowness was worthy an indicator trait to assist the compre-hensive improvement of cotton fiber quality.
Cotton(Gossypium hirsutum L.);GGE biplot;Fiber quality;Jiangsu Province;Regional test
T he growth of cotton fiber is sub-jected to the influences of the inheritance,environment and cultivation,among which the effects of environmental factors on the fiber fea tures are larger than other species factors[1].Cotton can only grow in a cer-tain specific environment, which means that the appropriate environ-ment can enhance the yield and im-prove the fiber quality[2].The cotton area in Jiangsu has been considered as one of the main cotton production area in Yangtze River.Indicators such as the fiber length,intensity,and the fiber evenness of cotton in Jiangsu are higher than that of the cottons planted in Yellow River and northwest China[3]. However,cotton distributes widely across Jiangsu,and different fiber quality in different ecological areas carry different features[4-7].Meanwhile,the demand of modern fiber technolo-gy on the cotton quality gets higher,and it is necessary to analyze the growth of fiber in different ecological areas under the interaction of gene and environment,in order to enhance the potential of fiber quality.
Cotton fiber quality is a complicate indicator,while the genotype plus gentotype by environment interaction biplot can visually reflect the interac-tion of test environment and a single property,and the spatial relationship of many features and its cooperation mode[8].At present,GGE has been widely applied to the division of eco- logical areas[9-11].There are few reports regarding the relationship between cot-ton fiber qualities and the ecological environment[5].The aim of this essay is to discuss the importance of cotton fiber based on the relationship be-tween cotton fiber features and each experiment area,which provide theo-retical references to improve cotton fiber quality.
Materials and Methods
Experiment design
There were 12 test locations in cotton regional trials in Jiangsu from 2009 to 2013 (Table 1).Each test lo-cation was arranged randomly and re-peated three times.The small area was around 20 m2.The strain and line distance was reasonable,and the was no more than 15%.
Detection of fiber quality
The deadline for collecting green bolls was on November 20.We se-lected 50 cotton boll from the central part of the cotton branch in each re-gion.The cotton was considered as the samples for detecting fiber quality. We used the HVI1000 fiber detector produced by UETER for monitoring. HVICC cotton calibration apparatus was applied for 48 hours of pre-treat-ment at a constant temperature of(20±2)℃ and the stable humidity at(65±3)%.Each sample was tested for four times and then we obtained the average value.The test of the quality of cotton fiber included the fiber length,fiber strength,micronaire value,elon-gation,reflectance,yellowness,unifor-mity index and spinning consistency index.

Table 1 The fertilizer and management of test locations in cotton regional trials in Jiangsu province in 2009-2013
Statistics analysis method
Based on the “ideal test site”view of GGE biplot,this paper evaluat-ed the ideal test sites under each phe-nomenon based on Yan and Holland's approach[12].The dominant fiber quality traits of test locations were analyzed with eight main fiber quality indexes of hybrid cotton regional trials during 2009-2013 in Jiangsu province by use of the“ideal test site”view of GGE bi-plot[13-14].In the GGE biplot,the angle between each fiber quality vector rep-resented the relevance between each phenomenon.The smaller the angle,the stronger the relevance[13-14].

Table 2 The correlation coefficient matrix among cotton fiber indexes in cotton regional trials in Jiangsu Province in 2009-2013
Results and Analyses
The relevance of cotton fiber quality
As is shown in Fig.1,t the fiber length showed positive proportion to the spinning consistency index,unifor-mity index and fiber strength,but neg-ative proportion to the micronaire val-ue.The fiber strength showed positive relevance to the micronaire value.
As we can see from Table 2,the fiber length showed extremely signifi- cant positive proportion to the unifor-mity ratio,yellowness,spinning consis-tency index,and specific strength,and negative proportion to micronaire val-ue.The uniformity ratio,spinning con-sistency index and specific strength showed significant positive relevance,and the uniformity ratio and yellow-ness showed negative relevance.The micronaire value indicated extremely negative relevance to the elongation ratio and spinning consistency index. The elongation ratio showed signifi-cantly negative relevance to the specif-ic intensity.The reflection ratio showed negative relevance to the yellowness. The yellowness was of negative rele-vance showed significant negative pro-portion to the spinning consistency in-dex and specific intensity.The specific intensity was of positive proportion to the spinning consistency index.
Selection of ideal test locations
The ideal test locations in GGE biplots were above the average en-vironment axis,and its vector length equaled to the identification of the longest test location vectors and the mostrepresentative axis locations. The smaller the value,the better the comprehensive performance[15].
According to the ideal test loca-tions of the fiber length indicators in the GGE biplots(Fig.2a),the most ide-al test location was in Guanyun,Xinyang and Xinghua,and the relative-ly ideal one was in Liuhe,Yancheng,Yanliang,Guanyun,Dongtai,and Sheyang,etc.Based on the ideal test locations of the evenness(Fig.2b),the most ideal test location was in Qidong and Xinyang.As is suggested on the ideal function of the micronaire value(Fig.2c),the pretty ideal test location included Sheyang,Dongxin,Xinyang,Yanliang, Taicang,Guanyun and Dafeng.In terms of the ideal test loca-tion of the fiber ratio intensity(Fig.2d),the ideal test location was in Guanyun,and the relatively ideal test location was Dongtai, Dafeng, Xinghua,Xinyang,Yanliang,Dongxin,Taicang and Qidong.With regard to the ideal test location of spinning evenness in-dex(Fig.2e),the most ideal test loca-tion was in Dongxin,and the pretty ideal place was in Guanyun,Liuhe,Yanniang, Dongtai, Qidong and Yancheng.As for the ideal test loca-tion of reflection rate(Fig.2f),the most idealplace was in Taicang and Sheyang,while the pretty ideal station was in Dongtai,Dongxin,Xinghua,Qi-dong,Liuhe,Guanyun and Yanliang. Considering the ideal test station of fiber length (Fig.2g),the more ideal test location was in Yancheng,Sheyang,Taicang,Dafeng,Xinyang,Yanniang,Dongtai and Dongxin,ac-cordingly.Regarding to the ideal test location of yellowness indicators(Fig.2h),the most ideal test location was in Liuhe,and the pretty ideal test location was Dongxin, Guanyun,Taicang,Qidong,Yanliang and Dong-tai,etc.
Ideal index of test stations
As we can see from the ordering of ideal distance parameters,the ad-vantageous fiber quality in each test station was as follows:the pretty ideal fiber quality indicator in Dafeng and Dongtai was the fiber strength;the one in Dongxin was the micronaire,spin-ning consistency index,reflection rate and yellowness;the one in Guanyun was length,fiber intensity,and yellow-ness;the one in Liuhe was uniformity index and yellowness;the one in Qi-dong was uniformity index and spin-ning consistency index;the one in Sheyang was the micronaire value,re-flection ratio and elongation;the one in Xinyang was fiber length and uniformi-ty index;the one in Xinghua was fiber length;the one in Yancheng was spin-ning consistency index and elongation rate;and the one in Yanliang was mi-cronaire value.
Discussions
Cotton fiber quality is a com-plicated comprehensive performance,which not only is subjected to the in-heritance factors,but also is influ-enced by ecological factors such as climate and soil,etc[4,16].Cottons are planted in both south and north Jiang-su where the ecological condition in different cotton areas vary greatly,so the choice of fiber quality in Jiangsu is representative.As Zhu Shaolin point-ed out,compared to the fiber length,the fiber is more easily to be subjected to the influences of environment[1].This study also illustrated that fiber length showed positive proportion to the fiber intensity,which was consistent with previous study results[5].This study re-vealed that the fiber quality in Guanyun,Dongtai and Dafeng ranked in the first three places.The meteoro-logical condition in Dongtai and Dafeng was similar,and the fiber strength was high.The nitrogen level in Guanyun(pure nitrogen 230 kg/hm2)was suitable for the formation of fiber strength[17].Besides,the fiber length in Guanyun was optimal,whose results showed positive relevance to fiber in-tensity.The yellowness in Guanyun ranked in the first position,which sug-gested that although the fiber length and strength in Guanyun were optimal,the comprehensive indicators of cotton fiber quality were not the most optimal.
Spinning consistency index is a multiple regression formula,which re-flected the spinning consistency of fiber and estimated spinning intensity. The involved fiber quality indicators in-clude fiber strength,micronaire,fiber length,uniformity value,reflectance and yellowness.The optimal fiber qual-ity in Dongxin included micronaire val-ue,spinning consistency index,re-flectance and yellowness.Although the function of fiber strength,uniformi-ty value and fiber length was not dis-tinct,the advantages of micronaire were distinct,and reflectance and yel-lowness indicators were optimal. Meanwhile,as we can see from Fig.2,micronaire showed negative relevance to fiber length,uniformity index and fiber intensity indicators,which sug-gested that the fiber maturity and fine-ness in Dongxin was optimal.The fiber uniformity in Qidong was high,and the cotton fiber was consistent. This was optimal to the reduction of cost,and was consistent with previous studies[18].The spinning consistency index showed that the fiber spinning and intensity was strong.The spinning consistency index in Yancheng was high,which was similar to that in Qi-dong.Meanwhile,its elongation rate was optimal.The relationship between the elongation rate and spinning con-sistency index was insignificant.In Xinyang,the fiber length and uniformi-ty index were better,but the spinning consistency index was not in the first place,which indicated that its other performance was relatively weak.Be-sides,the yellowness showed ex-tremely outstanding negative propor-tion to the fiber length,uniformity in- dex,fiber strength,spinning consisten-cy index and reflectance.They were essential factors that affect fiber quali-ty.Therefore,it is necessary to draw cultivators'attention on yellowness,in order to enhance the comprehensive quality of fiber.
Overall,the test locations with the bestintegrative fiber quality were proved to be Yanliang,and followed by Dongxin and Guanyun;The better test locations in terms of the major fiber quality indexes, including fiber strength,fiber Length and micronaire value,were Guanyun,Xinyang and Yanliang;To sum up,the best test lo-cation with balanced fiber quality was Yanliang.The test locations with spe-cialties in fiber quality index were listed as bellow:Dafeng,Xinghua and Dongtai performance better in fiber length;Qidong,Liuhe and Yanhai lo-cations were of better fiber length uni-formity;Sheyang and Dongxin were better in micronaire value;while Xinghua was better in fiber length.
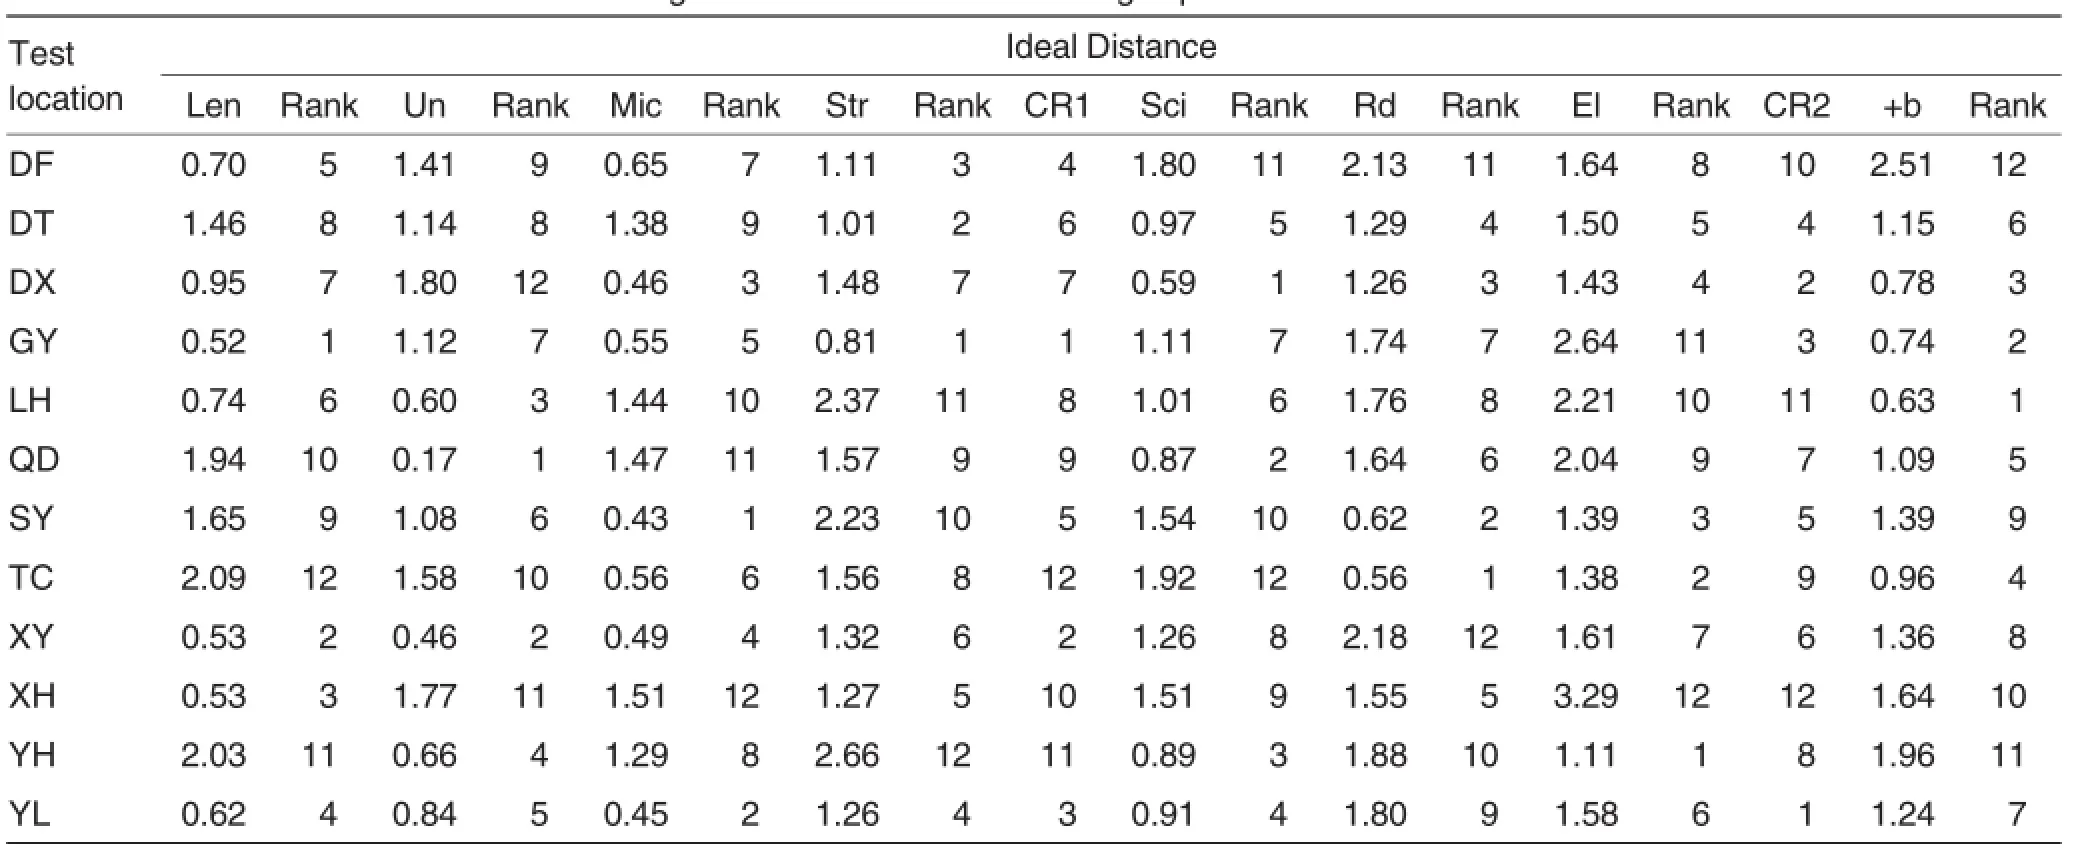
Table 3 Ideal distance s of 12 test sites for eight cotton fiber indexes in Jiangsu province in 2009-2013
[1]ZHU SL,LI DQ,HUA GX,et al.Study on relationship of cotton fiber quality and environments indifferent ecological areas in Jiangsu province.[J].Cotton science.1991,3(1):53-62.
[2]HUANG ZK,CUI DC.Ecological re-gionalization of cotton production in Chi-na[J].Cotton science.2002,14(3):185-190.
[3]XIONG ZW,GU SH,MAO LL,et al. Spatialdistribution characteristics of China cotton fiber quality and climatic factors based on GIS[J].Chinese Jour-nal of Applied Ecology.2012,23(12):3385-3392.
[4]YU LX,TANG SF,WANG SH,et al.The study on the ecological classification of the fiber quality of upland cotton in Hubei province [J].Acta Gossypii Sini-ca.1993,5(2):15-20.
[5]XU NY,LI J.Ecological regionalization of cotton fiber quality based on GGE bi-plot in Yangtze river valley[J].Acta A-gronomica Sinica.2014,40(5):891-898.
[6]CHEN RJ,SUN CF,ZHU MZ.Ecologi-cal distribution and clustering analysis of cotton fiber quality in Henan province[J].Journal of Jilin Agricultural Universi-ty.2007,29(5):478-482.
[7]XU NY,CHEN XS,DI JC,et al.Studies on the regional characteristics of cotton fiber quality in Yangtze valley[J].Cotton science.2003,15(4):221-226.
[8]YAN W,TINKER N A.Biplot analysis of multi-environment trial data:Principles and applications[J].Canadian Journal of Plant Science,2006,86(3):623-645.
[9]XU NY,ZHANG GW,LI J,et al.Evalua-tion of cotton regional trial environments based on GGE biplot and fiber length selection[J].Resources and environ-ment in Yangtze basin.2013,22(6):735-741.
[10]XU NY,ZHANG GW,LI J,et al.Inves-tigation of cotton mega-environment based on fiber strength selection and GGE biplot[J].Chinese Journal of Eco-Agriculture.2012,20(11):1500-1507.
[11]XU NY,ZHANG GW,LI J,et al.Evalu-ation of cotton regional trial environ-ments based on cotton fiber micron-aire selection by using GGE biplot analysis[J].Chinese Journal of Eco-Agriculture.2013,21(10):1241-1248.
[12]YAN W,HOLLAND J B.A heritability-adjusted GGE biplot for test environ-ment evaluation[J].Euphytica.2010,171(3):355-369.
[13]YAN W,KANG M S,MA B,et al.GGE Biplot vs.AMMI Analysis of Genotype-by-Environment Data[J].Crop Science,2007,47(2):643-655.
[14]YAN WK.Optimal use of biplots in analysis of multi-location Variety test data[J].Acta Agronomica Sinica.2010,36(11):1805-1819.
[15]YAN W.GGEbiplot—A Windows appli-cation for graphical analysis of multien-vironment trial data and other types of two-way data[J].Agronomy Journal. 2001,93(5):1111-1118.
[16]TANG SR,XIAO YN,YANG WH.The Analysis of Raw Cotton Fiber Quality between Regionand Year in China[J]. Chin Agric Sci Bull,2006,22(10):177-183
[17]FENG Y,WANG YH,MA RH,et al. Responses of carbohydrate metabo-lism to nitrogen in cotton fiber devel-opment and its relationships with fiber strength formation[J].Scientia Agri-culture Sinica.2009,42(1):93-102.
[18]DING Y,ZANG Y,CHENG GM,et al. Analysis on cotton quality in Nantong,Jiangsu[J].ChineseCotton.2012,39(3):24-26.
Responsible editor:Nana FAN
Responsible proofreader:Xiaoyan WU
Supported by Special Program to Cultivate New Species of National Genetically Modified Food(2012ZX08013016).
*Corresponding author.E-mail:lijianjzs@jaas.ac.cn
Received:August 9,2015 Accepted:September 19,2015
 Agricultural Science & Technology2015年10期
- Agricultural Science & Technology的其它文章
- Effects of Different Light Emitting Diodes on Growth and Quality of Lettuce
- Analysis on Carotenoids Content and Other Quality Traits of 185 Wheat Varieties
- In Vitro Propagation of Ardisia mamillata Hance
- lnfluences of Different Habitats on Asexual Propagation of Wild Gastrodia elata f.glauca being Domesticated in Ganzi
- Breeding and Evaluation of New lron Yam(Dioscorea opposita Thunb)Varieties
- Extraction and Structure Elucidation of Phenols from Dendrobium thyrsiflorum