
An Analysis of Operational Efficiency of Agricultural Insurance Agency: Based on Three-Stage DEA Model
2016-01-12 05:56,
Asian Agricultural Research 2016年12期
,
College of Economics and Management, Huazhong Agricultural University, Wuhan 430070, China
1 Introduction
Since 2004, due to government’s implementation of financial subsidies, the agricultural insurance has developed by leaps and bounds in various provinces and cities, and the agricultural insurance income has also constantly increased, with a rising share in property insurance. In 2015, there were more than 30 agencies engaged in agricultural insurance. However, there are many problems in the process of scale expansion and rapid development of agricultural insurance market. Firstly, few types of products are available for agricultural insurance, and the governments at all levels provide a small proportion of subsidies. At the same time, the subsidizing mode is simple, and there is no way to meet the diversified needs of agricultural development. Secondly, the agricultural insurance market is concentrated, the market structure is irrational, and the company’s management is not standardized. There are flaws in damage assessment, sale and other aspects, affecting the company’s operating efficiency. Thirdly, there is information asymmetry in agricultural insurance market, the moral hazard and adverse selection are serious, and the moral hazard happens not only to farmers, but also to many insurance companies, affecting the normal and orderly development of the whole market. With the gradual development of the agricultural insurance market, many foreign agencies see the potential of Chinese market in this field and begin to expand market in China, so the domestic market competition becomes diversified. However, there are great differences in the development model of different companies. It is very important to compare the operating efficiency of different companies so as to improve the service level of the company and promote the development of the insurance market. At present, many studies focus on the operational efficiency of insurance agency, but few of them lay emphasis on the operational efficiency of agricultural insurance agency. Therefore, it is of great significance for agricultural insurance agencies and farmers to study the operational efficiency of agricultural insurance agency, and evaluate the agricultural insurance agency in order to improve their service efficiency.
2 Sample source
In terms of the selection of decision units, taking into account the agricultural insurance proportion of various business units, agency operating data availability and agency nature need, we select 21 agricultural insurance operators as samples, to analyze the operation during 2010-2014 (Table 1). All data are fromInsuranceYearbook,StatisticalYearbook, and some statistics from official websites.
3 Empirical analysis on the efficiency of agricultural insurance agency
3.1ThefirststageefficiencyanalysisThe sample data of 21 agricultural insurance agencies in China are imported into the model, and DEAP is used to calculate three efficiency values. The specific results are shown in Table 2.
3.2ThesecondstageefficiencyanalysisIn the second stage efficiency analysis, the Tobit model is mainly used and six environmental variables are selected into the model.

Table 1 Sample companies and agricultural insurance proportionUnit: 106 yuan, %
Data source:InsuranceYearbook(2011-2015).
Table2Operationalefficiencyofagriculturalinsuranceagency(2010-2014)
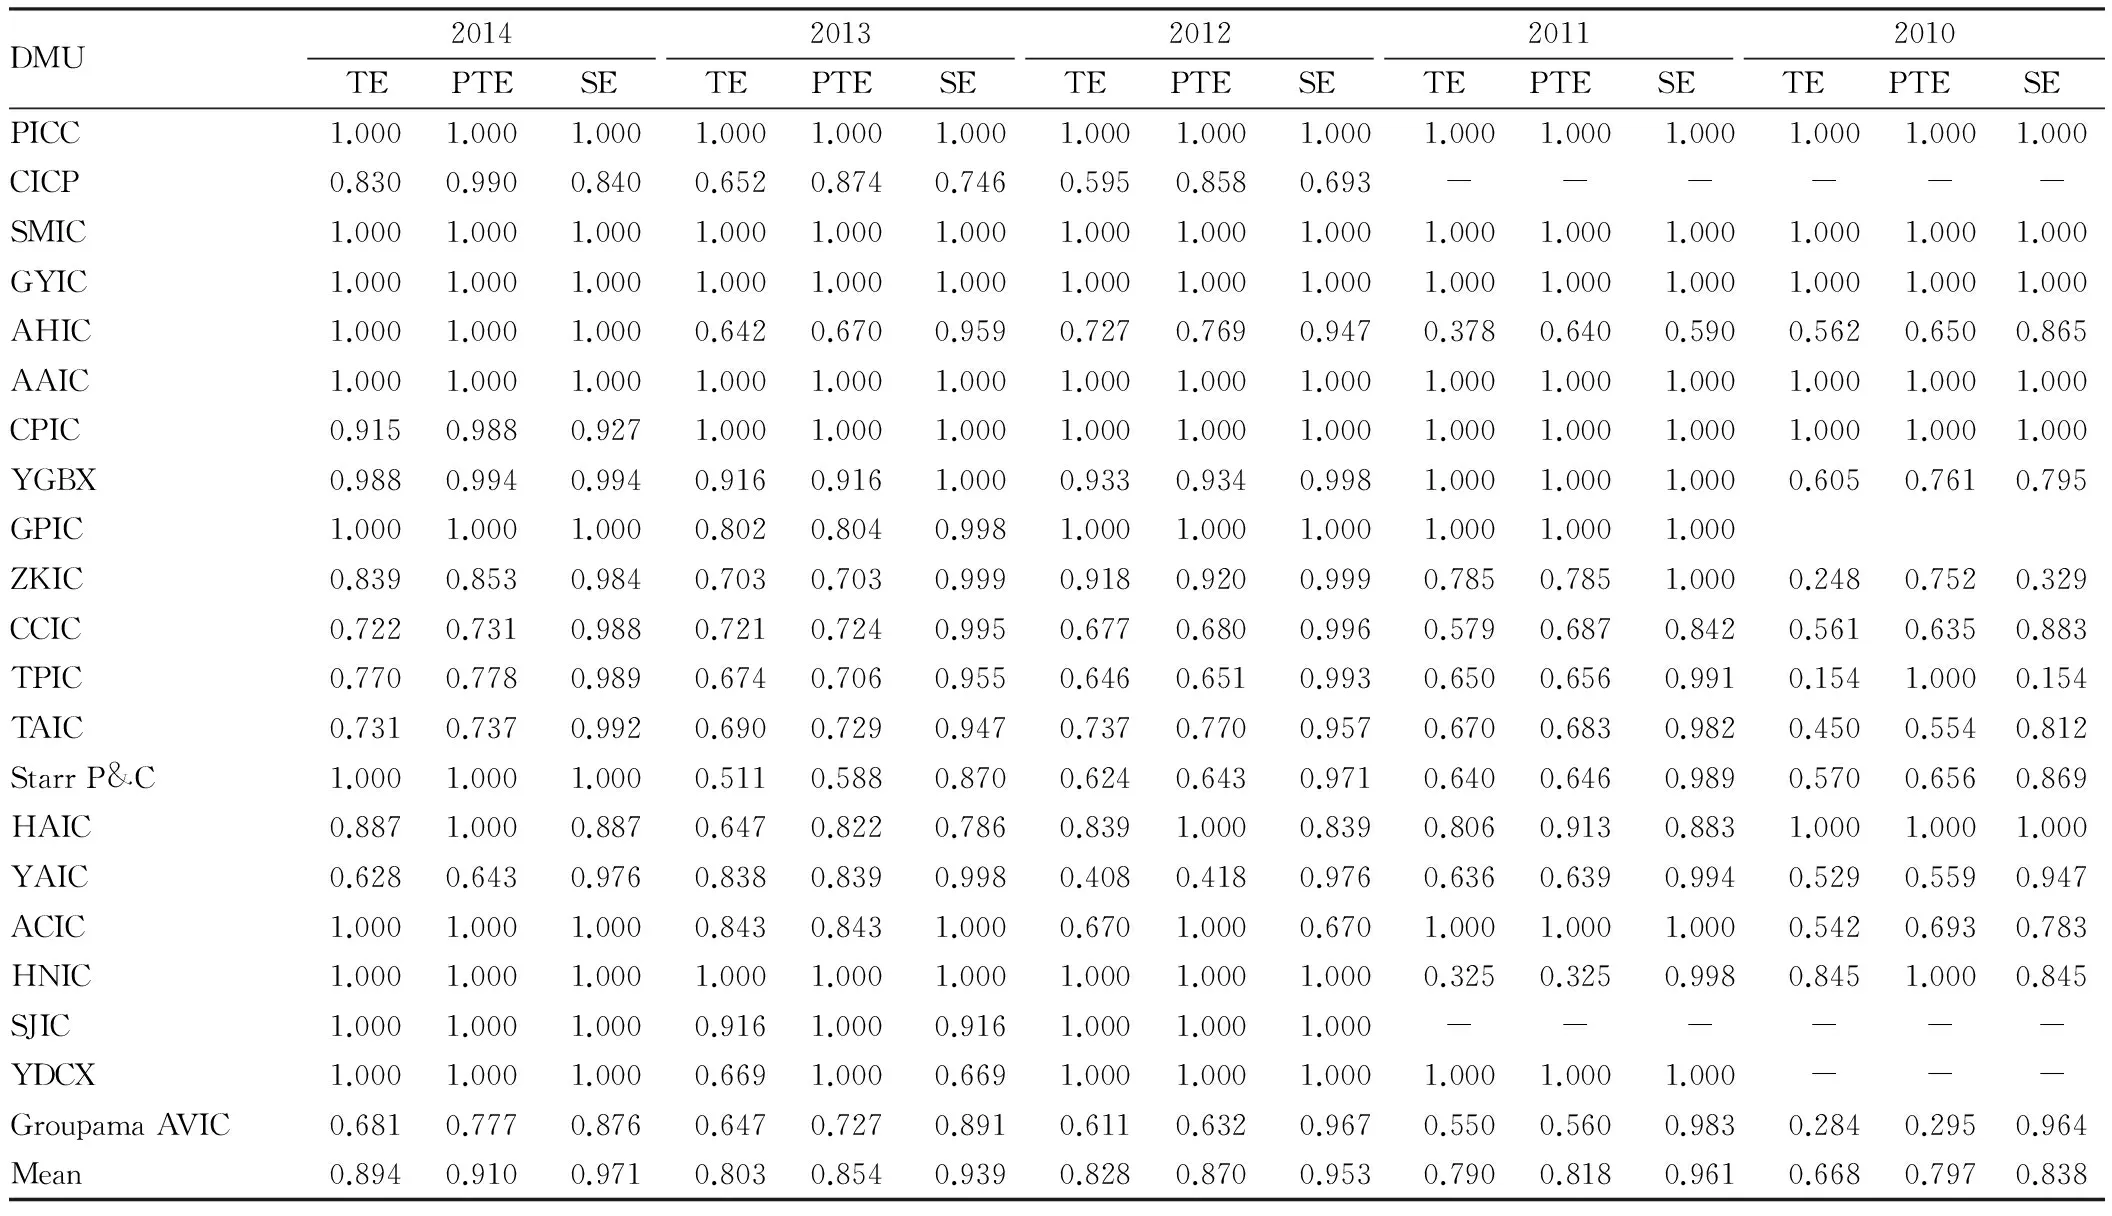
DMU2014TEPTESE2013TEPTESE2012TEPTESE2011TEPTESE2010TEPTESEPICC1.0001.0001.0001.0001.0001.0001.0001.0001.0001.0001.0001.0001.0001.0001.000CICP0.8300.9900.8400.6520.8740.7460.5950.8580.693------SMIC1.0001.0001.0001.0001.0001.0001.0001.0001.0001.0001.0001.0001.0001.0001.000GYIC1.0001.0001.0001.0001.0001.0001.0001.0001.0001.0001.0001.0001.0001.0001.000AHIC1.0001.0001.0000.6420.6700.9590.7270.7690.9470.3780.6400.5900.5620.6500.865AAIC1.0001.0001.0001.0001.0001.0001.0001.0001.0001.0001.0001.0001.0001.0001.000CPIC0.9150.9880.9271.0001.0001.0001.0001.0001.0001.0001.0001.0001.0001.0001.000YGBX0.9880.9940.9940.9160.9161.0000.9330.9340.9981.0001.0001.0000.6050.7610.795GPIC1.0001.0001.0000.8020.8040.9981.0001.0001.0001.0001.0001.000ZKIC0.8390.8530.9840.7030.7030.9990.9180.9200.9990.7850.7851.0000.2480.7520.329CCIC0.7220.7310.9880.7210.7240.9950.6770.6800.9960.5790.6870.8420.5610.6350.883TPIC0.7700.7780.9890.6740.7060.9550.6460.6510.9930.6500.6560.9910.1541.0000.154TAIC0.7310.7370.9920.6900.7290.9470.7370.7700.9570.6700.6830.9820.4500.5540.812StarrP&C1.0001.0001.0000.5110.5880.8700.6240.6430.9710.6400.6460.9890.5700.6560.869HAIC0.8871.0000.8870.6470.8220.7860.8391.0000.8390.8060.9130.8831.0001.0001.000YAIC0.6280.6430.9760.8380.8390.9980.4080.4180.9760.6360.6390.9940.5290.5590.947ACIC1.0001.0001.0000.8430.8431.0000.6701.0000.6701.0001.0001.0000.5420.6930.783HNIC1.0001.0001.0001.0001.0001.0001.0001.0001.0000.3250.3250.9980.8451.0000.845SJIC1.0001.0001.0000.9161.0000.9161.0001.0001.000------YDCX1.0001.0001.0000.6691.0000.6691.0001.0001.0001.0001.0001.000---GroupamaAVIC0.6810.7770.8760.6470.7270.8910.6110.6320.9670.5500.5600.9830.2840.2950.964Mean0.8940.9100.9710.8030.8540.9390.8280.8700.9530.7900.8180.9610.6680.7970.838
Note: SJIC and YDCX were set up not long ago, SJIC entered the area of agricultural insurance in 2012, and YDCX entered the area of agricultural insurance in 2011; the data about CICP during 2010-2011 are missing.
3.2.1Setting of environment variables. In view of the characteristics of agricultural insurance market, this paper makes the following hypotheses on the environmental variables of agricultural insurance agency:
H1Nature of agricultural insurance agency (x1) has an impact on the efficiency of agricultural insurance agency. Here, we take the form of instrumental variables to introduce the nature of agency into model, foreign-funded agricultural insurance agency is set to 1, and non-foreign-funded agricultural insurance agency is set to 0. In today’s environment, there are still many differences in national policies on foreign investment and non-foreign investment, which may have an impact on the operational efficiency of agricultural insurance agency.
H2Type of agricultural insurance agency (x2) has an impact on the efficiency of agricultural insurance agency. There are differences in various preferential operating policies for professional agricultural insurance agencies and comprehensive agricultural insurance agencies, and this paper assumes that the type of agency will have an impact on the operating efficiency of agency.
H3Operating time of agricultural insurance agency (x3) has an impact on the efficiency of agricultural insurance agency. In general, if the operating time of agricultural insurance agency is longer, the management of agricultural insurance agency will be more mature, the agricultural insurance agency will have more experience in compensation, and there may be corresponding brand effect, which will lead to the business expansion and cost reduction of agricultural insurance agency, thereby enhancing the operational efficiency of agricultural insurance agency.
H4Market share (x4) has an impact on the efficiency of agricultural insurance agency. The higher market share will enable agricultural insurance agency to occupy more agricultural insurance incomes, earn more profits and obtain higher operational efficiency, but if the market share is caused by extensive expansion, it will also reduce the operational efficiency of agency. The ratio of premium income of various agencies to total market share is used to measure this environmental factor in order to determine the relationship between them.
H5The proportion of agricultural insurance business (x5) has an impact on the efficiency of agricultural insurance agency. Now most agencies are involved in many fields for mutual business penetration and market expansion. The proportion of agricultural insurance business represents the level of investment of agency in the field of agricultural insurance, which will undoubtedly bring about a certain impact on the operational efficiency of agricultural insurance. The larger the proportion of agricultural insurance business, the higher the operational efficiency of agricultural insurance.
H6The quality of employees (x6) has an impact on the efficiency of agricultural insurance agency. The quality of employees is measured by the proportion of the employees with college degree or higher, because in the era of innovation, if the quality of employees is high, the integrated capacity will be high, and the operational efficiency of agency is proportional to.the quality of employees.
3.2.2Setting of model. In processing the impact of environmental variables on the efficiency, the regression is performed on the difference between the environmental variables (nature of agricultural insurance agency,x1; type of agricultural insurance agency,x2; operating time of agricultural insurance agency,x3; market share,x4; proportion of agricultural insurance business,x5; quality of employees,x6) and three input variables (number of employees; ownership capital; operating expenses), respectively. The following model is established:
y=β0+β1x1+β2x2+β3x3+β4x4+β5x5+β6x6+e,e~N(0,σ2)
(5)
whereyrepresents three difference values (y1,y2,y3);β0represents the intercept term;β1,β2,β3,β4,β5,β6represent the impact of three environmental variables on input difference;erepresents the error term.
For the period 2010-2014, each year needs three separate regression equations, and the regression equation is used to explain the theory of influence on operational efficiency of agricultural insurance agency, namely whether the three above hypotheses are supported. Eviews6.0 is used for the regression of the above equation, and the results are shown in Table 3. The corresponding fitting equations are as follows:
y1=-914.9796-929.5832x2+101.1289x3-5082.094x4+1113.113x5+633.4695x6+e,e~N(0,σ2);
y2=-656.4471-712.9259x2+47.8913x3-2873.374x4+890.9738x5+815.6496x6+e,e~N(0,σ2);
y3=453.375x5-161.7804x6+e,e~N(0,σ2).
(i) From Table 3 and the above equation, it is found that the relationship between nature of agricultural insurance agency (x1) and the input difference variables (ownership capital, operating expenses, number of employees) does not pass test, and the relationship needs to be further investigated. (ii) There are significant opposite changes in type of agricultural insurance agency and the input difference variables (ownership capital, operating expenses). Here the comprehensive agricultural insurance agency is set to 0 while the professional agricultural insurance agency is set to 1, indicating that the input difference of professional agricultural insurance agency is larger than that of comprehensive agricultural insurance agency, and professional agricultural insurance agency is greatly affected by environmental factors. (iii) There are significant same changes in the operating time of agricultural insurance agency and the input difference variables (ownership capital, operating expenses). It shows that the length of operating time of agricultural insurance agency can affect the resource utilization of agricultural insurance agency. The longer the operating time, the better the management and technology for agency, and the less the waste of input resources. (iv) There are significant opposite changes in market share and the input difference variables (ownership capital, operating expenses). This means that the larger the market share of agricultural insurance agency, the greater the difference between them, the greater the gap between actual efficiency value and best efficiency value. (v) There are significant same changes in the proportion of agricultural insurance business and the input difference variables (ownership capital, operating expenses, number of employees). The larger the proportion of agricultural insurance business, the larger the input difference. After adjustment of input, the agricultural insurance efficiency gets higher. (vi) There are significant same changes in the quality of employees and the input difference variables (ownership capital, operating expenses). The higher the quality of employees, the greater the corresponding cost, but after adjusting the input, the agency efficiency will be higher. There are significant opposite changes in the quality of employees and the number of employees, because the higher the quality of employees, the higher the work efficiency, the smaller the number of employees.
Table3Thesecondstagemodelregressionresults

OwnershipcapitalinputdifferencevariableOperatingexpenseinputdifferencevariableEmployeenumberinputdifferencevariableConstantterm-914.9796***-656.44170***69.84990Natureofagriculturalinsuranceagency(x1)-228.4314-163.95720-50.76246Typeofagriculturalinsuranceagency(x2)-929.5832***-712.92590***-618.55150Operatingtimeofagriculturalinsuranceagency(x3)101.1289***47.89133***-1.22130Marketshare(x4)-5082.0940***-2873.37400**-47.08930Proportionofagriculturalinsurancebusiness(x5)1113.1130**890.97380**453.37500**Qualityofemployees(x6)633.4695*815.64960**-161.78040*
Note: Eviews regression results take 2014 for example;*indicates confidence level of 10%;**indicates confidence level of 5%;***indicates confidence level of 1%.
3.3ThethirdstageefficiencyanalysisThe Tobit model at the previous stage is used to change the input values, and then the input values and previous output values are put into DEA to calculate the efficiency value. By comparing Table 2 and 4, we get Table 5. By comparing the efficiency values at the two stages, it is found that there is still a large gap between the estimated efficiency value after adjustment and the efficiency value before adjustment, indicating that the environmental variables have a great impact on the efficiency value. From the vertical view, it is found that the three efficiency values dropped in most of years, indicating that due to environmental factors, the efficiency value of agricultural insurance agency at the first stage is overvalued. From the lateral view, during 2010-2014, the technical efficiency value of agricultural insurance agency at the third stage increased from 0.698 to 0.878, and the other two efficiency values also increased, indicating that the agricultural insurance market efficiency steadily increased. Although most of the efficiency values dropped after adjustment, some efficiency values still increased after adjustment. In 2010, the adjusted efficiency value was greater than the value before adjustment, indicating that in this period, the external environmental factors had a negative impact on the technical efficiency and scale efficiency of agricultural insurance market, so that the true efficiency values were underestimated.
Table4Thethirdstageefficiencyvalueofagriculturalinsuranceagency

DMU2014TEPTESE2013TEPTESE2012TEPTESE2011TEPTESE2010TEPTESEPICC0.7981.0000.7981.0001.0001.0001.001.001.001.001.001.001.0001.0001.000CICP0.9371.0000.9370.9440.9890.9540.571.000.57------SMIC0.9000.9520.9451.0001.0001.0000.851.000.851.001.001.001.0001.0001.000GYIC1.0001.0001.0001.0001.0001.0000.791.000.791.001.001.001.0001.0001.000AHIC1.0001.0001.0001.0001.0001.0000.500.840.590.410.590.690.5300.6400.830AAIC0.5970.5990.9950.7800.7801.0001.001.001.001.001.001.001.0001.0001.000CPIC0.8300.8640.9601.0001.0001.0000.760.850.891.001.001.001.0001.0001.000YGBX1.0001.0001.0000.7840.7860.9980.550.560.980.520.530.990.5100.5300.970GPIC1.0001.0001.0001.0001.0001.0000.810.820.980.891.000.90ZKIC0.5890.5890.9991.0001.0001.0000.710.711.000.760.761.000.6300.8900.710CCIC1.0001.0001.0000.6590.6620.9960.480.550.880.530.670.780.5900.6300.940TPIC1.0001.0001.0000.5470.5790.9450.470.490.960.670.680.990.4301.0000.430TAIC0.8310.8440.9850.7170.7340.9770.420.430.980.660.670.990.2300.3100.740StarrP&C1.0001.0001.0000.4090.4470.9160.440.460.960.600.601.0000.4300.6000.730HAIC0.7970.8930.8920.5110.7200.7100.541.000.540.770.870.891.0001.0001.000YAIC0.7770.9100.8530.5870.5880.9980.340.390.850.630.641.000.6400.8000.800ACIC0.8690.8710.9980.7430.7470.9950.611.000.611.001.001.000.7100.7200.990HNIC1.0001.0001.0000.7640.7680.9950.790.790.990.300.370.811.0001.0001.000SJIC0.8790.8950.9830.6561.0000.6561.001.001.00------YDCX0.6291.0000.6290.5991.0000.5991.001.001.000.751.000.75---GroupamaAVIC1.0001.0001.0000.6190.7790.7950.640.770.830.650.990.660.1780.1830.973mean0.8780.9250.9510.7800.8400.9300.680.790.870.740.810.910.6980.7820.887
Table5Comparisonoftheaverageoveralloperationalefficiencyofagriculturalinsuranceoperatorsatthefirstandthirdstagesduring2010-2014
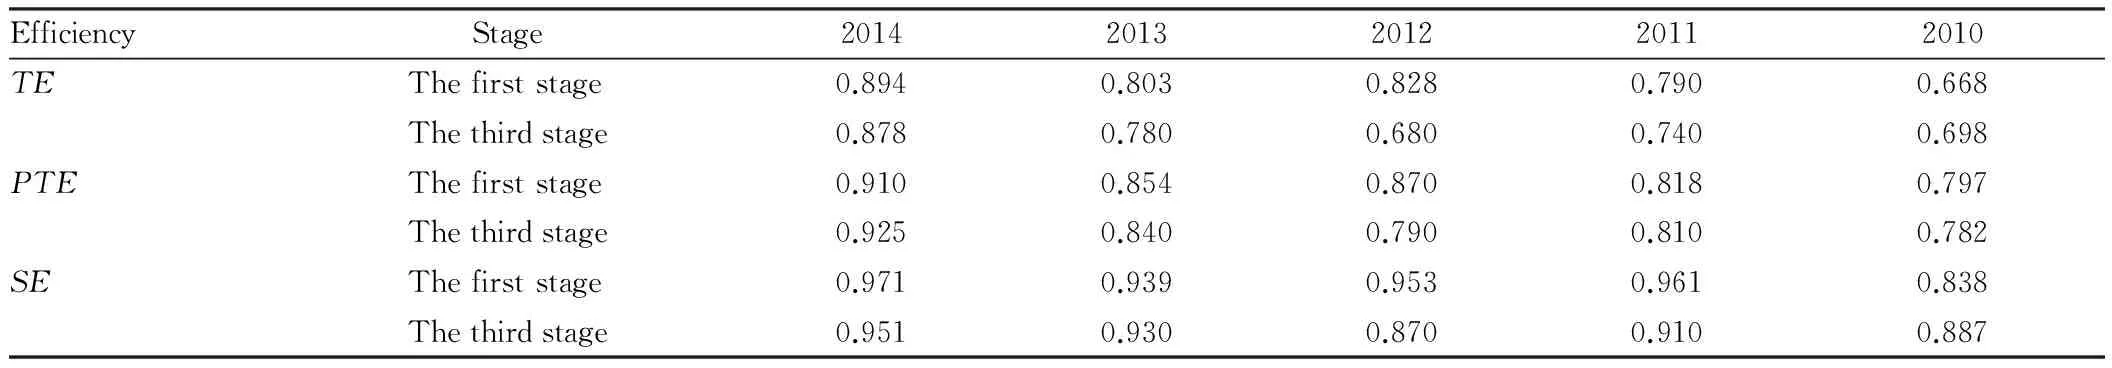
EfficiencyStage20142013201220112010TEThefirststage0.8940.8030.8280.7900.668Thethirdstage0.8780.7800.6800.7400.698PTEThefirststage0.9100.8540.8700.8180.797Thethirdstage0.9250.8400.7900.8100.782SEThefirststage0.9710.9390.9530.9610.838Thethirdstage0.9510.9300.8700.9100.887
4 Conclusions and policy recommendations
4.1ConclusionsIn this paper, we study the operational efficiency of agricultural insurance agency, and analyze the operational efficiency of agricultural insurance agency and its influencing factors in order to improve the operational efficiency of agricultural insurance agency, better supply agricultural insurance and achieve the policy effect of agricultural insurance. We draw the following conclusions: (i) Either comprehensive operational efficiency or scale efficiency of Chinese-funded agency is higher than that of foreign-funded agency, but its pure technical efficiency is lower than that of foreign-funded agency, indicating that the managerial decision ability of Chinese-funded agency is weaker than that of foreign-funded agency, and needs to be improved; (ii) The operational efficiency of professional agricultural insurance agency is higher than that of comprehensive agricultural insurance agency, and the agricultural insurance agency is greatly affected by environmental factors; (iii) The operating time of agricultural insurance agency is proportional to its operational efficiency; (iv) The quality of employees is positively correlated with the capital and cost input difference, but negatively correlated with the difference in the number of employees. Therefore, it is necessary to pay attention to the improvement of employees’ working efficiency while laying emphasis on employees’ quality.
4.2Policyrecommendations(i) It is necessary to strengthen and improve the support policies of government at all levels and create a suitable environment for the development of agricultural insurance agency. (ii) The agricultural insurance agency should reduce waste of resources, improve operational efficiency and improve service quality. (iii) The foreign-funded agricultural insurance agency should increase capital investment, expand the scale and enhance competitiveness. The low comprehensive efficiency of foreign-funded agricultural insurance agency is due to low scale efficiency, so it is necessary to expand the scale of agency, maximize the profit and improve scale efficiency. In addition, it is also necessary to maintain and improve the management level and improve efficiency. (iv) Innovation is the soul of business or industry, and the market players should strengthen the innovation capacity and establish a sense of innovation.
[1] CHEN L.A Study of the relationship between market structure and performance of insurance industry [J]. Economic Survey,2006(6): 32-34. (in Chinese).
[2] ZHANG CH. Study on the operating efficiency management of Chinese property and casualty insurance industry based on three stages of DEA [J].Insurance Studies,2011(10):22-29. (in Chinese).
[3] BU ZH.The evaluation study on the operating performance of China’s involved agricultural insurance organization based on super efficiency DEA-PCA model [J]. Journal of Central University of Finance & Economics, 2014(11): 31-38. (in Chinese).
[4] WANG JT, ZHAO LM. The empirical study on measuring and improving of operation efficiency of property insurance industry in China [J].The Journal of Quantitative & Technical Economics, 2010(3):107-118. (in Chinese).
[5] AIGNER D, LOVELL K, SCHMIDT P. Formulation and estimation of stochastic frontier production function models[J].Journal of Econometrics,1977(6): 21-37.
[6] LISA AG, MARTIN EG. X-efficiency in the U.S life insurance industry [J]. Journal of Banking and Finance,1993(17): 497-510.
[7] CUMMINS JD, WEISS MA. Measuring cost efficiency in the property-liability insurance industry [J].Journal of Banking and Finance, 1993,17(2-3): 463-481.
[8] CUMMINS JD,WEISS MA. Analyzing firm performance in the insurance industry using frontier efficiency and productivity methods [M]. Handbook of Insurance, Kluwer Academic Publishers,2000: 767-825.
 Asian Agricultural Research2016年12期
- Asian Agricultural Research的其它文章
- How to Improve Tea Farmers’ Livelihoods in the Sightseeing Place along Lijiang River Valley?
- Brand Construction of Agricultural Enterprises: A Case Study of Hubei Hanway Ecological Agriculture Group
- Impact of Online Comments on Purchase Intention of College Student Consumers under Online Shopping
- Empirical Research on Farmer’s Breaching Behavior in Order Contract
- Suitability Evaluation of Garden Landscape in Chizhou Residential Area
- Effect of Vector Density and Competence on Macromolecular Vector Transformation Efficiency