2009年和2010年夏季我国及周边地区STE模拟与对比分析
2016-06-22 02:51曹治强吕达仁
大气科学学报 2016年3期
曹治强,吕达仁
① 中国科学院 大气物理研究所 中层大气与全球环境探测重点实验室,北京 100029;② 中国科学院大学,北京 100049;③ 国家卫星气象中心,北京 100081
2009年和2010年夏季我国及周边地区STE模拟与对比分析
曹治强①②③*,吕达仁①
① 中国科学院 大气物理研究所 中层大气与全球环境探测重点实验室,北京 100029;② 中国科学院大学,北京 100049;③ 国家卫星气象中心,北京 100081
2014-04-27收稿,2014-06-19接受
国家重点基础研究发展计划(973计划)项目(2010CB428601)
摘要夏季是深对流多发的季节,深对流在STE(Stratosphere Troposphere Exchange,对流层—平流层交换)过程中起着重要作用。对2005—2012年夏季我国及周边地区的深对流统计发现,2009年深对流发生的次数较少,2010年深对流发生的次数较多。通过拉格朗日输送模式对2009年和2010年夏季的大气运动状态进行模拟并统计分析,发现30°N以南和以北的地区具有明显不同的平流层—对流层交换特征,30°N以北我国及周边地区TST(Troposphere to Stratosphere Transport,对流层向平流层输送)和STT(Stratosphere to Troposphere Transport,平流层向对流层输送)较为活跃,30°N以南远没有30°N以北地区活跃,但其净输送量却大致相当。在30°N以南,6—8月净输送是对流层向平流层输送。在30°N以北,6月净输送是平流层向对流层输送,7—8月净输送是对流层向平流层输送。比较深对流出现较少的2009年夏季和深对流出现较多的2010年夏季的TST和TST-STT,发现2010年6—8月这3个月的TST和TST-STT总量都超过2009年,表明2010年夏季我国及周边地区对流层向平流层的输送和净输送都强于2009年,与深对流活动的多少可能表现出正相关。
关键词
夏季
平流层—对流层交换
模拟
统计分析
STE(Stratosphere Troposphere Exchange,对流层—平流层交换)既包含对流层向平流层的输送(TST,Troposphere to Stratosphere Transport),也包含平流层向对流层的输送(STT,Stratosphere to Troposphere Transport)。STE对平流层和对流层高层的水汽和大气化学成分的影响十分重要,进而对全球地气系统的辐射平衡和气候变化起着重要作用。夏季是深对流多发的季节,深对流云团中强烈的上升运动可以把对流层低层大气迅速输送到对流层高层,甚至直接输送到平流层低层,这在STE过程中起着重要作用。Dickerson et al.(1987)最先提出雷暴对于污染物输送的作用。Poulida et al.(1996)通过对O3、CO等成分的观测,描述了一次中尺度对流复合体引起的STE,Stenchikov et al.(1996)模拟了这一过程引起的对流层顶折叠,以及边界层污染物向对流层上部以及下平流层的输送。Holton et al.(1995)基于准物质面的观点,给出了一张大气上下层相互作用的经圈环流图像。Stohl et al.(2003)在Holton et al.(1995)给出的经典模型基础上,进一步发展了STE的概念模型,他按对大气化学性质影响的强弱,分别对影响较强的深交换过程与影响较弱的浅交换过程给予了描述和区别。目前,深交换事件在STE中的作用还是一个重要而知之甚少的领域(陈洪滨等,2006;施春华等,2015)。STE经常发生在对流层顶折叠处以及切断低压存在时。杨健和吕达仁(2003,2004)统计了1999—2000年的东亚地区的切断低压,指出东亚地区的切断低压引起的STT的重要性。另外,亚洲夏季风是低层污染物进入平流层的重要途径(卞建春等,2011),陈斌等(2010)等利用NCEP/NCAR再分析资料驱动FLEXPART模式对夏季亚洲季风区对流层向平流层输送的源区、路径及其时间尺度进行了模拟和分析,得到了夏季亚洲季风区TST两个主要的边界层源区。
由于STE这一过程包含复杂的物理过程、化学过程和动力过程,时间尺度上STE可以在气候尺度、天气尺度、中小尺度和湍流尺度等不同尺度中进行,空间尺度上它又具有局地性和全球性,因而它是一个十分复杂的过程。为了了解我国及周边地区夏季TST和STT的双向交换特征,这里首先对2005—2012年夏季我国及周边地区的深对流进行统计,了解了深对流发生的年际变化情况,接着通过拉格朗日模式对深对流发生较少的2009年6—8月和深对流发生较多的2010年6—8月的大气运动状态进行了模拟,并对2009、2010年夏季的STE特征进行了对比分析。
1使用的数据和模拟方法介绍
本文在深对流的统计分析时使用的是2005—2012年6—8月风云二号卫星每天24次的L2级卫星红外窗区通道亮温(TBB)数据,分辨率为0.1°×0.1°,用-52 ℃作为阈值来判识深对流(Cotton et al.,1989;Mcanelly and Cotton,1989;郑永光等,2008;祁秀香和郑永光,2009)。另外,在进行模式模拟时使用NCEP 1°×1°度间隔的再分析场数据作为输入。
这里模拟使用的拉格朗日扩散模式是FLEXPART,Stohl et al.(1998)对其进行了验证,认为它是最好的扩散模式之一。之后不断有新版本升级,并且被广泛应用大气污染输送、森林火灾污染物的中尺度输送以及全球对流层平流层交换方面的研究(Stohl and Thomson,1999;James et al.,2003a,2003b;Stohl et al.,2003;Forster et al.,2007)。在本文中,模拟区域设置为30~175°E、0°~70°N。模拟时采用了区域填充选项。区域填充指的是把所选择的三维区域按质量等分成许多个粒子,每个粒子代表一定体积的空气块。所有粒子质量总和等于整个三维空间大气质量。模式积分开始之后,粒子将在所设定的区域内自由运动。在区域的边界上,会产生流入和流出,当累积流入边界内的物质质量超过一个粒子的质量时,在此边界上将有一个新的粒子产生。相反,当边界有粒子流出时,这一粒子将消失。在本次模拟试验中,模拟高度设为0~23 km,把所选择区域的大气分成了25万个粒子。这样,每个粒子具有的质量约为3.8×10¹²kg。模式输出数据包含每个粒子的位置信息以及粒子所在位置的对流层顶高度,设置模拟结果每6 h输出一次。
2深对流的年际统计分布特征
图1是2005—2012年6—8月中国陆地区域深对流发生的总次数的年际变化。其中总次数按格点计算,每个格点的大小为0.1°×0.1°,也就是TBB资料的分辨率。每一个格点出现一个时次(一个时次为一小时)记为1,然后再累加起来,所以纵坐标表示的是所有中国陆地区域发生深对流的格点在指定时间段内的累加值。可以看出,2006和2009年夏季深对流发生的次数明显低于平均数,2010年深对流发生的次数明显高于平均数,除此之外,其他年份虽然深对流发生的总次数有所波动,但总体变化不大。
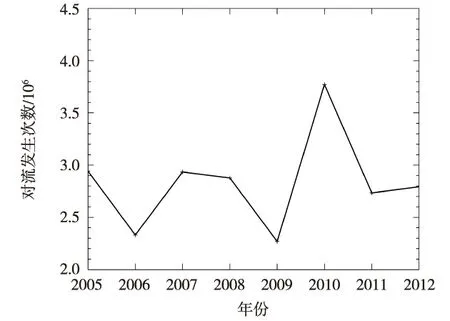
图1 2005—2012年6—8月中国陆地区域深对流发生的总次数Fig.1 Total deep convection points from June to August during 2005—2012
3我国及周边地区夏季STE整体特征
选择75~135°E、15~55°N之间区域作为分析对象来代表我国及周边地区,它涵盖了我国大部分陆地和海洋。逐月TST和STT粒子数浓度分布表明:在30~55°N之间,为TST和STT活跃的区域。15~30°N之间的区域,TST和STT活跃程度远不如30~55°N之间的区域,但TST明显多于STT。限于篇幅,这里只给出了2009年7月瞬时交换的TST和STT粒子数浓度平均分布(图2)。形成这种特征的主要原因可能是:在夏季,30~50oN之间是热带对流层顶和极地对流层顶的过渡区,副热带高空急流也位于这一区域,在急流带附近常发生对流层顶的折叠,导致TST和STT非常活跃。
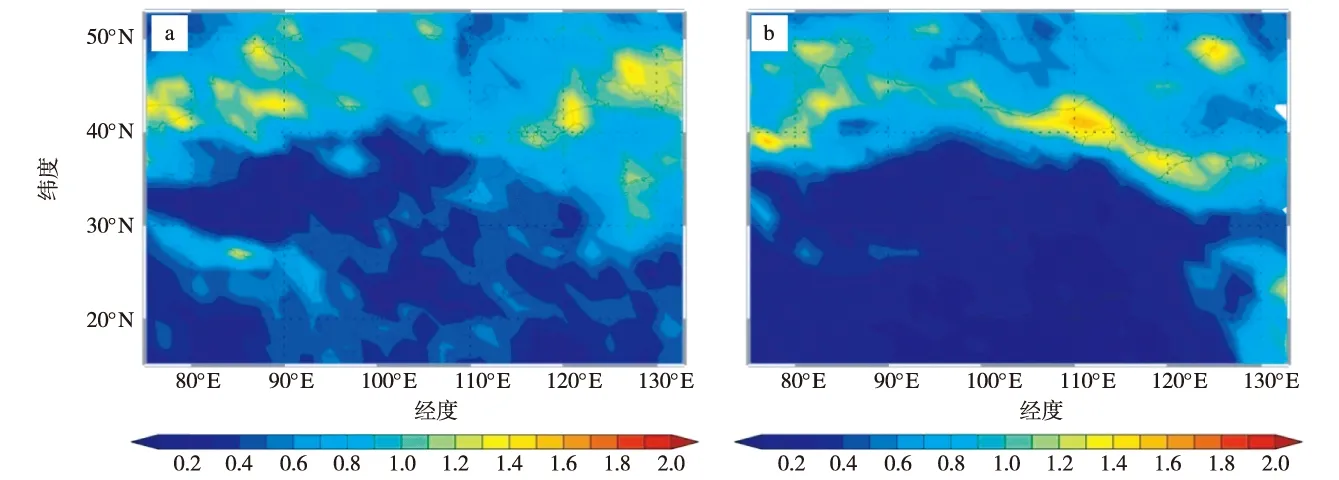
图2 2009年7月瞬时交换的TST(a)和STT(b)粒子数浓度月平均分布Fig.2 The monthly average number concentration of instant (a)TST and (b)STT
分别对2009年6—8月和2010年6—8月的多个时次作滞留时间超过48 h的TST和STT的粒子交换位置及其移动路径和对应时刻的200 hPa位势高度场和风矢量的叠合。为了节省篇幅,这里只给出了2010年7月15日00时(世界时,下同)的图像(图3)。可以看到这些粒子48 h内的移动路径与200 hPa的环流形势是比较一致的,这也印证了模拟的粒子运动轨迹是可信的。脊线位于30°N附近的反气旋式环流系统是南亚高压,它的位置在夏季不同的月份和日期有所不同,在东西和南北方向上有所移动,或者偏强或者偏弱,跟大尺度的环流形势有关。在40~45°N附近是副热带西风急流带,它随其北侧的槽脊而弯曲。在南亚高压脊线以南75~135°E之间的地区上空STT输送的粒子相对较少,多数为TST输送的粒子,这些粒子随高空东风向偏西方向移动。在副热带西风急流带附近是TST和STT都很活跃的地区,其TST的起点主要出现在200 hPa高空槽前,STT的起点主要出现200 hPa高空脊前,这些粒子主要随高空气流向偏东方向移动。
42009年夏季我国及周边地区STE特征
在STE过程中,有一部分穿越对流层顶的空气块是可逆的,即它们会在STE发生后的数小时内再次返回它们原来所在的层次(对流层或平流层),属于浅交换。统计研究表明,相当大一部分穿越对流层顶的空气块在6 h左右会回到它初始的位置。根据前人研究和计算结果,72 h和96 h的深交换已经很接近,即使采用更长的时间标准,变化亦不明显,可以认为是不可逆交换(陈斌,2009)。
为了了解我国及周边地区夏季STE特征,这里给出了这一区域6—8月的逐月TST和STT总量分布(图4)。可以看出,6月我国及周边地区的瞬时交换的和滞留时间超过48 h的TST粒子总数都小于STT,表明6月我国及周边地区STE的净输送是从平流层向对流层输送物质。7月和8月我国及周边地区的瞬时交换的和滞留时间超过48 h的TST粒子总数都大于STT,表明7月和8月我国及周边地区STE的净输送是从对流层向平流层输送物质。比较瞬时交换量和滞留时间超过48 h的交换量,滞留时间超过48 h的粒子数大约是瞬时交换的粒子数的一半,另一半在48 h内再次返回它们原来所在的层次。

图3 2010年7月15日00时滞留时间超过48 h的TST和STT粒子的交换位置及其48 h内的移动路径(a;“+”表示发生TST或STT的位置;红色为TST,蓝色为STT),以及200 hPa高度场和风矢量叠合(b;单位:dagpm)Fig.3 (a)The location and path of particle numbers whose TST and STT residence time exceeded 48 hours(“+” is the location of TST or STT occurrence;red lines for TST,blue for STT);(b)Geopotential height and wind vectors at 200 hPa(units:dagpm)
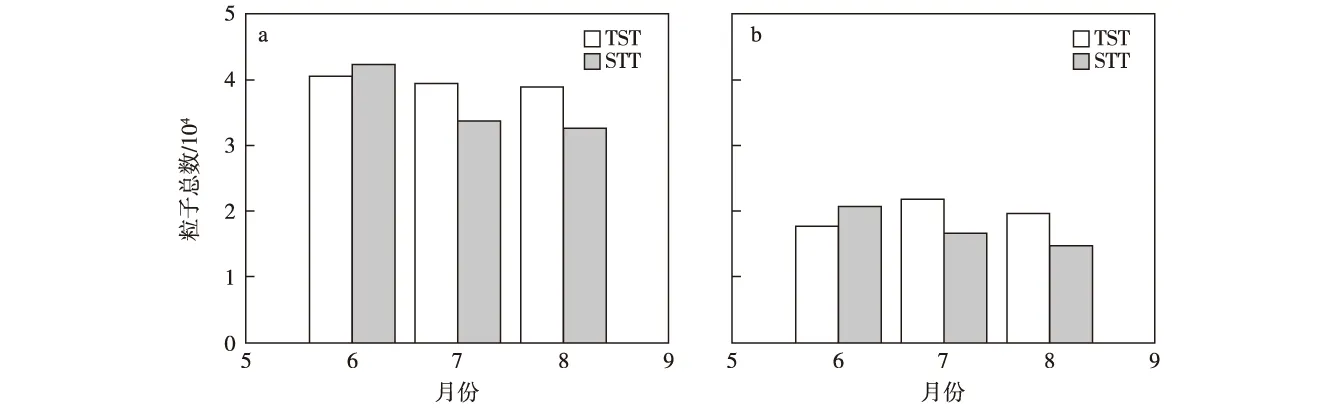
图4 2009年6—8月累计TST和STT总量分布 a.瞬时交换的粒子总数;b.滞留时间超过48 h的粒子总数Fig.4 Monthly accumulative particle numbers of TST and STT from June to August 2009:(a)particle numbers of instant STE;(b)particle numbers of STE exceeding 48 hours

图5 2009年6—8月瞬时交换(00)和滞留时间分别超过06、12、24、48 h的累计TST(a)、STT(b)和TST减STT(c)总量分布Fig.5 Monthly accumulative particle numbers of instant STE,STE exceeding 12 hours,STE exceeding 24 hours,and STE exceeding 48 hours,from June to August 2009:(a)TST;(b)STT;(c)TST minus STT
图5给出了2009年6—8月瞬时交换(00)和滞留时间分别超过06、12、24、48 h的累计TST、STT和TST减STT总量分布。从TST和STT的粒子滞留时间柱状图上可以看出,在交换发生后的6 h内,发生TST和STT的粒子数迅速减小,表明有很多粒子在6 h内又回到了原来的层次,在随后的48 h内也呈单调返回的趋势,返回速度趋于变缓。这与陈斌等(2010)的模拟结果是一致的。从48 h内TST减STT总量柱状图(图5c)上可以看到,净交换量并不随着TST和STT的减小而呈现单调减小的趋势。7月和8月的从12~48 h的净交换量反而有所增加,这表明12时后发生TST的粒子返回对流层的数目少于发生STT的粒子返回平流层的数目,发生STT的粒子更具有可逆性。
4.175~135°E、15~30°N之间区域STE特征选择TST和STT的发生位置位于75~135°E、15~30°N之间的粒子,按月进行累计,得到这一区域TST和STT的月总量,如图6所示。从总量上看,这一区域瞬时TST的月累积量为8 000个粒子左右,约占我国及周边地区TST总量的1/5。瞬时STT的月累积量为4 000个粒子左右,约占我国及周边地区的1/8。滞留时间超过48 h的TST粒子总数约为5 000个粒子,约占我国及周边地区TST总量的1/4。滞留时间超过48 h的STT粒子总数约为2 400个粒子,约占我国及周边地区STT总量的1/7。可见这一区域的TST和STT的粒子总数在我国及周边地区的占比较少,但TST粒子的数目约为STT粒子数目的2倍,TST占据绝对的主导作用,是对流层向平流层净输送区。

图6 2009年6—8月75~135°E、15~30°N之间区域累计TST和STT总量分布 a.瞬时交换的粒子总数;b、滞留时间超过48 h的粒子总数Fig.6 Monthly accumulative particle numbers of TST and STT in (15—30°N,75—135°E) from June to August 2009:(a)instant TST and STT;(b)TST and STT lasting over 48 hours
4.275~135°E、30~55°N之间区域STE特征
选择TST和STT的发生位置位于75~135°E、30~55°N之间的粒子,按月进行累计,得到这一区域TST和STT的月总量,如图7所示。从总量上看,这一区域瞬时TST的月累积量和滞留时间超过48 h的TST和STT粒子总数都远超75~135°E、15~30°N之间区域的粒子总数。因而其属于我国及周边地区TST和STT比较活跃的区域。逐月来看,其中6月STT的粒子总数多于TST的粒子总数,其净输送量是从平流层到对流层。7月和8月,TST粒子总数多于STT的粒子总数,其净输送量是从对流层到平流层。

图7 2009年6—8月75~135°E、30~55°N之间区域累计TST和STT总量分布 a.瞬时交换的粒子总数;b.滞留时间超过48 h的粒子总数Fig.7 Monthly accumulative particle numbers of TST and STT in (30—55°N,75—135°E) from June to August 2009:(a)instant TST and STT;;(b)TST and STT lasting over 48 hours
52009与2010年夏季我国及周边地区STE特征对比
对比2009和2010年6—8月75~135°E、15~55°N之间区域滞留时间超过48 h的TST总量,发现2010年6—8月这3个月的TST总量都超过2009年,表明2010年夏季我国及周边地区对流层向平流层的输送强于2009年。净输送方面,2010年6—8月这3个月的TST-STT总量都超过2009年,表明2010年夏季我国及周边地区对流层向平流层的净输送量大于2009年(图8)。由于2009年夏季是我国深对流活动最少的一年,而2010年是我国深对流活动最多的一年。在这一方面,对流层向平流层的净输送与深对流活动的多少表现出了一定的正相关。

图8 2009和2010年6—8月75~135°E、15~55°N之间区域滞留时间超过48 h的TST(a)和TST-STT(b)总量分布Fig.8 Monthly accumulative particle numbers of (a)TST and (b)TST minus STT,lasting over 48 hours,in (15—55°N,75—135°E),from June to August 2009 and 2010
分区域来看,从75~135°E、15~30°N之间区域滞留时间超过48 h的TST和STT总量分布(图9)上可以看出,2010年6—8月这3个月的TST总量都超过2009年,表明2010年这一区域对流层向平流层的输送强于2009年。在STT方面,2010年6月弱于2009年,7—8月强于2009年。净输送方面,2010年6月TST-STT总量超过2009年,但2010年7—8月TST-STT总量却低于2009年。由此可见,虽然2010年7—8月TST多于2009年,但由于STT也明显多于2009年,造成对流层向平流层的净输送反而低于2009年。

图9 2009和2010年6—8月75~135°E、15~30°N之间区域滞留时间超过48 h的TST(a)、STT(b)和TST-STT(c)总量分布Fig.9 Monthly accumulative particle numbers of (a)TST,(b)STT and (c)TST minus STT,lasting over 48 hours,in (15—30°N,75—35°E),from June to August 2009 and 2010

图10 2009和2010年6—8月75~135°E、30~55°N之间区域滞留时间超过48 h的TST(a)、STT(b)和TST-STT(c)总量分布Fig.10 Monthly accumulative particle numbers of (a)TST,(b)STT and (c)TST minus STT,lasting over 48 hours,in (30—55°N,75—35°E),from June to August 2009 and 2010
从75~135°E、30~55°N之间区域滞留时间超过48 h的TST和STT总量分布(图10)上可以看出,2010年6—8月这3个月的TST总量也都超过2009年,表明2010年这一区域对流层向平流层的输送强于2009年。在STT方面,2010年6月略强于2009年,7—8月略弱于2009年。净输送方面,2009年6月和2010年6月TST-STT均为负值,表明其净输送方向是从平流层向对流层,2009年6月的净输送量更大一些。2009年7—8月和2010年7—8月TST-STT均为正值,表明其净输送方向是从对流层向平流层,而且2010年要明显强于2009年。
对比75~135°E、15~30°N之间区域和75~135°E、30~55°N之间区域的输送,从量级上来看,前者TST和STT的月输送总数大约在2 000~7 000个粒子之间,月净输送总数大约在1 500~4 000粒子之间。TST的输送量明显大于STT的输送量,表现为对流层向平流层的净输送。对于后一区域,TST和STT的月输送总数大约在12 000~18 000个粒子之间,月净输送总数大约在1 000~4 000个粒子之间。二者之差在6月表现为负值,净输送是从平流层向对流层方向。7—8月为正值,净输送是从对流层向平流层方向。由以上数据可知,75~135°E、15~30°N之间区域TST和STT单向输送远低于75~135°E、30~55°N之间区域,但二者之差,即净输送量相当。
6结论与讨论
通过对2005—2012年6—8月中国陆地区域深对流发生的次数统计分析表明,2009年夏季是其中深对流活动最少的一年,而2010年是其中深对流活动最多的一年。分别对2009、2010年夏季的大气运动状态进行模拟,并进行统计分析,结论如下。
在75~135°E、15~30°N之间区域,TST和STT活跃程度远不如75~135°E、30~55°N之间区域。这可能是因为在6—8月,副热带西风急流带位于40~45°N附近,在副热带西风急流带附近常发生对流层顶的折叠,导致TST和STT非常活跃。
75~135°E、15~30°N之间区域的滞留时间超过48 h的TST和STT单向输送都远小于75~135°E、30~55°N之间区域的TST和STT单向输送。但二者之差,即净输送量却相差不多。6—8月,前一区域一直表现为稳定的净对流层向平流层输送,而后一区域6月为净平流层向对流层输送,7—8月为净对流层向平流层输送。
对比2009和2010年夏季我国及周边地区滞留时间超过48 h的TST总量,发现2010年6—8月这3个月的TST和TST-STT总量都超过2009年,表明2010年夏季我国及周边地区对流层向平流层的输送和净输送都强于2009年,对流层向平流层的输送和净输送与深对流活动的多少可能表现出了一定的正相关。
参考文献(References)
卞建春,严仁嫦,陈洪滨.2011.亚洲夏季风是低层污染物进入平流层的重要途径[J].大气科学,35(5):897-902.Bian J C,Yan R C,Chen H B.2011.Tropospheric pollutant transport to the stratosphere by Asian summer monsoon[J].Chin J Atmos Sci,35(5):897-902.(in Chinese).
陈斌.2009.青藏高原及其周边区域夏季上对流层水汽变化和输送特征研究[D].北京:中国气象科学研究院:154.Chen B.2009.The study on the uppper troposphere water vapor change and transportation characteristics over Tibetan Plateau and its adjoint regions in boreal summer[D].Beijing:Chinese Academy of Meteorological Sciences:154.(in Chinese).
陈斌,徐祥德,卞建春,等.2010.夏季亚洲季风区对流层向平流层输送的源区、路径及其时间尺度的模拟研究[J].大气科学,34(3):495-505.Chen B,Xu X D,Bian J C,et al.2010.Sources,pathways and timescales for the troposphere to stratosphere transport over Asian monsnoon regions in boreal summer[J].Chin J Atmos Sci,34(3):495-505.(in Chinese).
陈洪滨,卞建春,吕达仁.2006.上对流层—下平流层交换过程研究的进展与展望[J].大气科学,30(5):813-820.Chen H B,Bian J C,Lyu D R.2006.Advances and prospects in the study of stratosphere-troposphere exchange[J].Chin J Atmos Sci,30(5):813-820.(in Chinese).
Cotton W R,Lin M S,McAnelly R L,et al.1989.A composite model of mesoscale convective complexes[J].Mon Wea Rev,117(4):765-783.
Dickerson R R,Huffman G J,Luke W T,et al.1987.Thunderstorms:An important mechanism in the transport of air pollutants[J].Science,235:460-465.
Forster C,Stohl A,Seibert P.2007.Parameterization of convective transport in a Lagrangian particle dispersion model and its evaluation[J].J Appl Meteor Climatol,46:403-422.
Holton J R,Haynes P H,McIntyre E M,et al.1995.Stratosphere-troposphere exchange[J].Rev Geophys,33:403-439.
James P,Stohl A,Forster C,et al.2003a.A 15-year climatology of stratosphere-troposphere exchange with a Lagrangian particle dispersion model:1.Methodology and validation[J].J Geophys Res,108(D12):8519.doi:10.1029/2002JD002637.
James P,Stohl A,Forster C,et al.2003b.A 15-year climatology of stratosphere-troposphere exchange with a Lagrangian particle dispersion model,2,Mean climate and seasonal variability[J].J Geophys Res,108(D12):8522.doi:10.1029/2002JD002639.
McAnelly R L,Cotton W R.1989.The precipitation life cycle of mesoscale convective complexes over the central United States[J].Mon Wea Rev,117(4):784-808.
Poulida O,Dickerson R R,Heymsfield A.1996.Stratosphere-troposphere exchange in a midlatitude mesoscale convective complex:1.Observations[J].J Geophys Res,101:6823-6839.
祁秀香,郑永光.2009.2007年夏季我国深对流活动时空分布特征[J].应用气象学报,20(3):286-290.Qi X X,Zheng Y G.2009.Distribution and spatiotemporal variations of deep convection over China and its vicinity during the summer of 2007[J].J Appl Meteor Sci,20(3):286-290.(in Chinese).
施春华,常舒捷,沈新勇,等.2015.夏季云顶高于对流层顶事件对东亚天气型及上对流层—下平流层大气结构的影响[J].大气科学学报,38(6):804-810.Shi C H,Chang S J,Shen X Y,et al.2015.The effects of cloud top above tropopause events on the structures of the upper troposphere and lower stratosphere in summer over East Asia[J].Trans Atmos Sci,38(6):804-810.(in Chinese).
Stenchikov G,Dickerson R,Pickering K,et al.1996.Stratosphere-troposphere exchange in a midlatitude mesoscale convective complex 2.Numerical simulations[J].J Geophys Res,101(D3):6837-6851.
Stohl A,Thomson D J.1999.A density correction for Lagrangian particle dispersion models[J].Bound-Layer Meteor,90:155-167.
Stohl A,Hittenberger M,Wotawa G.1998.Validation of the Lagrangian particle dispersion model FLEXPART against large scale tracer experiment data[J].Atmos Environ,32:4245-4264.
Stohl A,Bonasoni P,Cristofanelli P,et al.2003.Stratosphere-troposphere exchange:A review,and what we have learned from STACCATO[J].J Geophys Res,108(D12):8516.doi:10.1029/2002JD002490.
杨健,吕达仁.2003.东亚地区一次切断低压引起的平流层、对流层交换数值模拟研究[J].大气科学,27(6):1031-1044.Yang J,Lyu D R.2003.A simulation study of stratosphere-troposphere exchange due to cut-off-low over eastern Asia[J].J Appl Meteor Sci,27(6):1031-1044.(in Chinese).
杨健,吕达仁.2004.东亚地区平流层、对流层交换对臭氧分布影响的模拟研究[J].大气科学,28(4):579-588.Yang J,Lyu D R.2004.Simulation of stratosphere-troposphere exchange effecting on the distribution of ozone over eastern Asia[J].J Appl Meteor Sci,28(4):579-588.(in Chinese).
郑永光,陈炯,朱佩君.2008.中国及周边地区夏季中尺度对流系统分布及其日变化特征[J].科学通报,53(4):471-481.Zheng Y G,Chen J,Zhu P J.2008.Distribution and diurnal variation of mesoscale convective systems in China and its surrounding areas[J].Chin Sci Bull,53(4):471-481.(in Chinese).
Stratosphere-troposphere exchange(STE) is a process not only involving transport from the troposphere to stratosphere,but also from the stratosphere to troposphere.STE is very important to the variation of water vapor and atmospheric chemical compositions.Correspondingly,it also plays an important role in the radiation balance and climate changes in the global climate system.Deep convection occurs frequently in summer.The strong upward flow in deep convective cloud can transport the atmosphere of the lower troposphere quickly to the upper troposphere,and even to the lower stratosphere.Thus,it is very important in the process of STE.To date,this conclusion has been reached largely with the help of aircraft observations.
STE is a process that includes complex physical,chemical and dynamic processes.The time scale of STE can be climatological,synoptic,meso,and turbulent,while the spatial scale varies from local to global.Therefore,STE is a highly complex process,and to study such a complex process,using models to quantitatively simulate the transport processes is a good method.FLEXPART is a Lagrangian diffusion model.It is widely used in the transport of air pollution,the mesoscale transport of smoke from forest fires,as well as global STE.
In this study,firstly,data on deep convection in China and surrounding areas for the period 2005—2012 were collected.The source of the data—collected 24 times a day and at a spatial resolution of 0.1°—was the FY-2 satellite.Through statistical analysis,the interannual variation of the deep convection was determined.One year of minimum convection and one year of maximum convection were selected from the overall study period.Then,the domain(15—30°N,75—135°E)was selected to represent China and its surrounding areas.In order to understand the bidirectional exchange characteristics of troposphere-to-stratosphere transport(TST)and stratosphere-to-troposphere transport(STT)in summer in this region,the atmospheric circulation status of the two selected years from June to August was simulated using FLEXPART.The statistical and model results were analyzed,revealing the following:
In the summer season of 2009,deep convection occurred least frequently;while in the summer season of 2010,it occurred most frequently.The atmospheric circulation from June to August 2009 and 2010 was simulated using FLEXPART,and it was found that the area south of 30°N and the area north of 30°N possessed different characteristics of STE.In the area north of 30°N,TST and STT were active;whereas,in the area south of 30°N they were far less active than the area north of 30°N.However,the net transport (TST minus STT)was roughly equal.From June to August,in the area south of 30°N,the net transport was from the troposphere to stratosphere;while in June,in the area north of 30°N,the net transport was from the stratosphere to troposphere.In July and August,the net transport was from the troposphere to stratosphere.Comparing the TST and TST-minus-STT of summer 2009 and 2010,it was found that the total amount of TST and TST-minus-STT from June to August 2010 was more than that in 2009.This means that the transportation from the troposphere to stratosphere was larger in 2010 than in 2009.The TST and TST-minus-STT might be positively correlated with the deep convection activity,and this will be investigated in future work.
summer;stratosphere-troposphere exchange;simulation;statistical analysis
(责任编辑:张福颖)
Simulation and comparative analysis of stratosphere-troposphere exchange in the summers of 2009 and 2010 in China and surrounding areas
CAO Zhiqiang1,2,3,LYU Daren1
1KeyLaboratoryofAtmosphericandGlobalEnvironmentalDetection,InstituteofAtmosphericPhysics,ChineseAcademyofSciences,Beijing100029,China;2GraduateUniversityoftheChineseAcademyofSciences,Beijing100049,China;3NationalSatelliteMeteorologicalCenter,Beijing100081,China
doi:10.13878/j.cnki.dqkxxb.20140427001
引用格式:曹治强,吕达仁.2016.2009年和2010年夏季我国及周边地区STE模拟与对比分析[J].大气科学学报,39(3):300-308.CaoZQ,LyuDR.2016.
Simulationandcomparativeanalysisofstratosphere-troposphereexchangeinthesummersof2009and2010inChinaandsurroundingareas[J].TransAtmosSci,39(3):300-308.doi:10.13878/j.cnki.dqkxxb.20140427001.(inChi-nese).
*联系人,E-mail:caozq@cma.gov.cn
猜你喜欢
成都信息工程大学学报(2022年4期)2022-11-18
北京航空航天大学学报(2022年5期)2022-06-06
区域治理(2021年14期)2021-08-11
内蒙古民族大学学报(社会科学版)(2020年2期)2020-11-06
中国农业文摘·农业工程(2020年4期)2020-07-24
中国农业文摘-农业工程(2020年4期)2020-07-17
泰山学院学报(2019年6期)2020-01-14
表面工程与再制造(2019年3期)2019-09-18
载人航天(2016年4期)2016-12-01
高原山地气象研究(2016年1期)2016-11-10