Application of Empirical Mode Decomposition and Independent Component Analysis for the Interpretation of Rock-Mineral Spectrum
2016-07-12 12:45WUFangJIANGXipingYUHanwenXIULiancun
光谱学与光谱分析 2016年5期
WU Fang, JIANG Xi-ping*, YU Han-wen, XIU Lian-cun
1.College of Science,Nanjing Agricultural University,Nanjing 210095,China 2.Nanjing Artillery College,Nanjing 211132,China 3.Nanjing Institute of Geology and Mineral Resource,Nanjing 210016,China
Application of Empirical Mode Decomposition and Independent Component Analysis for the Interpretation of Rock-Mineral Spectrum
WU Fang1, JIANG Xi-ping1*, YU Han-wen2, XIU Lian-cun3
1.College of Science,Nanjing Agricultural University,Nanjing 210095,China 2.Nanjing Artillery College,Nanjing 211132,China 3.Nanjing Institute of Geology and Mineral Resource,Nanjing 210016,China
Rock-mineral spectrum is a mixture of varied mineral spectra, through which we can obtain information about its components quickly and conveniently without any damage to the sample.Empirical mode decomposition (EMD) cannot directly decompose source signals from information of the mixture, and independent component analysis (ICA) requires the number of mixed signals to be no less than the number of source signals.Combining these two methods, mixed signals can be decomposed using EMD method to obtain intrinsic mode function (IMF), while certain IMFs together with mixed signals can be used as input data matrix of ICA to obtain the source signals.This method overcomes the shortcomings of IMF and ICA.Studies have shown that, the higher content of source signals contained in the mixed signal, the better estimation can be obtained through EMD and ICA.The number of IMFs that participate in ICA decomposition determines the number of approximation of source signals.The accuracy of source signal estimation increases with the correlation coefficient between IMF and mixed signals.By applying this method to quantitative analysis of rock-mineral spectrum, information of the component minerals in rock-mineral can be obtained, which improves the efficiency of component analysis in detecting rock-minerals outside.
Empirical mode decomposition; Independent component analysis; Rock-mineral spectrum
Introduction
Rock-mineral spectra obtained from spectrum scanner features high spectral resolution and abundant information.Since rock-mineral has a variety of components, its rock-mineral spectrum is a mixture of various mineral spectra.The rock-mineral spectrum is known as “mixed pixel”, while the mineral spectra are called end-members.Mixed pixels are very common in all types of remote sensing hyper-spectral images[1]and synthetic aperture radar images[2].Decomposition of mixed pixels is fundamental to the interpretation of mixed pixel information.It is of great importance in resource investigations and geological prospecting to find fast and accurate decomposition methods to obtain the types and contents of the minerals according to the features of rock-mineral spectrum[3].
In practice, most of measurement signals are mixed signals from various source signals, which are non-stationary and nonlinear.Empirical Mode Decomposition (EMD) and Independent Component Analysis (ICA) are two analytical techniques for non-stationary and nonlinear signals proposed in recent years.Some researchers already applied the two methods to extract information of source signals from measurement signals.Chen Jin-yang applied ICA method in array signal processing[4].He et al.[5]applied ICA method to classify spectral remote sensing images.Badaoui et al.[6]applied cyclic Wiener filtering and ICA methods, which separated the mechanical noise and combustion noise of an internal-combustion engine.Zhang et al.[7]proposed a noise source identification method based on EMD and ICA techniques, which can identify the sources of combustion noises and mechanical noises of a diesel engine.
However, EMD cannot directly decompose the measurement signals.And ICA method requires that the number of measurement signals should be no less than the number of source signals.Thus, merely one of the two methods cannot interpret the measurement signals.To remedy this, EMD method can be applied in adaptive decomposition of measurement signals, which obtains the Intrinsic Mode Functions (IMFs).The IMFs can be combined with the measurement signals as the input data matrix of ICA, which gives enough input signals and overcomes the limitation of ICA’s requirement.This helps to obtain information of source signals by separating measurement signals when the type and number of the source signals remain unknown.The rock-mineral spectrum in this research is a measurement signal, and hereby we use EMD and ICA techniques in decomposing rock-mineral spectrum to find out the types and contents of the minerals that compose the rock-mineral.
1 Interpretation model of mixed signal
The components in rock-mineral belong to compact mixture, and the nonlinear mixing characteristics of rock-mineral spectrum are distinct.Through the Hapke radiation transformation model, the spectral reflectivity can be transformed to single scattering albedo.Similarly, we can transfer the nonlinear mixed model to linear mixed model[8].In practice, rock-mineral spectra separation adopts the spectral linear mixed model.
Suppose thatx=[x1,x2,…,xM] is the 1×Mspectral matrix of rock-mineral mixed pixels.The number of bands is Mand the number of end-members in the rock-mineral mixed pixel isN.si=[si1,si2,…,siM],i=1,2,…,N, thenS=[s1,s2,…,sN]Tis the end-member spectral matrix with dimensionN×M.The linear mixing model of spectra is
x=aS
(1)

2.1 The basic idea of EMD
EMD is first introduced by Huang in 1998[9].Based on the local time scale of signals, EMD can separate one time series signal into several IMFs and the residue.The IMFs range from low frequency to high frequency with the mean of zero.The steps of EMD method are listed as follows,
(1) Calculate all the maxima and minima of signalx(t).
(2) Use cubic spline interpolation method to calculate the upper envelopexmax(t) and lower envelopexmin(t) of the signalx(t).Calculate the mean of upper and lower envelopesm(t)=[xmax(t)-xmin(t)]/2.
(3) Calculateh(t)=x(t)-m(t).Confirm thath(t) satisfies the two conditions of IMF listed above.Otherwise, considerh(t) as the signal and repeat step (1) to (3).
(4) Ifh(t) satisfies the two conditions of IMF, we leth(t)=h1(t)=IMF1.
(5) Letd(t)=x(t)-h1(t), taked(t) as the new signal and repeat from step (1).Then we will have IMF2, IMF3, …, IMFn.
(6) When IMFnsatisfies the stop condition, such as IMFnbeing monotonic, we have IMFn=rn(t).Then IMF1, IMF2,…,IMFn-1is the IMFs separated from the signal andrn(t) is the residue.
Due to its prominent second order filter network feature, EMD may compromise for the intermittent components of the measurement signals[10].In this case, the result of EMD will produce model mixing.When this happens, an intrinsic mode function may contain multiple frequency components, even a false component, which lowers the accuracy of EMD.In practice, we can choose the helpful IMFs for the subsequent ICA decomposition through correlation analysis.
1.2 The basic idea of ICA
ICA is a signal processing method developed along with blind source separation method, the concept of which was first proposed by French scholars Juneii and Herault in 1983[11].When the source signals contained in a measurement signal are mutually independent and there is at most one Gaussian signal, we can perform blind source separation on measurement signals acquired by more than one sensor.The source signals hidden in the measurement signals can be obtained.
The linear mixing model isx=aS.xis the signal detected whileSis the source signal andais the mixing matrix.ICA process is listed as follows,
(1) Choose the objective function.
(2) Maximize or minimize the objective function by numerical calculation.
(3) Find the linear transformation matrixW(also known as separation matrix).Lety=Wx, whereW maximizes the non-Gaussian of each component ofy.Thenywould be an estimate ofS.
It has to be noted that the order and amplitude ofy’s components is uncertain.Besides, ICA requires that the number of detected signals is no less than the number of source signals.
1.3 EMD-ICA information interpretation model
EMD can break down measurement signals into the sum of a series of IMFs from high to low frequency and a residue.As the frequency component of source signals in measurement signals is not single, we cannot identify source signals through EMD alone.On the other hand, although ICA can decompose measurement signals into a series of independent components, the number of independent components obtained is limited by the number of measurement signals.The combination of EMD and ICA leads to source signals from one measurement.The EMD-ICA information interpretation model includes the following steps:
(1) decompose the mixed pixels using EMD method for multiple IMFs.
(2) select useful IMFs to make a data matrix together with mixed pixels.
(3) perform ICA on the data matrix to obtain independent components.
(4) analyze independent components.
2 Information interpretation of rock-mineral spectrum

ing matrix represents the contents of the spectra of Malachite, Microcline and Pyrophyllite in the mixed pixel.For example, in MMP205030, the content of Malachite is 20%, Microcline is 50%, and Pyrophyllite is 30%.
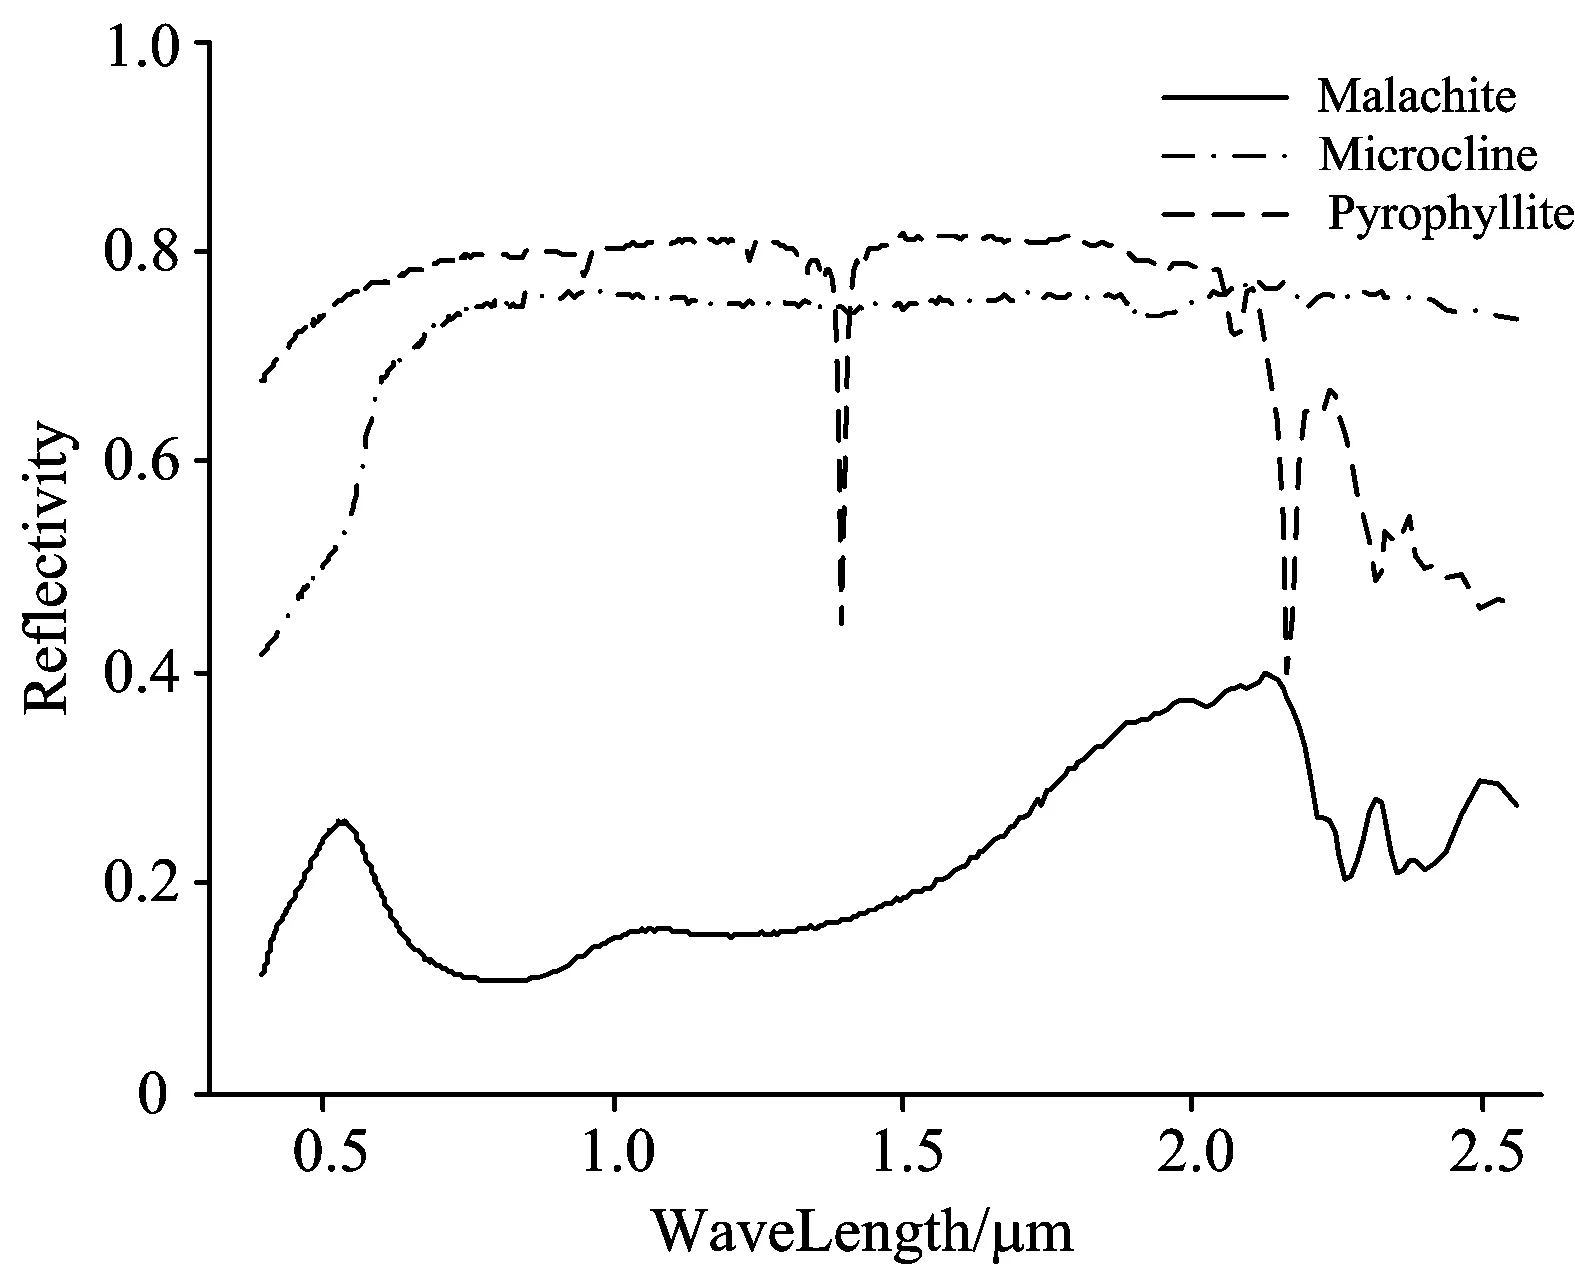
Fig.1 Spectra of malachite, microcline and pyrophyllite

Fig.2 Spectra of mixed pixels
In this study, we apply EMD-ICA information interpretation model to process the three mixed pixels respectively, compare and analyze the results of decomposing different mixed pixels.When the number of end-members in a mixed pixel is unknown, we find a method to choose appropriate number of IMFs in order to obtain the end-member information accurately.
2.1 Information Interpretation through EMD-ICA
First apply EMD method to the mixed pixels MMP205030, MMP302050 and MMP503020.Decomposition of each mixed pixel produces 8 IMFs.The correlation coefficients between these IMFs and corresponding mixed pixel spectra are shown in Table 1.

Table 1 IMFs’correlation coefficients with corresponding mixed pixel spectrum
MMP205030, MMP302050 and MMP503020 are all mixtures of the spectra of Malachite, Microcline and!Pyrophyllite.To separate the three independent components from one mixed pixel, we need to select 2 IMFs from each line of data in table 1 respectively and combine them with the corresponding mixed pixel spectra as the input data matrix of ICA decomposition.Studies have shown that, the larger the correlation coefficient between the IMF and mixed pixel spectrum, the better quality of independent components can be obtained through ICA decomposition (the absolute value of the correlation coefficient with end-member spectrum is higher).Therefore, when decomposing mixed pixel MMP205030, corresponding IMF4 and IMF8 should be chosen.On the other hand, both IMF5 and IMF8 were chosen to decompose MMP302050 and MMP503020 respectively.Through EMD-ICA information interpretation, MMP205030 obtains independent components IC1,IC2 and IC3, MMP302050 obtains independent components IC4,IC5 and IC6, and MMP503020 obtains independent components IC7,IC8 and IC9.Table 2 presents the correlation coefficients between the independent components and end-member spectra.

Table 2 Correlation coefficients between the independent components and end-member spectra
While analyzing the three independent components IC1, IC2 and IC3 of MMP205030, it is found that IC1 has the largest correlation with Microcline spectrum, thus IC1 is the estimated value of Microcline spectrum.Similarly, IC2 and IC3 are the estimated values of Malachite and Pyrophyllite respectively.Besides, in mixed pixel MMP205030, the contents of Malachite, Microcline and Pyrophyllite are 20%, 50% and 30% respectively.Through EMD-ICA information interpretation, it can be found that the higher spectral content of an end-member, the better estimated value of corresponding end-member spectrum can be obtained.In this case, as the content of Microcline is the largest, the absolute value of the correlation coefficient between IC1 and Microcline is the largest (0.844 0); as the content of Malachite is the smallest, the absolute value of the correlation coefficient between IC2 and Malachite is small (0.708 3); as the content of Pyrophyllite is between other two minerals, the correlation coefficient between IC3 and Pyrophyllite is in the middle (0.8120).
In table 2, experimental data of MMP302050,MMP503020 also indicates that EMD-ICA information interpretation model can effectively obtain information of end-members in mixed pixel spectrum.Similarly, the higher spectral content of an end-member, the better estimated value of the corresponding end-member spectrum can be obtained.
Take mixed pixels MMP205030, MMP302050 and MMP503020 as input data matrix, ICA can be applied directly to the decomposition and obtain 3 independent components, which are the estimated values of spectra of Malachite, Microcline and Pyrophyllite respectively.The correlation coefficients between them and end-member spectra are 0.839 8,0.889 5 and 0.934 6.As we can see, the quality of independent components obtained from direct ICA decomposition is higher than that of independent components obtained from single mixed pixels processed by EMD-ICA information interpretation model.This is because mixed pixel groups contain more end-member information, which lead to better estimated value of end-member spectra.However, if there are not enough mixed pixels, only EMD-ICA information interpretation model can be adopted.The independent components obtained through this method still contain plenty of information on end-member spectra.
2.2 Information Interpretation with an unknown number of end-members
In practice, the number of end-member is hard to predict.After mixed pixels are processed by EMD, most IMFs are obtained.Some of these IMFs need to be selected to compose the input data matrix of ICA decomposition together with mixed pixel spectra.
Table 3 Correlation coefficients between independent components and end-member spectra (two independent components separated from each mixed pixel)

MMP205030MMP302050MMP503020IC10IC11IC12IC13IC14IC15Malachite0.38480.01760.7224-0.3419-0.09030.8824Microcline-0.02750.87700.03460.5658-0.75360.4937Pyrophyllite0.72330.35830.51500.85300.31530.1681
The IMF, which has relatively higher correlation coefficient to the mixed pixel spectrum, contains more end-member information.Since IMF8 has the largest correlation coefficient in each row of data, it is selected and combined with corresponding mixed pixel spectrum as input spectra of ICA.The correlation coefficients between the two independent components obtained and end-member spectra are shown in table 3.
Through the analysis of experimental data in Table 3, we found that when only 2 independent components were decomposed from a mixed pixel, the 2 independent components obtained correspond to the end-members with relatively higher contents in the mixed pixel respectively.It can be found that the higher spectral content of end-member, the better quality can be achieved for corresponding independent components.For example, in mixed pixel MMP205030, the content of Microcline spectrum is the highest (50%), while the content of Pyrophyllite spectrum comes the second (30%).IC11 is the approximation of Microcline spectrum while IC10 is the approximation of Pyrophyllite spectrum.The absolute value of correlation coefficient of IC11 is 0.877 0, while the absolute value of correlation coefficient of IC10 is 0.723 3.IC11 is of higher quality than IC10.The conclusion is similar for other mixed pixels.
Therefore, when applying EMD-ICA to interpret rock-mineral spectra, IMF can be selected according to the value of correlation coefficient (from large to small), and thus obtain information of end-members with higher contents in the mixed pixel.If the number of decomposed independent components is less than the number of end-members, the independent components correspond to end-members with higher spectral contents.It can be concluded that the quality of corresponding independent component improves with the amount of content.If the number of decomposed independent components equals the number of end-members, the independent components are of the highest quality.If the number of decomposed independent components exceeds the number of end-members, the amount of data to be calculated in EMD-ICA increases.In this case, the quality of independent components is not ideal enough.
3 Interpretation of rock-mineral spectrum with real measurement data
The core sample was collected at 31.95 N, 118.83 E.The scanned core spectrum has a wavelength ranging from 1 300 to 2 500 nm with the interval of 2 nm.After pre-procession of the core spectrum with Principal Component Analysis (PCA), only the 3 major components were kept.The spectrum of the core is shown in figure 3.
The refined core spectrum was treated with EMD, which obtained 10 IMFs with correlation coefficients of 0.003 1, 0.000 4, 0.071 1, 0.145 7, 0.152 2, 0.361 5, 0.546 8, 0.546 8, 0.543 8 and 0.964 7 respectively to the core spectrum.Then, the two IMFs with highest correlation coefficients were used in the data matrix together with the original core spectrum.Followed by ICA treatment, 3 independent components were obtained, namely IC16, IC17 and IC18.The correlation coefficient of each component can be calculated independently with respect to the standard mineral spectra in USGS library.The results showed that IC16 has the highest correlation to Spessartine, with the coefficient value 0.726.Similarly, IC17 has the highest correlation to Smectite with the coefficient value 0.938, while IC18 has the highest correlation to Chrysocolla with the coefficient value 0.962.The core spectrum can also be analyzed with the portable near-infrared mineral analyzer (model BJKF-Ⅱ).The results from BJKF-Ⅱ were not exactly the same as that from EMD-ICA, but with good correlation.
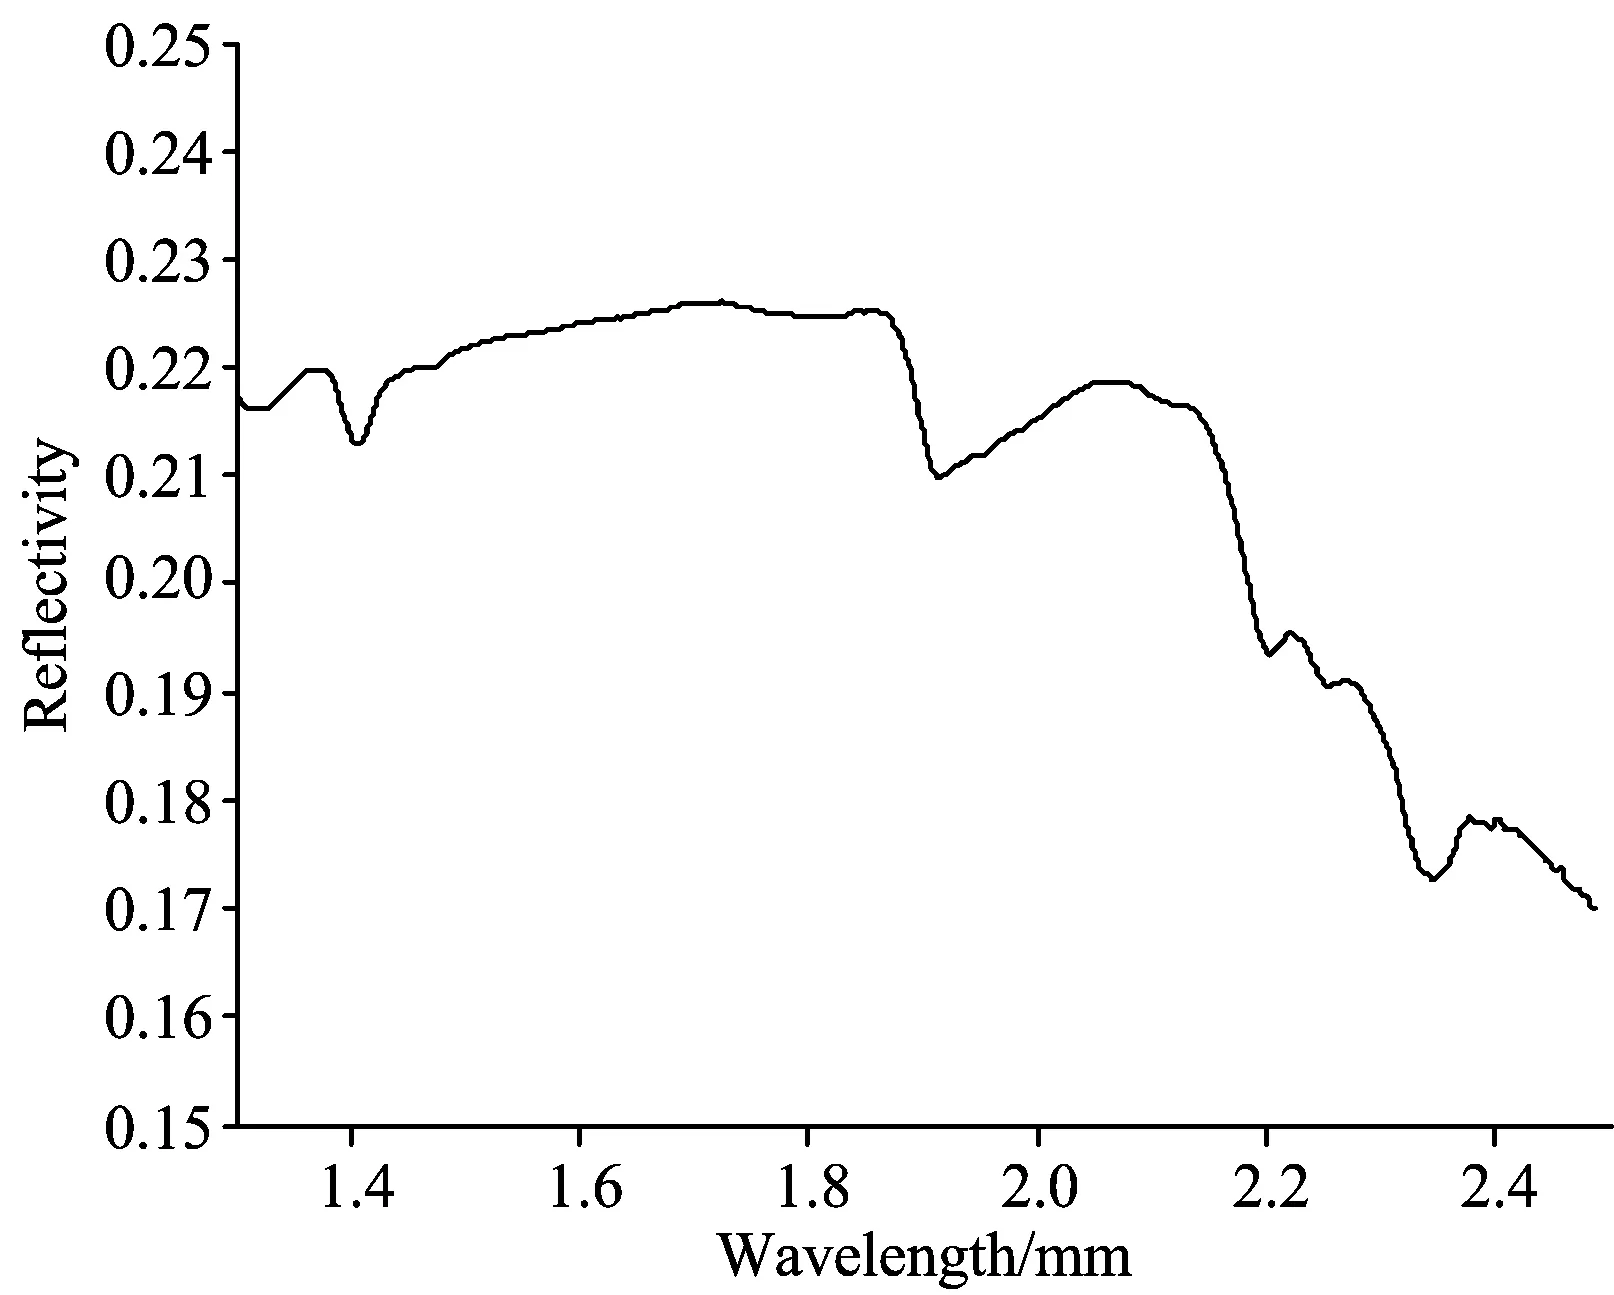
Fig.3 Spectrum of core
4 Conclusions
Through integrated application of EMD and ICA methods, we can overcome the limitation of ICA’s requirement that the number of mixed pixels should be no less than that of end-members.The end-member information can be extracted from single mixed pixel, and mixed pixel decomposition can be conducted even when there is no prior knowledge about the number of end-members.From simulation data, we find that the contents of end-member spectra in mixed pixels exert significant influence on decomposition results.The higher content of end-member spectrum, the larger correlation between independent component and the end-member spectrum can be obtained.When the number of decomposed independent components is less than the number of end-members in the mixed pixel, the independent components separated through EMD-ICA will correspond to end-members with higher spectral contents in the mixed pixel.This research is of practical importance to quantitative analysis of rock-mineral spectrum, which reveals the types and contents of its mineral composition.
Acknowledgement: Many thanks to Huang Jun-jie from Nanjing Institute of Geology and Mineral Resource for their great help in the research.
[1] M D M, A L D.IEEE Transactions on Geoscience and Remote Sensing,2004, 42(1): 271.
[2] Cao Hengzhi, Yu Xianchuan, Zhang Libao.Journal of Remote Sensing, 2009, 13(2): 217.
[3] Manrice D Craig.IEEE Transactions on Geoscience and Remote Sensing, 1994, 32: 542.
[4] Chen Jinyang.Research on Independent Component Analysis and Its Application in Array Signal Processing.PLA Information Engineering University, Master Thesis, 2011.
[5] He H, Yu X C, Peng W L.Geoscience and Remote Sensing Symposium, 2007, 3: 1658.
[6] Badaoui M EI, Daniere J, Guillet F, et al.Mechanical Systems and Signal Processing, 2005, 19(6): 1209.
[7] Zhang Junhong, Li Linjie, Liu Hai, et al.Transactions of CSICE, 2012, 30(6): 544.
[8] Wang Runsheng, Gan Fuping, Yan Bokun, et al.Remotesensing Forland & Resources, 2010, 83: 1.
[9] Huang N E, Shen Z, Long S R.Proc.R Soc., 1998, 454(1971): 903.
[10] Flandrin P, Rilling G, Goncalves P.IEEE Signal Process, Letters, 2004, 11(2): 112.
[11] Hyv?rinen A, Oja E.Neural Networks,2000, 13(4-5): 411.
*通讯联系人
O657.3
A
应用经验模态分解和独立成分分析解译岩矿光谱
吴 芳1,蒋夕平1*,于瀚文2,修连存3
1.南京农业大学理学院,江苏 南京 210095 2.南京炮兵学院,江苏 南京 211132 3.南京地质矿产研究所,江苏 南京 210016
岩矿光谱由多种矿物光谱混合而成,解译岩矿光谱能够得到岩矿的组分信息,且该方法具有快速、方便、不损坏样品的特点。经验模态分解(empirical mode decomposition, EMD)不能直接分离出混合信号中的源信号,独立成分分析(independent component analysis, ICA)要求混合信号数目不小于其所包括的源信号数目。将EMD和ICA两种方法相融合,首先用EMD分解混合信号得到本征模态函数(intrinsic mode function, IMF),再选择一定数目的IMF与混合信号一起组成ICA的输入数据矩阵,经过ICA运算可以获取单一混合信号中的源信号信息,克服了EMD和ICA两种方法各自的缺陷。研究表明,综合应用EMD和ICA方法可以获取单一混合信号中的源信号信息,混合信号中源信号含量越大,得到的源信号近似值越理想。参与ICA分离的IMF数目决定了分离得到的源信号近似值的数目,并且选择的IMF与混合信号相关系数越大,得到的源信号近似值越理想。运用该方法定量分析岩矿光谱,可以获取组成岩矿的矿物信息,比较适用于野外作业岩矿的快速分析鉴定及成分初步分析。
经验模态分解; 独立成分分析; 岩矿光谱
2015-01-02,
2015-04-18)
Foundation item:National Key Scientific Instrument and Equipment Development Project (China) (2012YQ050250),Fundamental Research Funds of Nanjing Agricultural University (KYZ201425)
10.3964/j.issn.1000-0593(2016)05-1592-06
Received:2015-01-02; accepted:2015-04-18
Biography:WU Fang, (1974—), female, a lecturer in College of Science, Nanjing Agricultural University e-mail: wufang318@njau.edu.cn *Corresponding author e-mail: jiangxp@njau.edu.cn
猜你喜欢
环球时报(2022-08-16)2022-08-16
小猕猴智力画刊(2021年6期)2021-08-05
岩矿测试(2020年5期)2020-11-04
岩矿测试(2020年4期)2020-09-04
岩矿测试(2020年1期)2020-03-16
岩矿测试(2019年6期)2019-12-31
金色年华(2017年8期)2017-06-21
中国化肥信息(2016年41期)2016-05-17
中国民族医药杂志(2016年5期)2016-05-09
作文大王·低年级(2016年3期)2016-03-11