
Correlation Between the Body Color of YAlO3and Its Defect Equilibrium
2016-09-18 07:59LIUYongLIUTianHuiBIShuXianAnWeiLIGuoBaoTIANGuangShanJIAOHuanJINGXiPingKeyLaboratoryofMacromolecularScienceofShaanxiProvinceCollegeofChemistryandChemicalEngineeringShaanxiNormalUniversityXian7006ChinaCollegeofChemistry
无机化学学报 2016年3期
LIU YongLIU Tian-HuiBI Shu-XianAn WeiLI Guo-BaoTIAN Guang-ShanJIAO Huan*,JING Xi-Ping*,(Key Laboratory of Macromolecular Science of Shaanxi Province, College of Chemistry and Chemical Engineering,Shaanxi Normal University, Xi′an 7006, China)(College of Chemistry and Chemical Engineering, Ningxia University, Yinchuan 7500, China)(School of Physics, Peking University, Beijing, 0087, China)(State Key Laboratory of Rare Earth Materials Chemistry and Applications,College of Chemistry and Molecular Engineering, Peking University, Beijing 0087, China)
Correlation Between the Body Color of YAlO3and Its Defect Equilibrium
LIU Yong1LIU Tian-Hui1BI Shu-Xian2An Wei3LI Guo-Bao4TIAN Guang-Shan3JIAO Huan*,1JING Xi-Ping*,4
(1Key Laboratory of Macromolecular Science of Shaanxi Province, College of Chemistry and Chemical Engineering,
Shaanxi Normal University, Xi′an 710062, China)
(2College of Chemistry and Chemical Engineering, Ningxia University, Yinchuan 750021, China)
(3School of Physics, Peking University, Beijing, 100871, China)
(4State Key Laboratory of Rare Earth Materials Chemistry and Applications,
College of Chemistry and Molecular Engineering, Peking University, Beijing 100871, China)
Powder and pellet samples of YAlO3with various defect concentrations were prepared using conventional solid state reactions at 1 450℃, followed by annealing in air, O2or N2atmospheres at various temperatures. The correlation between the body-color of the samples and the defect equilibria was investigated by diffuse-reflection spectra and AC impedance data. The results indicate that YAlO3has p-type conduction and its light-brown body-color is caused by the cation vacancies. Annealing YAlO3at high temperature in N2atmosphere may reduce the defect concentration and the body-color. By the first-principle calculations, it is proposed that the Al vacancies VAl×may be the dominant defects in YAlO3.
YAlO3; body-color; cation vacancy; diffuse~reflection spectrum; AC impedance
0 Introduction
In the early studies on the defects, more attentions have been paid on the defects in alkali halides, such as sodium vacancy VNa×and chlorine vacancy VCl×[1]. Since these defects caused the colorless crystals colored, they were named as color centers (or F-centers). In fact, the defects are very important for material properties. As we know, the blue-greenish luminescence of ZnO originates from the zinc vacancy VZn″and oxygen vacancy VO··[2]and the conductivity and dielectric loss of some titanate microwave ceramics are affected by the oxygen vacancy VO··and trivalent titanium defect TiTi′[3]. In recent years, a novel material——solid electride attracted many research interests[4]. A typical solid electride material is [Ca12Al14O32]2+:[2e-], which was prepared by heating its host material Ca12Al14O33in reductive atmospheres, such as CO/CO2and in which the [2e-] plays a role as an electron anion. Actually the [2e-] anion is another expression of the electron captured in the oxygen vacancy VO×(F-center), thus this electride material can be considered as the compound with high concentration of VO×. Since VO×can contribute high concentration of loosely-bonded electrons, after reduction, this material changes from an insulator to a conductor, consequently it can be potentially used as a transparent electrode, low-temperature electron emitter, high-density optical storage[4-5]. These materials were also used as catalysts for the NH3syntheses and CO oxidation[6-7].
When previously studied the ternary phase diagram SrO-Y2O3-Al2O3in our group[8], we found that YAlO3powder prepared by high temperature reaction always showed light-brown body-color. As we know, YAlO3is composed of Y3+, Al3+and O2-, all of which have 8-electron full-shell configurations. Accordingly, this material should have a wide bandgap (Eg≈7.1 eV[9]) and should not have absorption in visible range, so that it should be a colorless crystal or white powder. Therefore, it can be deduced the body-color of this material must arise from some defects. In this study, we attempt to know what defects cause the body-color in this material and how the body-color can be adjusted. Furthermore whether it is possibly to modify YAlO3as a material with high defect concentration, so that we can obtain another electride. On the other hand, YAlO3is a host material of a laser crystal. Some researches have been reported on growing single crystals of YAlO3[10-13]It was found that the grown crystals also had light-brown body-color, which caused the crystal quality detriment. When the crystals were annealed in reductive atmospheres, their body-color was reduced. However, in the previously reported work, the mechanism of the body-color production was not properly discussed. If we could understand the generating mechanism of the bodycolor and find ways to reduce it, we would improve the quality of the crystal.
The YAlO3powder samples were prepared by solid state reactions at high temperature. X-ray diffraction indicated that besides a few percent of impurity phase Y4Al2O9, the main phase in the samples was the expected YAlO3, which showed lightbrown body-color. The absorption spectra and conduction properties of the samples were characterized, and the formation energies of possible defects were calculated by the first-principle calculations. By analyzing the above data, it is indicated that the main defects in YAlO3are probably cation vacancies VAl×, which cause its light-brown body-color and the p-type conduction.
1 Experimental and calculations
1.1Sample preparation
Y2O3(99.99 %) and γ-Al2O3 (luminescent pure) were used as raw materials. The raw materials in 1∶1 molar ratio were weighed and thoroughly ground in an agate mortar with pestle. In order to get homogeneous powder mixtures, a few drops of ethanol were added during the grindings. After grindings, the powder mixture samples were put in alumina crucibles, and calcined at 1 450℃for 12 h in a muffle furnace. Intermediate grindings were applied during the calcination for improving the phase purity of the samples. After calcination, the samples were groundinto powders.
For conductivity measurements, sintered pellet samples were prepared. The powder samples were mixed with a few drops of 5%(w/w) polyvinyl alcohol solution as a binder, and then they were pressed into pellets with 10 MPa pressure in a stainless steel die. Finally, the as-pressed pellets were sintered at 1 450℃for 12 h. The obtained sintered pellets had the dimension~1.3 cm in diameter and~0.2 cm in thickness with relative density~88%. To investigate the influences of atmospheres to the body-color and the profile of the reflection spectrum, the powder samples were annealed in a tube furnace with O2, air and N2atmospheres, respectively, at 700℃or 1 450℃for 4 h.
1.2Characterizations
The phase purity of samples were determined by X-ray diffraction (XRD) using a Rigaku Dmax2000 X-ray powder diffractometer (Japan) with Cu Kα radiation (λ=0.154 18 nm) at 40 kV and 100 mA. The XRD patterns were collected in the 2θ range 10°~60°with the scanning rate 8°·min-1.
The diffusive reflection spectra were measured by using an ultraviolet-visible-near infrared(UV-Vis-NIR) spectrophotometer (Shimadzu UV-3100, Japan) in the range 240~1 000 nm and the BaSO4powder was used as reference.
The electrical properties of the samples were characterized by AC impedance spectroscopy using a Wayne Kerr-6500B impedance analyzer (Wayne kerr electronics Ltd, UK) in the frequency range 1 Hz to 107Hz and the temperature range 200~800℃with the temperature interval 20℃/waiting time 20 min for each temperature point. Prior to the measurements, the Pt electrodes on the two opposite surfaces of the pellet samples were prepared by coating platinum paste with two Pt wires followed by heating at 800℃for 10 min to burn off the organic components in the paste. The measured AC impedance data were analyzed using the Zview software[14].
1.3First principle calculations
To acquire the defect formation energy, the energies (EL) of the ideal structure of YAlO3and the structures with various defects were calculated using CASTEP (Cambridge Serial Total Energy Package, Accelrys Inc.) in Materials Studio 5.0[15]. The defect formation energy (EV) is the energy difference (EL) between the defective and the ideal structures. In these calculations, the density functional theory(DFT) with local-density approximation (LDA) was employed and the wave functions of valence electrons were expanded in an ultrasoft pseudopotential plane-wave basis sets with the specific cut-off energy Ecut. For the calculations, a 2×2×2 supercell (160 atoms) was chosen according to the ICSD file 99419. The initial supercell are a*=2a=1.036 05 nm, b*=2b=1.065 90 nm and c*=2c=1.474 12 nm. Based on this supercell structure, the two defective structure modes were built by removing out one Y atom near the center in the supercell for VY×and one Al atom for VAl×, respectively. Before the energy calculations, the geometry optimization for each mode was performed with Broyden-Fletcher-Goldfarb-Shannon(BFGS) alogrithm[16]. Both Ecutand k-point mesh were tested and set as 260 eV and 3×3×2 Monkhorst-Pack grid, respectively, which are enough for energy convergence. The modes were converged when the force on each atom was less than 1 eV·nm-1with a maximum displacement of 0.000 5 nm and a convergence in the total energy of about 5×10⁻⁵eV· atom-1.
2 Results and discussion
2.1Phase analysis
The prepared YAlO3powder samples had lightbrown body-color. The XRD pattern of YAlO3is shown in Fig.1. The pattern is in accordance with JCPDS file 33-41, except for two weak peaks appearing at 2θ=29.18°and 31.26°, which are from the impurity phase Y4Al2O9(JCPDS file 14-0475). YAlO3has orthorhombic unit cell and the cell parameter calculated from the pattern in Figure 1 are as follows: a=0.518 8(1) nm, b=0.525 5(1) nm and c= 0.738 5(1) nm. The material had a twisted perovskite structure with the space group Pbnm (No.62), which contains one Y site and one Al site (ICSD file 99419,shown in Fig.2). In fact it was quite hard to obtain pure-phase YAlO3samples. Various preparation conditions were tested, such as modifying raw material ratio Y2O3∶Al2O3, as well as enhancing the heating temperature and prolonging the heating time, the two weak XRD peaks of Y4Al2O9did not disappear. For comparison, a pure phase sample of Y4Al2O9was prepared by heating Y2O3and Al2O3mixture with the Y2O3∶Al2O3ratio 2∶1 at 1 100℃for 12 h. The XRD pattern of the prepared sample is in accordance with the JCPDS file 14-0475 and the body-color of the sample is white, thus we believe that the light-brown color of the prepared YAlO3sample is caused by YAlO3itself rather than Y4Al2O9and small amount of impurity phase Y4Al2O9may not seriously affect our results.
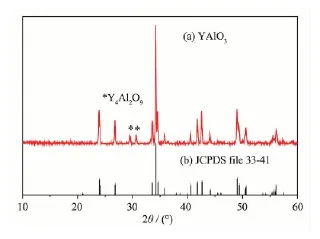
Fig.1 XRD patterns of as-prepared YAlO3(a) and JCPDS file 33-41 (b)
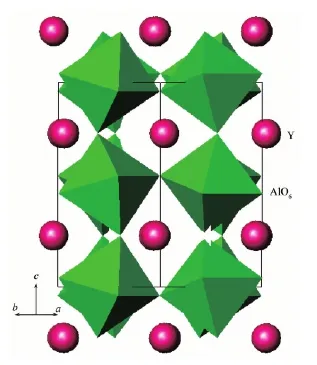
Fig.2 YAlO3perovskite structure
2.2Diffusive reflection spectra
Fig.3 illustrates the diffusive reflection spectra of the YAlO3samples annealed in various atmospheres at 700℃or 1 450℃. All the samples have absorption in the visible range 400~800 nm. The absorption in the blue range (e.g.~450 nm) is stronger than that in the red range(e.g.~650 nm), as the result, the samples shows light-brown body-color. The samples annealed in air and O2have much stronger absorptions(showing deeper body-color) than the samples annealed in N2(showing lighter body-color), these imply that the body color of YAlO3is caused by some defects, which can be adjusted by atmospheres. According to the correlation between the body-color and the atmospheres, it can be deduced that the defects should be anion excess defects, e.g. interstitial oxygen Oior cation vacancies VM×(VY×or VAl×). The defect equilibria can be represented as the following reactions:
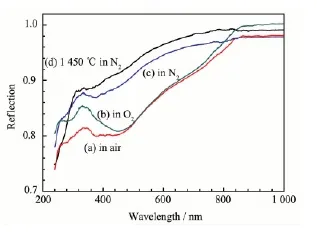
Fig.3 Diffusive reflection spectra of the YAlO3samples annealed in air(a), O2(b) and N2(c) at 700℃and annealed in N2at 1 450℃(d)
When the electron transitions occur from valence band to the defects Oi×and VM×, they may be changed to Oi"and VM′and the electron holes h·are produced in the valence band. VM′may be further ionized to VM″and VM″′, and more h·are produced. In these processes,visible lights are absorbed by the material and the body-color appears. It is known that the YAlO3perovskite structure is stacked by the closely packed YO3layers in the cubic close packing sequence and the Al atoms are located at the octahedral interstitial sites constructed solely by the O atoms. In this kind of the structure, probably there is no space to accommodate Oi, so that we believe the main defects in YAlO3should be cation vacancies.

Table 1 Optimized energies(EL) of the unit cells and the defect formation energies(EV)
Further we have a discussion about which cation vacancy, VY×or VAl×is the dominant defect. Fig.4 schematically represents the formation of a cation vacancy. In the atmosphere with high O2partial pressure, O2can be decomposed into O atoms and absorbed on the surface of the material, e.g. bonded to the Y atoms (two a atoms). At the same time, a cation vacancy V forms on the surface. Due to the thermal diffusion, both the Y atom and Al atom can jump from their own sites to the surface vacancy V and the cation vacancy may diffuse into the lattice. Here we use the ionic potential Z/r to evaluate the attracting strength of a cation to its surrounding oxygen atoms(Z is the valence and r is the radius of the cation). The larger the Z/r ratio, the stronger the attracting strength is. As we know, rY3+=0.090 nm(CN=6), rAl3+
=0.053 5 nm (CN=6)[17], as the results, the Z/r ratio for Y3+(3.33) is less than that for Al3+(5.61). This implies that Y3+is easier to jump into the V site than Al3+, thus it seems that VY×is the dominant defect. However, the defect formation energy EVof VY×and VAl×, calculated by the first-principle calculations, gives different result. ELrepresents the optimized energies for different structural modes, including ideal supercell and the supercell with various cation defects. The defect formation energy EVis the difference of ELbetween the defective cell and the ideal cell. For the calculation, 2×2×2 supercell was used and the results are shown in Table 1. The data indicate that VAl×has much lower EVthan VY×, thus VAl×should be the dominant defect. As we know, Y3+has much larger size than Al3+, and the VY×formation may cause larger lattice distortion and enhance the lattice energy, thus the first-principle calculation indicates that VAl×is the main defect in YAlO3.

Fig.4 Schematic diagram for the defect formation
In the higher O2partial pressure (e.g. in O2atmosphere), Equilibria(3) and(4) shift to right, so that the concentration of VAl×increases and the body-color become deeper; while in N2atmosphere, the O2partial pressure is low, Equilibria (3) and (4) shift to left, consequently the concentration of VAl×decreases and the body-color become lighter. Equilibria (3) and(4) also show during the formation of VAl×, gaseous O2is changed to solidus O2-, which can be considered as an oxidezing reaction, thus probably it is an exothermal process (the enthalpy decreases,ΔH<0) with the reduction of entropy (ΔS<0). According to the Gibbs free energy equation ΔG=ΔH-TΔS, in order to reduce the concentration of VAl×in YAlO3, i.e. to push Equilibrium(3) and(4) shift to left, besides annealing in N2atmo-sphere, enhancing the annealing temperature is also helpful. Therefore the sample annealed in N2at 1 450℃has weaker absorption (Fig.3(d)) than other samples.
In order to obtain energy levels of the defects inYAlO3, we further analyzed the reflection spectrum of the sample annealed in O2at 700℃, which has higher defect concentration. The spectrum is represented as the Absorption-hν form (Fig.5), (h is Planck constant, and ν is the frequency of light ). In the range 1.0 eV to 5.0 eV, three absorption peaks are observed, which correspond to three levels of the defects. The values of the energy levels were taken from the lower absorption edges of the corresponding absorption bands: 1.4, 1.6 and 2.6 eV. Yet at this stage we can not give exact assignments to these three levels, maybe they are related to the electron transitions from valence band to different ionized states of the Al vacancies: VAl×, VAl′and VAl″. The spectrum also shows the absorption above 5 eV, but we could not give further interpretation about this absorption because it is near the limit of the measurement. The Ref. [9] indicates the bandgap of YAlO3is about 7.1 eV, thus this absorption is not related to the band transition. Based on the above discussions, the band structure with the defect levels is illustrated in Fig.6.

Fig.5 Reflection spectrum in the Absorption-hν form for the YAlO3sample annealed in O2atmosphere at 700℃
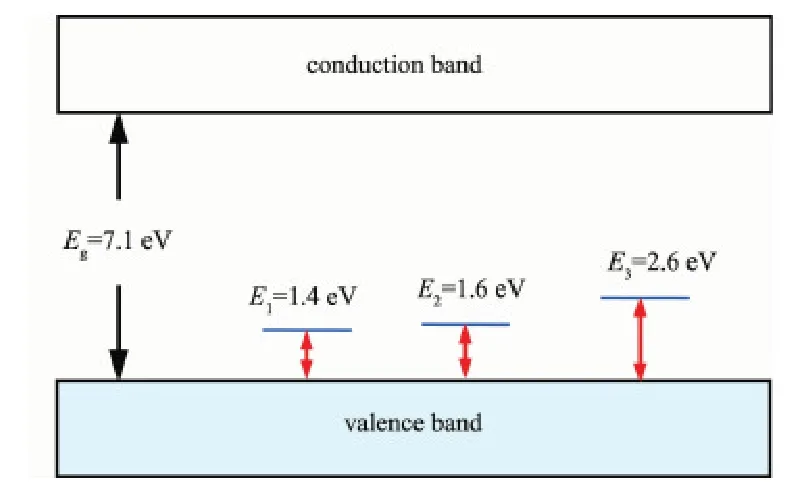
Fig.6 Band structure with defect levels of YAlO3
Fig.6 shows that the bandgap of YAlO3is large, Eg=7.1 eV[9], thus the band transition may cause absorption in the vacuum ultraviolet (VUV) range, rather than in the visible range, which cannot lead to body-color appearance.
The cation vacancies produce three levels in the bandgap (although we can not give exact assignments for these levels at this stage). The electron transitions from the valence band to these levels (i.e. the electrons are captured at these levels from the valence band and the holes are produced in the valence band) cause absorptions in the visible to near infrared(near-IR) range, which may result in the body-color. The body-color of YAlO3has been previously reported by some authors, but they did not give clear explanation about this phenomenon[10-13]. We believe our above interpretation about the body-color of YAlO3is reasonable.
2.3AC impedance analysis
It is mentioned above that the electron transitions from the valence band to the defect levels may cause the body-color of YAlO3. On the other hand, these transitions also produce the holes in the valence band, resulting in p-type conductions, thus it is an effective way to analyze the defects by characterizing the conductance properties of the materials. In this work, the electrical conductivity of YAlO3was measured at various temperatures and in various atmospheres by AC impedance spectroscopy.

Fig.7 Typical AC impedance spectrum (Z″-Z′plot) of YAlO3at 560℃
Fig.7 shows the typical Z″/Z′plot of YAlO3(at560℃) and the simplified equivalent circuit. The large semicircle has the capacitivity 3.28×10⁻¹¹F· cm-1, which is assigned as the grain boundary response, and the grain boundary resistivity (Rgb) can be extracted from the intercept of the grain boundary semicircle on the Z′axis. The grain boundary resistivity is much larger than the grain resistivity, thus the grain response is merged in the grain boundary response, and it can only be observed by enlarging the high frequency plot. The grain semicircle is not well resolved and the approximate value of the grain resistivity can be taken, as is shown, by the arrow in the inset.[18]The values of the grain resistivity at other temperatures were attracted by using the similar method.

Fig.8 Arrhenius plots of the conductivity for YAlO3in the heating-cooling cycle
Fig.8 illustrates the Arrhenius plots of the conductivity for YAlO3in the heating-cooling cycle. At high temperatures (above 580℃), the defect reactions (3) and (4) are easier to approach to equilibrium. Whether in the heating or in the cooling process, at a certain temperature, the material has the same defect concentration, thus conductivities for both heating and cooling processes are almost identical. While at low temperatures (below 560℃), in the heating process since the YAlO3sample was previously quenched from 1 100℃, the defects formed during high temperature heating(i.e. 1 100℃) was“frozen”in the lattice at low temperatures(i.e. Equilibrium(3) was“frozen”). As the discussion in the 3.2 section, the defect reaction (3) is the entropy reducing process, thus the defect concentration of the sample quenched from high temperature is lower than that of the sample annealed in slow cooling process. Therefore, the conductivities in the heating process is lower than that in cooling process. Theoretically although the conductivities for the heating and cooling processes are different, their slopes in the Arrhenius plots should be identical. However, Fig.8 shows that the slopes of the plots at low temperatures are slightly different, possibly because at low temperatures, Equilibrium(3) is not completely“frozen”.
By the Arrhenius plots, the activation energies for both low (Ea(1)) and high (Ea(2)) temperature ranges were calculated shown in Fig.8 (the data are the average values for the heating and cooling processes). Ea(1)corresponds to the hole formation (Equilibrium(4), electron transition from the valence band to VAl×). Ea(2)corresponds to the two processes: the VAl×formation (correlated to Equilibrium(3) with the enthalpy change of ΔH) and the hole formation (correlated to Ea(1)), thus we have Ea(2)=ΔH+Ea(1). Ea(1)(≈1.52 eV) is very close to E1(≈1.4 eV), indicating that the AC impedance data agree with the optical data well. Based on the above discussions, the enthalpy change of Equilibrium (3) can be calculated:ΔH=0.52 eV[Ea(2)]-1.52 eV[Ea(1)]= -1.00 eV=-96 kJ·mol-1.

Fig.9 Variation of the bulk conductivity σ(at 720℃) with annealing time in atmospheres switched in the sequence: N2→O2
For further understanding the defect equilibrium, the conductivity variation of YAlO3with atmospheres was investigated. The measurements were conductedat 720℃and the data are represented in Fig.9. In N2atmosphere, the conductivity decreases rapidly in the first 75 min, and then it is almost constant in the following hours. Whereas when the atmosphere is switched to O2, the conductivity increases rapidly. The data in Fig.9 further support that Equilibria (3) and(4) controls the defect concentration and the conductivity of YAlO3.
Above results indicates that the defects in YAlO3are cation vacnacies, showing p-type conduction, thus this material is difficut to be modified to an electride as [Ca12Al14O32]2+:[2e-], which has n-type conduction. In fact, the conductivity of YAlO3is not high: at 600℃, its buck conductivity is only about 1.1×10⁻⁴Ω-1·cm-1, much lower than that of [Ca12Al14O32]2+:[2e-](102Ω-1· cm-1at room temperature).
3 Conclusions
The YAlO3samples with various defect concentrations were prepared by the solid state reactions at 1 450℃, followed by annealing in various atmospheres and at various temperatures. The defect levels and the defect equilibria were analyzed by the reflection spectra and AC impedance data. The results indicate that the light-brown body-color of YAlO3is caused by cation vacancies and the material has p-type conduction. The first-principle calculations show that the Al vacancies VAl×may be the domonent defect in YAlO3, which may cause less lattice distortion. Annealing YAlO3in N2at high temperature may reduce the VAl×concentration and the body-color, which may supply a method to improve the quality of the YAlO3crystals.
References:
[1] Mott N F, Gurney R W. Electronic Processes in Ionic Crystals. 2nd Ed. Oxford: Clarendon Press, 1948.
[2] Liu Z S, Jing X P, Wang L X, et al. J. Electrochem. Soc., 2006,153(12):G1035-G1038
[3] Zhu H, Kuang X J, Jing X P, et al. Jpn. J. Appl. Phys., 2011,50:065806
[4] Matsuishi S, Toda Y, Hosono H, et al. Science, 2003,301: 626-629
[5] Kim S W, Shimoyama T, Hosono H, et al. Science, 2011, 333:71-74
[6] Inoue Y, Kitano M, Hosono H, et al. ACS Catal., 2014,4: 674-680
[7] Sharif M J, Kitano M, Hosono H, et al. J. Phys. Chem. C, 2015,119:11725-11731
[8] Wang C H, Lin J H, Jing X P, et al. J. Solid State Chem., 2012,192:195-200
[9] Tomiki T, Kaminao M, Fukudome F, et al. J. Phys. Soc. Jpn., 1991,60(5):1799-1813
[10]LI Tao(李涛), ZHAO Guang-Jun(赵广军), PAN Shou-Kui(潘守夔), et al. J. Synth. Cryst.(人工晶体学报), 2002,31(5): 456-459
[11]Weber M J, Bass M, Comperchio E, et al. Appl. Phys. Lett., 1969,15:342-345
[12]Bernhardt H J. Phys. Stattus Solidi A, 1974,21:95-98
[13]Chen J Y, Zhao G J, Cao D H, et al. Current Appl. Phys., 2010,10:468-470
[14]Zview for Windows, Impedance/Gain Phase Graphing and Analysis Software, Version 1.4b, Scribner Associates Inc., Char-lottesville,Virginia, 1996.
[15]Clark S J, Segall M D, Payne M C, et al. Z. Kristallogr., 2005,220:567-570
[16]Pfrommer B G, Louie S G, Cohen M L. J. Comput. Phys., 1997,131:233-240
[17]Shannon R D. Acta Crystallogr., 1976,A32:751-767
[18]Irvin J T S, Sinclair D C, West A R. Adv. Mater., 1990,2(3): 132-138
YAlO3的体色与缺陷平衡的关系
刘勇1刘天慧1毕淑娴2安炜3李国宝4田光善3焦桓*,1荆西平*,4
(1陕西省大分子科学重点实验室,陕西师范大学化学与化工学院,西安710062)
(2宁夏大学化学化工学院,银川750021)
(3北京大学物理学院,北京100871)
(4稀土材料化学与应用国家重点实验室,北京大学化学与分子工程学院,北京100871)
利用固相扩散法在1 450℃下制备了YAlO3粉末样品和陶瓷片样品,并在不同温度和不同气氛(air, O2or N2)下对样品进行退火处理调制了其缺陷浓度。基于漫反射光谱和交流阻抗谱分析了YAlO3样品的体色与其缺陷浓度之间的关系。研究结果表明YAlO3具有p型导电机理,其浅棕色体色是由阳离子空位引起的。在高温和氮气氛下处理该材料其缺陷浓度减少,体色变浅。第一性原理计算结果认为YAlO3中的主要缺陷应该是铝空位VAl×。
YAlO3;体色;阳离子空位;漫反射光谱;交流阻抗谱。
O614.51+1
A
1001-4861(2016)03-0491-08
10.11862/CJIC.2016.051
2015-07-24。收修改稿日期:2015-12-15。
国家自然科学基金(No.21371015)资助项目。
*通信联系人。E-mail:jiaohuan@snnu.edu.cn, xpjing@pku.edu.cn;会员登记号:S06N3161M1407。
猜你喜欢
科学养鱼(2022年9期)2022-10-18
化工职业技术教育(2021年5期)2021-11-09
化工职业技术教育(2021年1期)2021-03-15
化工职业技术教育(2020年4期)2020-01-19
陶瓷学报(2019年5期)2019-01-12
江苏农业科学(2016年5期)2016-07-23
化工学报(2016年3期)2016-03-14
热带农业科学(2014年8期)2014-09-23
读者欣赏(2014年6期)2014-07-03
少儿科学周刊·儿童版(2014年1期)2014-03-10
