
Estimation of the surface heat budget over the South China Sea
2016-11-23 02:37FENGBoXinLIUHiLongLINPengFeindWANGQi
FENG Bo-Xin, LIU Hi-Long, LIN Peng-Feind WANG Qi
aCollege of Physical and Environmental Oceanography, Ocean University of China, Qingdao, China;bState Key Laboratory of Numerical Modeling for Atmospheric Sciences and Geophysical Fluid Dynamics (LASG), Institute of Atmospheric Physics, Chinese Academy of Sciences, Beijing, China
Estimation of the surface heat budget over the South China Sea
FENG Bao-Xina, LIU Hai-Longb, LIN Peng-Feiband WANG Qia
aCollege of Physical and Environmental Oceanography, Ocean University of China, Qingdao, China;bState Key Laboratory of Numerical Modeling for Atmospheric Sciences and Geophysical Fluid Dynamics (LASG), Institute of Atmospheric Physics, Chinese Academy of Sciences, Beijing, China
In situ data are employed to evaluate fve gridded surface heat fux datasets over the South China Sea. The surface heat budgets for these gridded datasets are computed. The authors fnd that the gridded datasets tend to underestimate both the solar radiation and sensible heat fux in general,while the latent heat fuxes are close to the observations, except for that of NOC unadjusted version 2 (NOC2), which overestimates both the latent and sensible heat fux. The underestimation of solar radiation also indicates that the gridded datasets might underestimate the surface heat budget. The net surface heat fux of the fve gridded datasets is always positive. However, the net surface heat fux of COADS, NOC1, NOC2, and OAFlux, in the range 48—56 W m-2, is around twofold more than that of NOC1a (22 W m-2). The budget for NOC2 is smaller than that of NOC1 and OAFlux, by approximately 49 W m-2, because of the large release of latent heat fux. Based on the comparison,the authors believe that the net surface heat fux over the South China Sea should be higher than 56 W m-2, which is signifcantly larger (around 10%—20%) than previous estimations.
ARTICLE HISTORY
Revised 1 February 2016
Accepted 4 February 2016
Shortwave radiation; net
heat fux; heat budget; South China Sea
本文运用了南海观测资料去评估五个海表热通量格点资料,同时,也计算了这五种格点资料的海表热收支平衡。结果发现这些格点资料都低估了短波辐射和感热通量,但是潜热通量除了NOC2外都相对接近观测值。低估了短波辐射也表明了这些格点资料可能低估了海表热收支。五种格点资料的净热通量都是正值,表明海洋从大气中获得热量。综合比较来看的话,NOC1资料所得的海表热通量收支可能更接近于观测值,更合理。
1. Introduction
The South China Sea (SCS) is the largest marginal sea in the northwestern Pacifc. It connects with the East China Sea through the shallow Taiwan Strait and with the Pacifc Ocean through the deep Luzon Strait in the northeastern part, and also with the Sulu and Java seas through the shallow Mindoro and Karimata straits in the south, respectively. Since the SCS is located in the tropics, south of the Tropic of Cancer, it receives heat from the atmosphere on average over the basin, and is balanced by the ocean heat transport through the straits (Qu, Du, and Sasaki 2006). Owing to insufcient observational data to estimate the heat transport through the straits, the surface heat budgets become an important proxy of the heat transports. Recently, Qu,Song, and Yamagata (2009) estimated the area-averaged net surface heat fux (Qnet, hereafter) over the SCS by using both OAFlux (Yu and Weller 2007) and COADS (Oberhuber 1988) data. The value from OAFlux (49 W m-2) was twice as high as that from COADS (23 W m-2). Zeng et al. (2009)used seven satellite-derived latent heat fux products to compare with moored buoy data and concluded that all of the products did not compare well to the in situ data. All of these studies suggest that there are large uncertainties in the estimation of the surface heat budget in this region(Zeng et al. 2009), meaning further investigation is needed.
In the last 20 years, much efort has been made to produce global gridded surface heat fux datasets, and these datasets are extensively used in climate studies. They can usually be grouped into three categories: satellite-based datasets (Schulz et al. 1997; Kubota et al. 2002; Chou et al. 2003), atmosphere datasets (Kalnay et al. 1996; Gibson and Harper 1997; Uppala et al. 2005), and reconstructed datasets (Da Silva, Young, and Levitus 1994; Josey, Kent,and Taylor 1998; Large and Yeager 2008; Yu, Jin, and Weller 2008; Berry and Kent 2009). Ocean reanalysis datasets (Ji,Leetmaa, and Derber 1995; Behringer and Xue 2004; Carton and Giese 2008) come from operational system assimilated observations. Since surface fux data from atmospheric reanalysis may contain large biases on regional scales, the second of the above-listed data-set types is seldom usedin surface heat budget studies. Therefore, here, we only employ the third category.
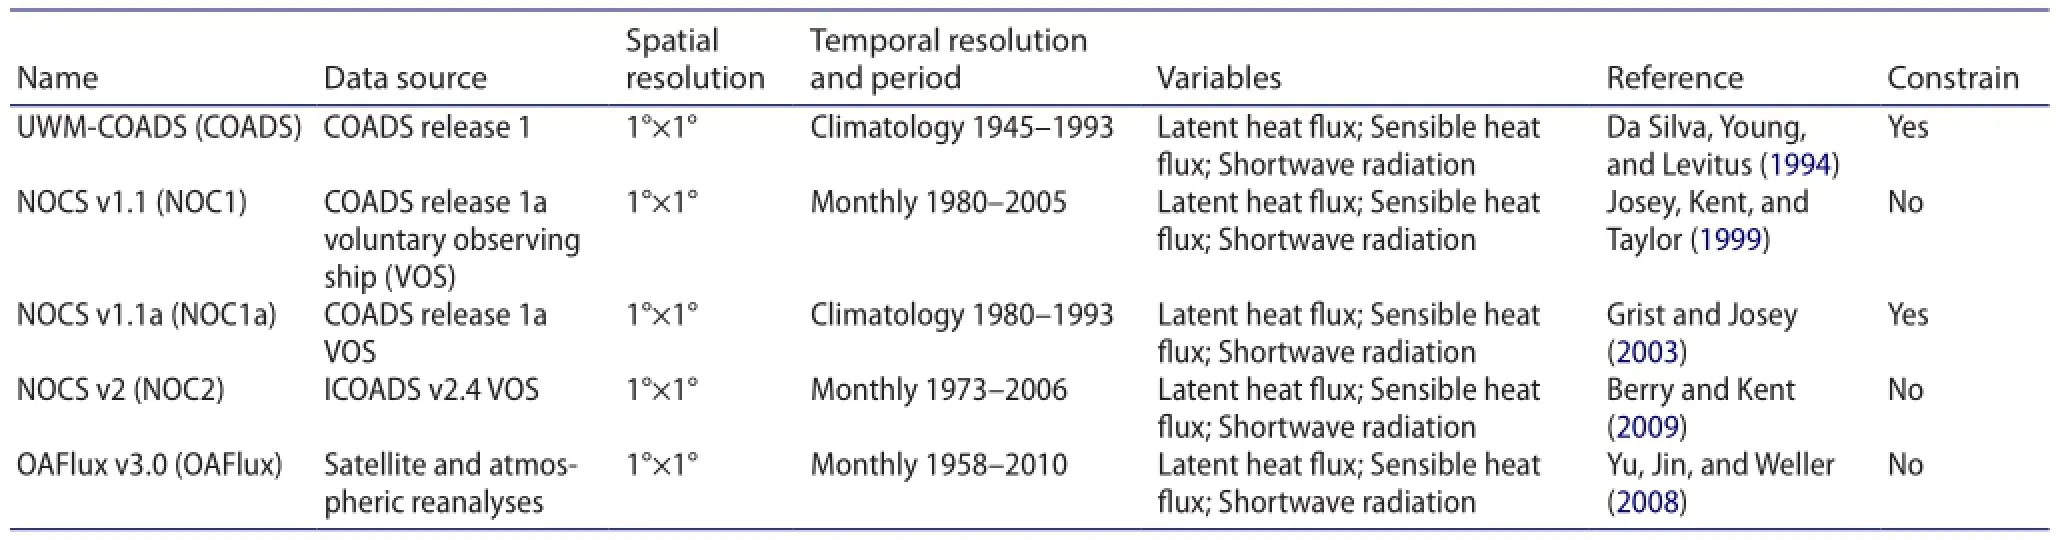
Table 1.Details of the fve global gridded surface heat fux datasets.
The purpose of this study is to evaluate gridded surface heat fux products in the SCS by using in situ observations from buoys and research vessels. The observational references of the surface heat budget over the SCS are also provided. The paper is organized as follows: Section 2 describes the data used, including the fve gridded datasets of surface heat fuxes and in situ observations. Section 3 presents a comparison and evaluation of the diferent gridded datasets and in situ observations. Section 4 summarizes the key fndings.
2. Datasets
2.1. Gridded datasets
The gridded surface heat flux datasets used in this study are listed in Table 1. Two datasets, COADS and NOC adjusted version 1.1a (NOC1a), have included adjustments to the atmosphere-based surface fluxes by imposing some broad constraints of the oceanic heat transport. However, only the Qnethas been adjusted for COADS. We show both the original and constrained values for COADS in the following. Generally, we consider NOC unadjusted version 1.1 (NOC1) (Josey, Kent, and Taylor 1999), NOC1a (Grist and Josey 2003) and NOC unadjusted version 2 (NOC2) (Berry and Kent 2009) as three separate datasets. The three NOC datasets and COADS product (Da Silva, Young, and Levitus 1994) are all based on ship measurements of surface winds and clouds. However, OAFlux version 3 (Yu, Jin, and Weller 2008) uses surface winds from a combination of satellite measurements and reanalysis data to calculate the latent and sensible heat fluxes. This data-set does not contain independently derived radiative fluxes, but surface radiation from ISCCP (Zhang et al. 2004) is included in that release. The Qnetreferred to as OAFlux in this study is a combination of the objectively analyzed turbulent heat fluxes and the ISCCP radiative fluxes.
The fve gridded surface heat fux datasets have diferences in their data sources and temporal resolutions, but the spatial resolutions are the same. They cover diferent periods of time. NOC1a is only a climatology, but the other four are monthly datasets. The fve surface fux datasets also use diferent formulas to calculate the surface turbulent fuxes.
2.2. In situ data

Figure 1.The positions of the in situ datasets in the SCS.
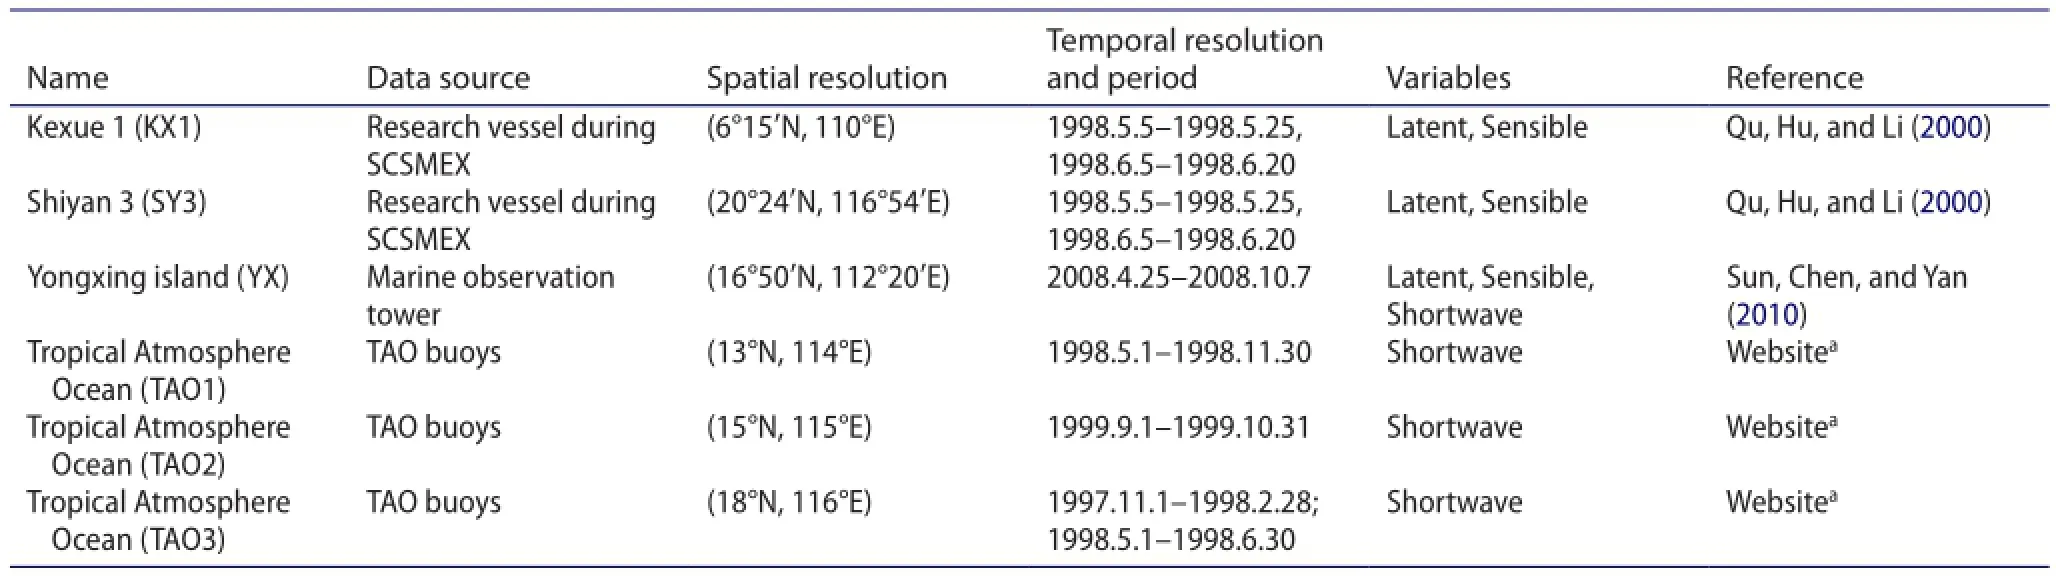
Table 2.Details of the in situ surface heat fux datasets.
The in situ datasets used in this paper are listed in Table 2. We use the turbulent fuxes (both latent and sensible fuxes) from the air—sea fux tower at Yongxing Island (YX)in 2008, and the turbulent fuxes computed by atmospheric and oceanic data collected by the research vessels‘ShiYan 3' (SY3) and ‘KeXue 1' (KX1) during the intensive observation period of SCSMEX in 1998. The algorithm used to calculate the turbulent heat fux for YX is COARE 3.0 (Fairall et al. 2003), while that for both SY3 and KX1 is the bulk air—sea fux formula in terms of wind speed and stratifcation of the atmosphere (Kondo 1975). We also use shortwave radiation data from three Tropical Atmosphere Ocean (TAO) buoys employed during SCSMEX. The buoys were located at (13°N, 114°E), (15°N, 115°E) and (18°N,116°E), and are referred to as TAO 1, TAO 2, and TAO 3,respectively. We regard these turbulent and shortwave radiation fuxes as the in situ datasets. The locations of these datasets are shown in Figure 1.
3. Results
Since the gridded datasets are all monthly means, we also use the monthly mean values of in situ data to carry out the comparison. Figure 2 is a scatter plot between the in situ and gridded data for the shortwave radiation, and the latent and sensible heat fuxes (we defne the ocean gaining heat from the atmosphere as positive, and vice versa as negative). The whole period—averaged values of the in situ data are listed in Table 3. The diferent marks stand for diferent gridded datasets. The points below (above) the diagonal mean the gridded data are smaller (larger) than the in situ data. Because the latent and sensible heat fuxes are negative, the points below (above) the diagonal mean the absolute values of the gridded data are larger (smaller)than the in situ data.
In general, the gridded shortwave radiation fuxes are slightly smaller than the in situ observations. There are more points below the diagonal (Figure 2(a)). The ensemble mean for the in situ data is 227 W m-2, while it is only 216 W m-2for the gridded data (Table 3). However, it is clear that there are more marks for NOC2 located above the diagonal. The mean value for NOC2, 224 W m-2, is close to the in situ data, and COADS and NOC1 are a little smaller—better than NOC1a and OAFlux.
The latent heat fux is another dominant component of the Qnet. It is apparent that the points are almost evenly distributed around the diagonal (Figure 2(b)), meaning the gridded data are close to the in situ observations. The ensemble mean for the in situ and gridded data is -98 W m-2and -100 W m-2, respectively (Table 3). However,the latent fuxes for NOC2 deviate the most from the in situ data, which is consistent with the fnding of Zeng et al.(2009) that ICOADS possesses moderate systematic errors with respect to in situ data. The mean value is -120 W m-2(Table 3)—about 20 W m-2larger than the ensemble mean and the observational data, meaning there is much more latent heat fux released from the ocean in NOC2. However,the mean value of NOC1, approximately -94 W m-2, is close to the in situ observations.
The absolute value of sensible heat fux (<10 W m-2)is much smaller than that of the shortwave radiation and latent heat fuxes. Figure 2(c) shows that almost all the gridded datasets are above the diagonal, except for NOC2, meaning the gridded data tend to underestimate the release of sensible heat and NOC2 tends to overestimate it. The mean values in Table 3 also confrm the results: -8 W m-2for the in situ data and -5 W m-2for all of the gridded data, except -9 W m-2for NOC2.
Based on the above comparison, the gridded datasets generally tend to underestimate both the solar radiation and the sensible heat fux, while the latent heat fuxes are close to the observations. NOC2, which is diferent from the other datasets, overestimates the turbulent heat fuxes—both the latent and sensible heat fuxes. We compute the sum of shortwave radiation and latent heat fux at YX (Table 3). Because these two terms dominate the surface heat budget, this value can explain most of the heat budget. We can see that the values for both NOC1a(121 W m-2) and NOC2 (105 W m-2) are remarkably lower than the observation (152 W m-2) and the other three datasets. The former (NOC1a) is due to the underestimated shortwave radiation, and the latter (NOC2) to the overestimated latent heat. Among the other three datasets, the sum for OAFlux is also about 10—15 W m-2larger than theother two datasets, COADS and NOC1. That is, the heat budget for COADS and NOC1 may be more reasonable than the other datasets.
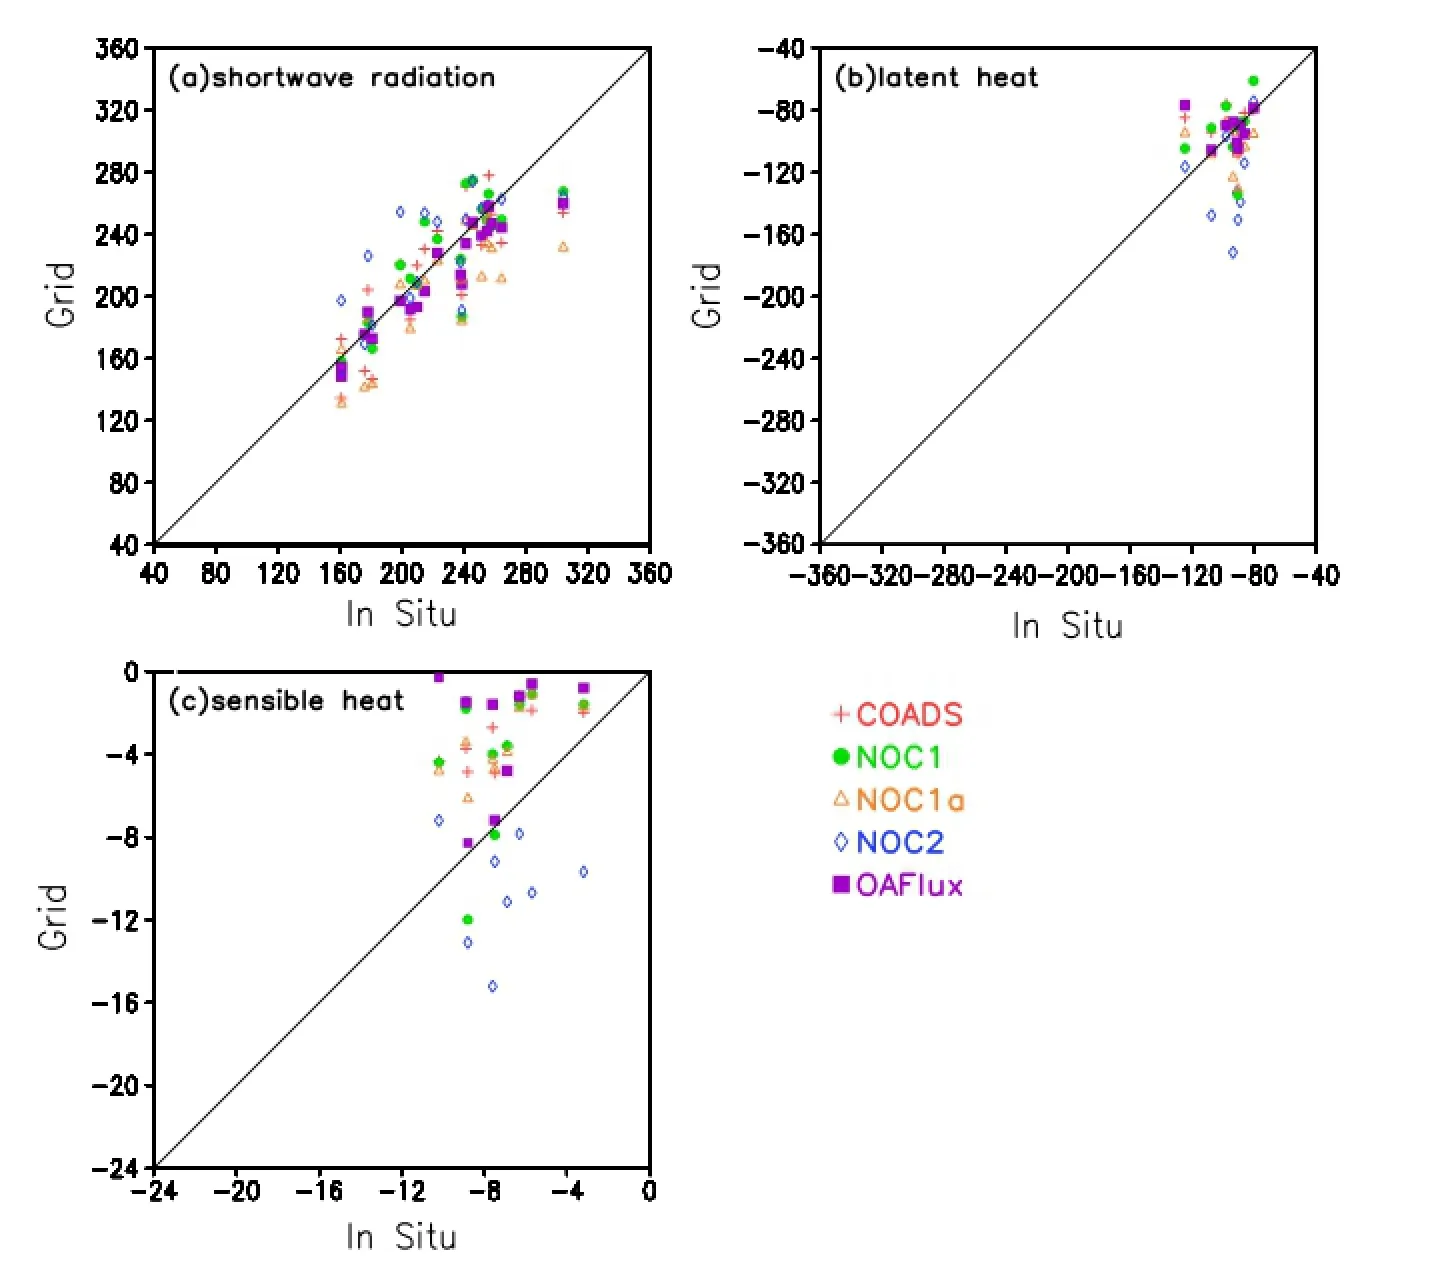
Figure 2.Scatter diagrams of (a) shortwave radiation, (b) latent heat fux, and (c) sensible heat fux, between the in situ (x-axis) and gridded (y-axis) datasets.
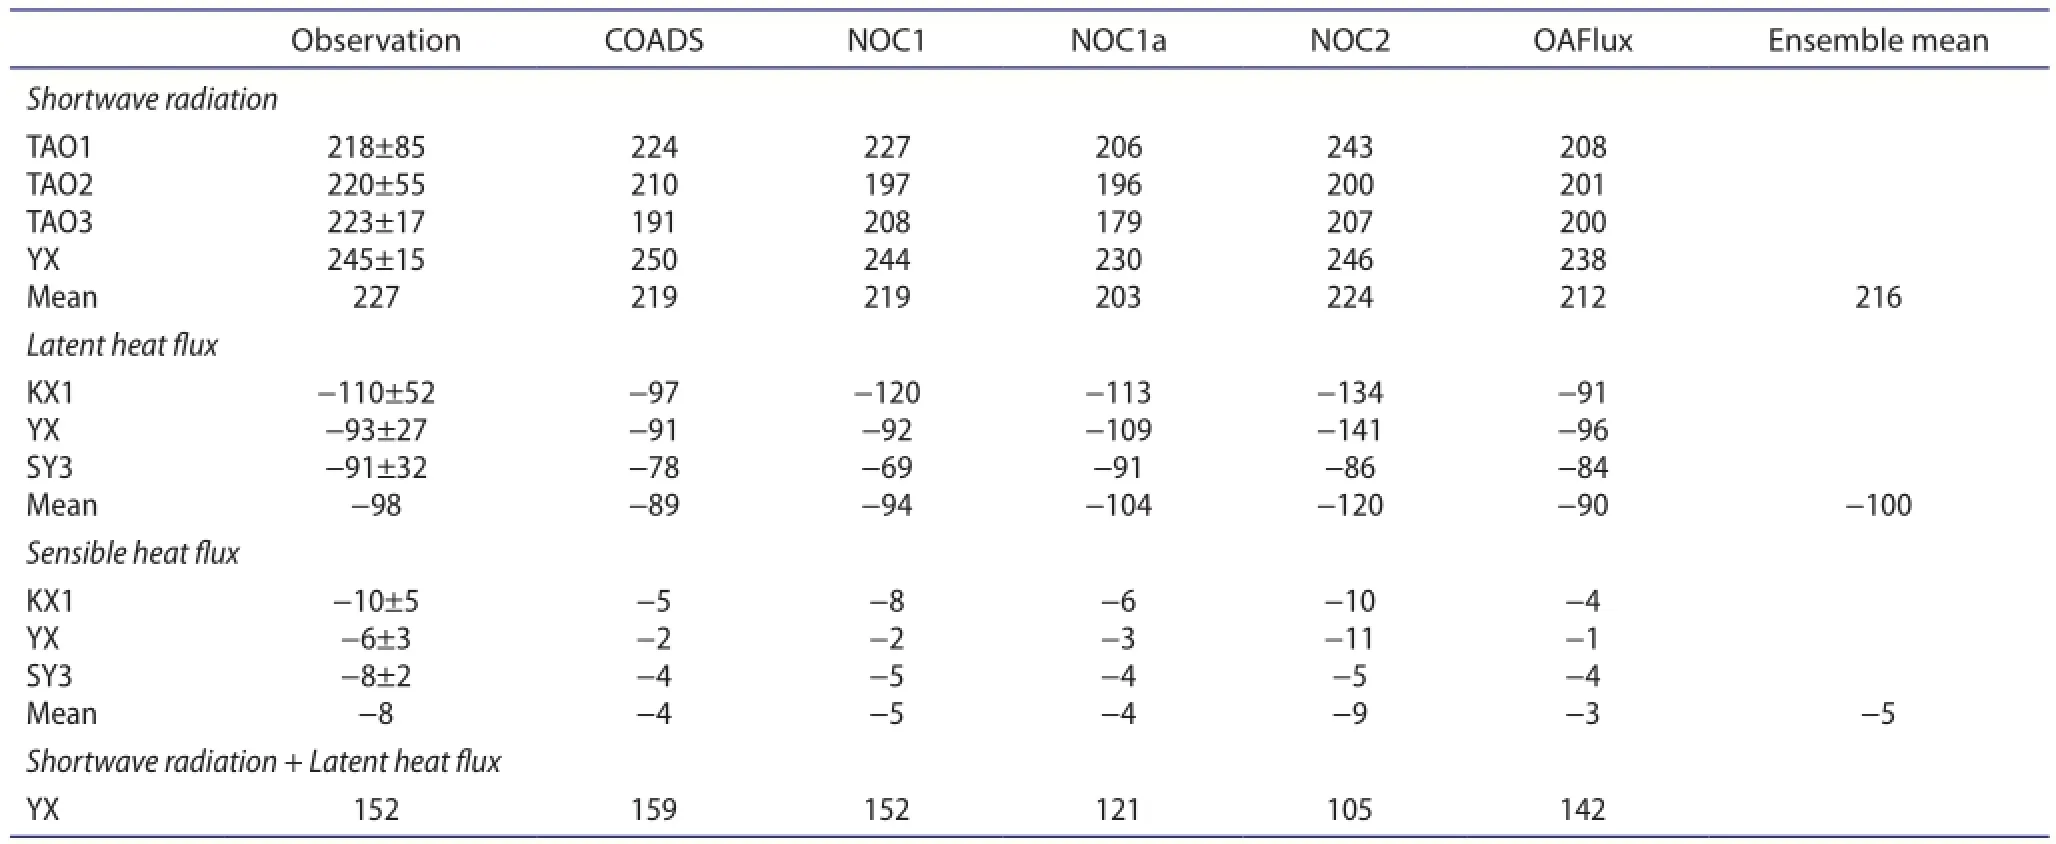
Table 3.The period-average values of the in situ datasets and the fve gridded datasets at the observational stations.
We next compute the period-averaged surface heat budget over the SCS for the fve gridded datasets (Table 4). The Qnetis generally calculated through four components: the shortwave radiation, longwave radiation, latent heat fux, and sensible heat fux. The period is from 1984 to 1993 for the fve gridded datasets. The averaged domain is(1.5—22.5°N, 106.5—121.5°E), shown in Figure 1. The Qnetofthe fve gridded datasets is always positive; that is, the SCS receives heat from the atmosphere. However, the Qnetof the non-constrained COADS, NOC1, NOC2, and OAFlux, in the range of 45—60 W m-2, is around twofold that of NOC1a and more than fourfold that of the constrained COADS. This can be explained by NOC1a having smaller shortwaveradiation but larger latent heat fux. As mentioned above,the shortwave radiation for COADS, NOC1, and OAFlux are underestimated according to the comparison with the in situ data. Therefore, the Qnetover the SCS should be higher than 56 W m-2, which is signifcantly larger (around 10%—20%) than previous estimations (e.g. Qu, Song, and Yamagata 2009).
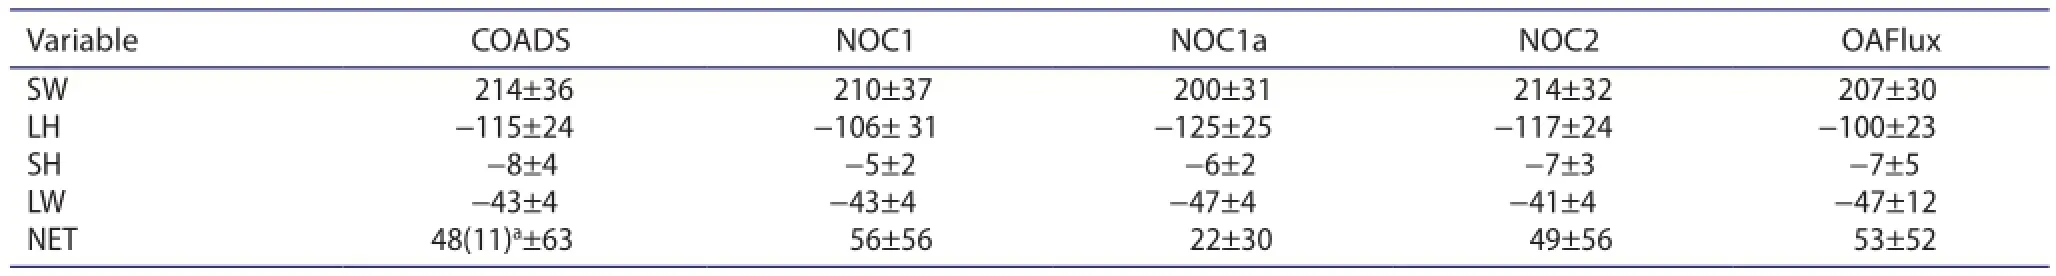
Table 4.The surface heat fux budget for the fve gridded datasets in the SCS for the period 1984—1993. The averaged domain is shown in Figure 1.

Figure 3.The annual mean (a—e) shortwave radiation and (f—j) latent heat fux for the fve gridded datasets during 1984—1993.
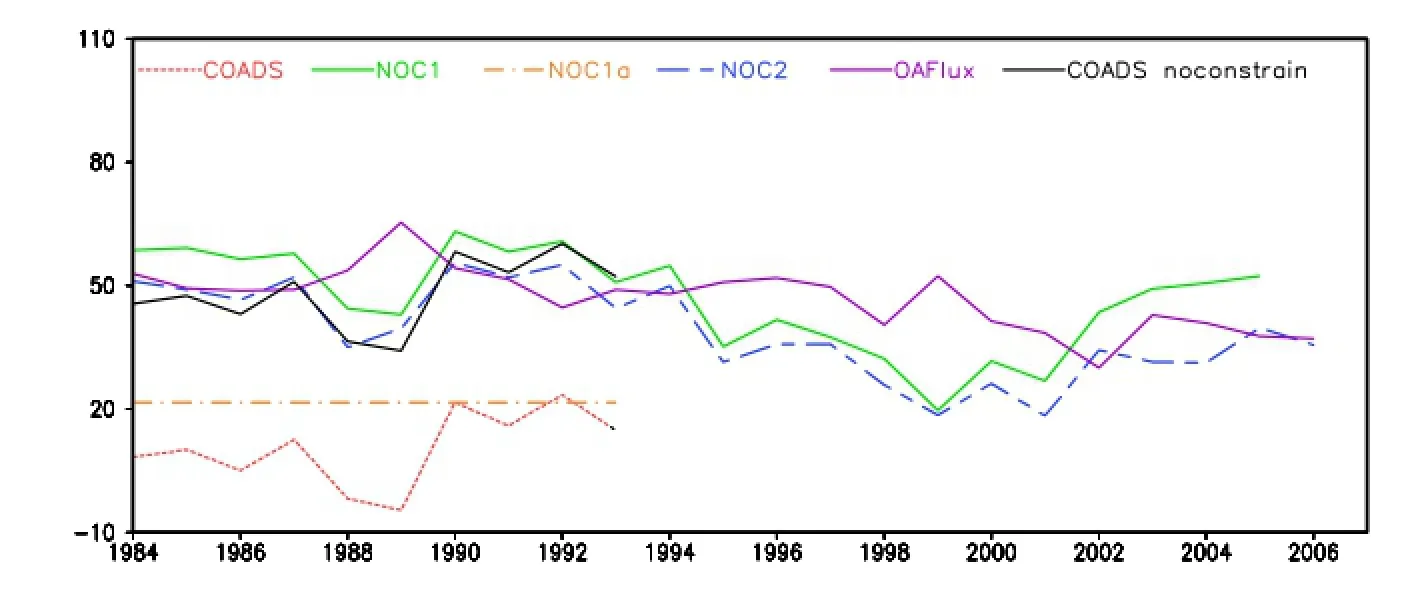
Figure 4.The annual mean net surface heat fux for the fve gridded datasets over the domain shown in Figure 1.Notes: The constrained COADS, NOC1, NOC1a, NOC2, and OAFlux are shown as red dashed, green solid, brown dash-dot, blue dashed, and purple solid lines,respectively. The unconstrained net surface heat fux data for COADS (black solid line), which is calculated from the sum of the shortwave radiation, longwave radiation, latent heat, and sensible heat fux, are also shown. Units: W m-2.
Figure 3 shows the annual mean pattern of the shortwave radiation and latent heat fux for the fve gridded datasets. The average period is the same as that in Table 4,i.e. from 1984 to 1993. We can see that the patterns of the fve gridded datasets are all similar. The large incident solar radiation and the latent heat fux releases occur between 5°N and 20°N, north of the region favorable for convection. Clearly, the solar radiation for NOC1a and OAFlux is smaller than for the other three datasets (Figures 3(c) and (e)), and the latent heat fuxes for NOC1a and NOC2 are larger than the other three datasets (Figures 3(h) and (i)). The diferences among the datasets are mostly homogeneous.
It is also apparent that the Qnetpossesses a clear decreasing trend (Figure 4). The Qnetvalues of NOC1, NOC2, and OAFlux are all near 50—60 W m-2for the period from 1984 to 1993—around twofold more than the value for NOC1a(approximately 20 W m-2). The NOC1 and OAFlux data are mostly larger than the NOC2 data during this period. This also explains why the period-mean values of NOC1 and OAFlux are larger than those of NOC2. The NOC1 and NOC2 values decrease to approximately 30 W m-2around 1998—2001, and then increase to around 50 W m-2and 40 W m-2,respectively. The OAFlux decrease is much slower than that of NOC1 and NOC2; it decreases to approximately 40 W m-2around 2003 and remains there until the end of the record.
4. Summary and discussion
This study employs in situ observations to evaluate fve gridded surface heat fux datasets over the SCS. The surface heat budgets for these gridded datasets are computed. It is found that the gridded datasets generally tend to underestimate both the solar radiation and sensible heat fux, while the latent heat fuxes are close to observations, except for NOC2, which overestimates both the latent and sensible heat fux. The underestimation of the solar radiation indicates that the gridded datasets might also underestimate the surface heat budget. Based on the better performance regarding shortwave radiation, latent heat fux, and the sum of these two heat fuxes (Table 3),we speculate that NOC1 is the relatively better gridded data-set among the fve, although it underestimates the sensible heat fux and Qnet.
There are also possible errors in the observational datasets. For instance, the observation tower is only 360 m away from the island. It could overestimate the ocean turbulent heat fux loss, because the shallow coastal water around the island may be much warmer than the SST far away from land. However, based on our results (Table 3), three of the fve datasets possess a larger latent heat release than that of YongXing Island. It is therefore hard to say, based on the observation data, whether or not it is overestimated in the present study. More observations of the surface fuxes are required.
The Qnetof the fve gridded datasets is always positive. However, the Qnetof COADS, NOC1, NOC2, and OAFlux,ranging from 48 to 56 W m-2, is around twice that of NOC1a(22 W m-2). The imbalance for NOC2 is smaller than that for NOC1 and OAFlux, at about 49 W m-2, because of the large release of latent heat fux. Based on the comparison, we believe that the Qnetover the SCS should be higher than 56 W m-2, which is signifcantly larger (roughly 10%—20%)than previous estimations (e.g. Qu, Song, and Yamagata 2009).
It is also found that the Qnetpossesses a clear decreasing trend. The decreasing trend in the Qnetis caused by the decreasing trend in the latent heat fux, not the shortwave radiation (not shown). We also calculate the surface heat budget for NOC1, NOC2, and OAFlux during the period 1994—2005 (not shown). The shortwave and longwave radiation of the three datasets are almost similar to that in Table 4. However, the latent heat fux becomes much larger and the Qnetdecreases to 42, 33, and 45 W m-2for NOC1,NOC2, and OAFlux, respectively. This is consistent with the decreasing trend shown in Figure 4, and the Qnetof NOC1 and OAFlux is still larger than that of NOC2. The decreasing trend is also closely related to the Pacifc Decadal Oscillation index. Song et al. (2014) found that the upper layer heat content possesses an increasing trend during our study period. That may indicate that the increasing surface temperature will increase the temperature diferences between the atmosphere and ocean, and ultimately increase the release of turbulent heat fux and decrease the Qnet. However, this may be not as simple as what we have explained, and so further analysis is required.
Disclosure statement
No potential confict of interest was reported by the authors.
Funding
This work was supported by the National Key Basic Research Program of China [grant number 2013CB956204]; the National Natural Science Foundation of China [grant number 41576025],[grant number 41275084], [grant number 41075059]; and the Strategic Priority Research Program entitled ‘Western Pacifc Ocean System: Structure, Dynamics and Consequences' of the Chinese Academy of Sciences [grant number XDA11010304].
References
Behringer, D., and Y. Xue. 2004. “Evaluation of the Global Ocean Data Assimilation System at NCEP: The Pacifc Ocean.”Preprints, Eighth Symposium on Integrated Observing and Assimilation Systems for Atmosphere: Oceans, and Land Surface, Seattle, Washington, American Meteorological Society, Vol. 2.
Berry, D. I., and E. C. Kent. 2009. “A New Air—Sea Interaction Gridded Dataset from ICOADS with Uncertainty Estimates.”Bulletin of the American Meteorological Society 90 (5): 645—656. Carton, J. A., and B. S. Giese. 2008. “A Reanalysis of Ocean Climate Using Simple Ocean Data Assimilation (SODA).” Monthly Weather Review 136 (8): 2999—3017.
Chou, S. H., E. Nelkin, J. Ardizzone, R. M. Atlas, and C. L. Shie. 2003. “Surface Turbulent Heat and Momentum Fluxes over Global Oceans Based on the Goddard Satellite Retrievals,Version 2 (GSSTF2).” Journal of Climate 16 (20): 3256—3273.
Da Silva, A., C. Young, and S. Levitus. 1994. “Algorithms and Procedure. Vol. 1, Atlas of Surface Marine Data 1994.”Washington: NOAA Atlas NESDIS 6: 83.
Fairall, C. W., E. F. Bradley, J. E. Hare, A. A. Grachev, and J. B. Edson. 2003. “Bulk Parameterization of Air—Sea Fluxes: Updates and Verifcation for the COARE Algorithm.” Journal of Climate 16(4): 571—591.
Gibson, M. M., and R. D. Harper. 1997. “Calculation of Impingingjet Heat Transfer with the Low-Reynolds-Number Q- ζ Turbulence Model.” International Journal of Heat and Fluid Flow 18 (1): 80—87.
Grist, J., and S. Josey. 2003. “Inverse Analysis Adjustment of the SOC Air—Sea Flux Climatology Using Ocean Heat Transport Constraints.” Journal of Climate 16 (20): 3274—3295.
Ji, M., A. Leetmaa, and J. Derber. 1995. “An Ocean Analysis System for Seasonal to Interannual Climate Studies.” Monthly Weather Review 123 (2): 460—481.
Josey, S., E. Kent, and P. Taylor. 1998. The Southampton Oceanography Center (SOC) Ocean-atmosphere Heat,Momentum and Freshwater Flux Atlas. Southampton: Southampton Oceanography Centre.
Josey, S., E. Kent, and P. Taylor. 1999. “New Insights into the Ocean Heat Budget Closure Problem from Analysis of the SOC Air—Sea Flux Climatology.” Journal of Climate 12 (9): 2856—2880.
Kalnay, E., M. Kanamitsu, R. Kistler, W. Collins, D. Deaven, L. Gandin, M. Iredell, et al. 1996. “The NCEP/NCAR 40-Year Reanalysis Project.” Bulletin of the American Meteorological Society 77 (3): 437—471.
Kondo, J. 1975. “Air—Sea Bulk Transfer Coefcients in Diabatic Conditions.” Boundary-Layer Meteorology 9 (1): 91—112.
Kubota, M., N. Iwasaka, S. Kizu, M. Konda, and K. Kutsuwada. 2002. “Japanese Ocean Flux Data Sets with Use of Remote Sensing Observations (J-OFURO).” Journal of Oceanography 58 (1): 213—225.
Large, W. G., and S. G. Yeager. 2008. “The Global Climatology of an Interannually Varying Air—Sea Flux Data Set.” Climate Dynamics 33 (2—3): 341—364.
Oberhuber, J. M. 1988. An Atlas Based on COADS Data Set: The Budgets of Heat Buoyancy and Turbulent Kinetic Energy at the Surface of the Global Ocean. Hamburg: Max-Planck-Institut fur Meteorologie.
Qu, S., F. Hu, and Y. Li. 2000. “Some Characteristics of Air—Sea Exchange for the South China Sea Summer Monsoon in the Period of SCSMEX98.” Climatic and Environmental Research 5(4): 434—446.
Qu, T., Y. Du, and H. Sasaki. 2006. “South China Sea Throughfow: A Heat and Freshwater Conveyor.” Geophysical Research Letters 33: L23617. doi:10.1029/2006GL028350.
Qu, T., Y. Song, and T. Yamagata. 2009. “An Introduction to the South China Sea Throughfow: Its Dynamics, Variability,and Application for Climate.” Dynamics of Atmospheres and Oceans 47 (1): 3—14.
Schulz, J., J. Meywerk, S. Ewald, and P. Schlüssel. 1997. “Evaluation of Satellite-derived Latent Heat Fluxes.” Journal of Climate 10(11): 2782—2795.
Song, W., J. Lan, Q. Liu, D. Sui, L. Zeng, and D. Wang. 2014.“Decadal Variability of Heat Content in the South China Sea Inferred from Observation Data and an Ocean Data Assimilation Product.” Ocean Science 10 (1): 135—139.
Sun, Q., J. Chen, and J. Yan. 2010. “The Variation Characteristics of Air Sea Fluxes over Xisha Area before and after the Onset of the South China Sea Monsoon in 2008.” Acta Oceanologica Sinica 32 (4): 12—23.
Uppala, S. M., and P. W. KÅllberg, A. J. Simmons, U. Andrae, V. D. C. Bechtold, M. Fiorino, J. K. Gibson, et al. 2005. “The ERA-40 Re-analysis.” Quarterly Journal of the Royal Meteorological Society 131 (612): 2961—3012.
Yu, L., and R. A. Weller. 2007. “Objectively Analyzed Air—Sea Heat Fluxes for the Global Ice-free Oceans (1981—2005).” Bulletin of the American Meteorological Society 88 (4): 527—539.
Yu, L., X. Jin, and R. Weller. 2008. Mutidecade Global Flux Datasets from the Objectively Analyzed Air-Sea Fluxes (OAFlux) Project: Latent and Sensible Heat Fluxes, Ocean Evaporation, and Related Surface Meteorological Variables. Tech. Rep. OA-2008-01, Woods Hole: Woods Hole Oceanographic Institution,64 pp.
Zeng, L., P. Shi, W. T. Liu, and D. Wang. 2009. “Evaluation of a Satellite-derived Latent Heat Flux Product in the South China Sea: A Comparison with Moored Buoy Data and Various Products.” Atmospheric Research 94 (1): 91—105.
Zhang, Y., W. B. Rossow, A. A. Lacis, V. Oinas, and M. I. Mishchenko. 2004. “Calculation of Radiative Fluxes from the Surface to Top of Atmosphere Based on ISCCP and Other Global Data Sets: Refnements of the Radiative Transfer Model and the Input Data.” Journal of Geophysical Research 109: D19105. doi:10.1029/2003JD004457.
短波辐射; 净热通量; 南海;热收支
24 November 2015
CONTACT LIU Hai-Long lhl@lasg.iap.ac.cn
© 2016 The Author(s). Published by Taylor & Francis
This is an Open Access article distributed under the terms of the Creative Commons Attribution License (http://creativecommons.org/licenses/by/4.0/), which permits unrestricted use, distribution, and reproduction in any medium, provided the original work is properly cited.
猜你喜欢
数学物理学报(2022年5期)2022-10-09
空间科学学报(2021年4期)2021-08-30
数理化解题研究·综合版(2020年3期)2020-09-10
海洋信息技术与应用(2020年2期)2020-07-27
热带海洋学报(2020年3期)2020-05-25
海洋通报(2020年6期)2020-03-19
成都信息工程大学学报(2019年5期)2019-05-21
科学文化评论(2018年2期)2018-05-14
现代农业科技(2017年7期)2017-05-22
新高考·高二数学(2016年3期)2016-05-20
 Atmospheric and Oceanic Science Letters2016年3期
- Atmospheric and Oceanic Science Letters的其它文章
- Quasi-biennial oscillation signal detected in the stratospheric zonal wind at 55-65°N
- Long-term surface air temperature trend and the possible impact on historical warming in CMIP5 models
- Precipitation as a control of vegetation phenology for temperate steppes in China
- An observational study on vertical raindrop size distributions during stratiform rain in a semiarid plateau climate zone
- Asymmetric association of rainfall and atmospheric circulation over East Asia with anomalous rainfall in the tropical western North Pacific in summer
- The relationship between the Arctic Oscillation and ENSO as simulated by CCSM4