
Glass Fibre Reinforced Concrete Rebound Optimization
2017-03-13 05:47SadAlperYILDIZELMuhammetEnsarkhanKAPLAN
Sadık Alper YILDIZEL , Muhammet Ensar YİĞİT, Gökhan KAPLAN
1 Introduction
This research studies the optimum rebound amount for glass fibre reinforced concrete.The definition of spraying concrete covers the concrete and soil mixtures which are sprayed to a surface using compressed air. The technology was first developed to preserve dinosaur bones in 1920. It has found itself application areas in engineering discipline such as slope stabilization, tunnel excavations and glass-fibre reinforced concrete facade panel production in the years to come [Hofler and Schlumpf (2006)]. The delivery of concrete to intended surface is made possible with the compressive effect of the spraying pressure. Surface adherence of the concrete and its compression on the given surface is easily attained when fast application of spraying is preferred. These types of applications have a higher amount of cement content when compared to standard concrete types. Its sand content, on the other hand, ranges between 52% and 65% of the total aggregate by weight [Simsek (2012)].
Sprayed products are more durable and offer a higher fire resistance when compared to other concrete cast types [Kamara and Novak (2013)]. They have found itself a wide area of usage ranging from repair of damaged concrete surfaces to the maintenance of bridges after earthquakes and pool construction [Engineer (1993)].
Traditional spray concrete applications are classified into two main types, namely, wetmix and dry-mix. The main advantage of wet-mix over dry-mix is that it provides superior mechanical properties as it is cast more homogenously with its relatively low Water/Cement ratio. One of the major problems we face in shotcrete applications is the need to minimize the rebound rate [Simsek (2012)]. Dry-mix involves a rebound rate between 20% and 60% while wet-mix involves a rebound rate of %10-15[Schallom and Ballou (2003); Özdoğan (2009)]. For glass fibre reinforced concrete production, wet mix is generally preferred by the producers. For this reason, wet design was used within the scope of this study.
The amount of large aggregate availability in mix design plays a critical role for the spray performance and rebound. Crushed rocks should be preferred for the aggregate to be used.Yet, crushed rocks have a drawback that they increase the equipment wear between 25%and 45% [Yurdakul (2001)]. It was shown that the common sprayed mixtures with aggregates of larger grain size provide a better compression therefore reduces the density,they require reduced amounts of cement and water, they are subject to reduced contraction and they have a higher adherence strength, yet the existence of larger sized aggregate increases the rebound rate dramatically and reduces workability. Nevertheless,very low water/cement ratio would increase the rebound due to poor compression while a very high water/cement ratio would increase the rebound as it would make it difficult for surface adherence [Bourchier (1990)]. However, fine aggregates were used as per the requirements of the international glass fibre reinforced concrete association requirements.For other types of sprayed concrete processes, the spray gun should be at a correct angle(90°) and the distance between the gun and the surface must be between 1 and 2 meters for optimum compression [Malmgren, Nordlund, and Rolund (2004); Melbye, Ve Garshol (2000)]. In many his experimental study, researchers place the nozzle at a 90°angle to the surface and 1.0-1.1 meters away from the mold, and this application was identified as the optimum [Ayış (2010)]. It was also shown that the air compression of 4.5 bars gives the best results in terms of compressive strength and rebound velocity of concrete.
There are ongoing optimization studies worldwide for the angle of the nozzle above the surface, the distance between the nozzle and the surface area, and the viscosity values as factors affecting the rebound velocity [Morgan and Columbia (2000), Ginouse, Jolin and Bissonnette (2014); Ginouse and Jolin (2015)]. However; there are no common and final decision for glass fibre reinforced concrete spraying process.
The splashed concrete amount is mainly effected by mixing water, aggregate types,chemical admixtures, additives and viscosity of the mixture [Armelin and Nemkumar(1998); Warner (1995); Kusterle and Eichler (1997)] Glass fibre reinforced concrete production technology only comprises fine aggregates and minerals. For this reason,aggregate effect was ignored within the scope of this research.
Research Significance Glass fiber concrete production costs are higher compared to traditional concrete methods.For this reason, it is of utmost importance to reduce the loss of material, especially rebound amounts in production line. This study aims to contribute the rebound optimization works for the production.
2 Experimental studies
2.1 Method
The experimental studies were carried out at the production line of a glass fibre reinforced concrete producers, under the original sprayed concrete production conditions.The rebound amounts were measured by spraying glass fibre reinforced concrete on to a 1000 x 4000 mm mold. The spray gun angles were selected as 90°, 75° and 45° with the distances of 50 cm, 40 cm and 30 cm to the mold surfaces. Spray angles and distances were selected as per the production requirements of the glass fibre reinforced concrete producer (Fig. 1a, b). The spraying of glass fibre reinforced concrete was

Figure 1: Spray Processes
Carried out as per the requirements of GRCA in 4 mm thick layers as shown on Fig. 2.Each layer was compacted with a roller before the spray process of the next layers.Splashed concrete particles

Figure 2: Spraying paths
were collected with the help of a tarpaulin blanket. At the end of each spraying process,the mold (A: kg) and the tarpaulin blanket (B: kg) were weighed. Rebound was calculated with the following formula (1):

In addition to the splashed concrete amount calculations, viscosity values of the mixes were calculated with a viscometer at the temperature of 25 C°. Results were converted to Pa. s by the means of common fresh concrete viscosity calculations with the equation (2)where Ʈ is shear stress (Pa), µ is the plastic viscosity value (Pa s), Ʈ0 (Pa) is yield stress and α is shear rate (s-1) [Nanthagopalan and Santhanam (2010); Pei, Liu and Wang(2015)].

Static consistency of the mixes complying with European standard EN 1170-1 and bending strength value of specimens complying with European standard EN 1170-4 EN 1170-5 were also measured.
2.2 Materials
In this study, CEM I 52.5 R cement [TS 197-1] was used for the mixture design. The chemical and physical properties of CEM I 52.5 R cement are presented in Table 1.Polycarboxylate based third generation water reducer was preferred as the chemical agent.

Table 1: The chemical and physical properties of CEM I 52.5 R cement
Silica sand of AFS 80 to 100 (AFS is obtained by multiplying the sand grammage per sieve and DIN factor for each sieve and then division by the total grammage) was chosen as the aggregate for mixtures. Properties of the silica sand are given in Table 2. The particle size distribution of the

Table 2: Silica aggregate properties
Aggregate can be found in Fig. 3. Alkali resistant glass fibers were used in the scope of this study.
Fibers were cut to a length of 10 mm by the spray gun blade during the spray process.The physical and chemical property of the fibers are given in Table 3. And Drinking water was preferred for this experimental study.
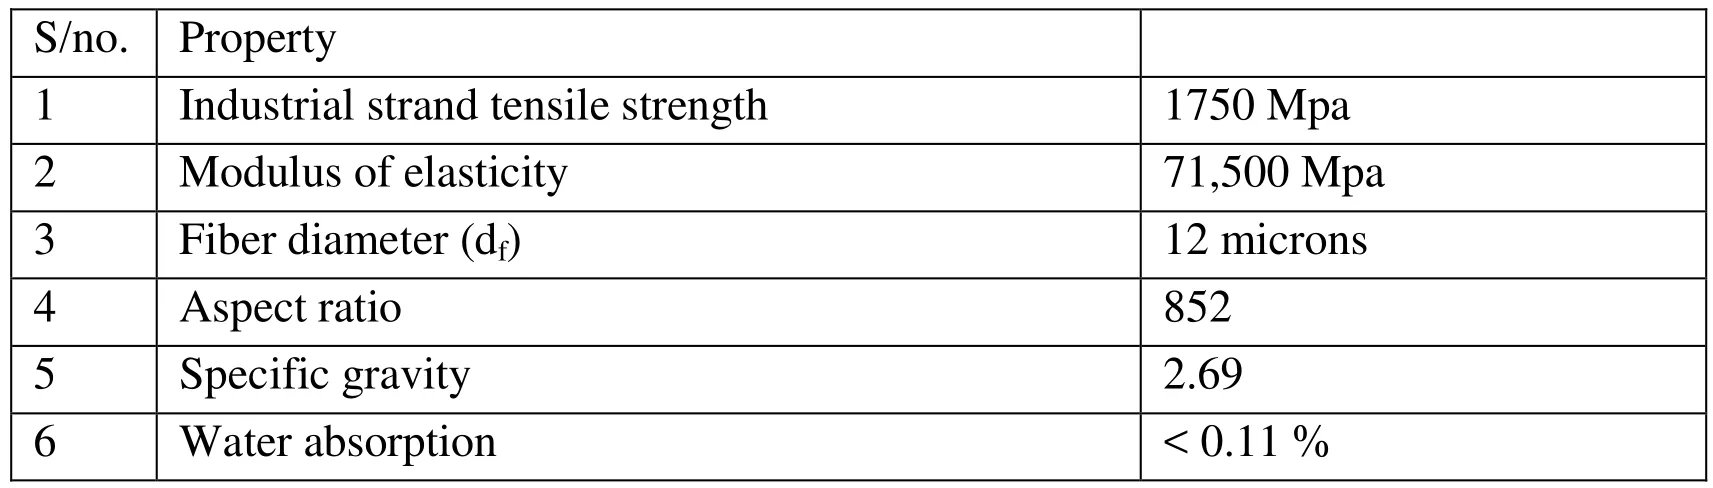
Table 3: Physical and mechanical property of alkali resistant glass fiber
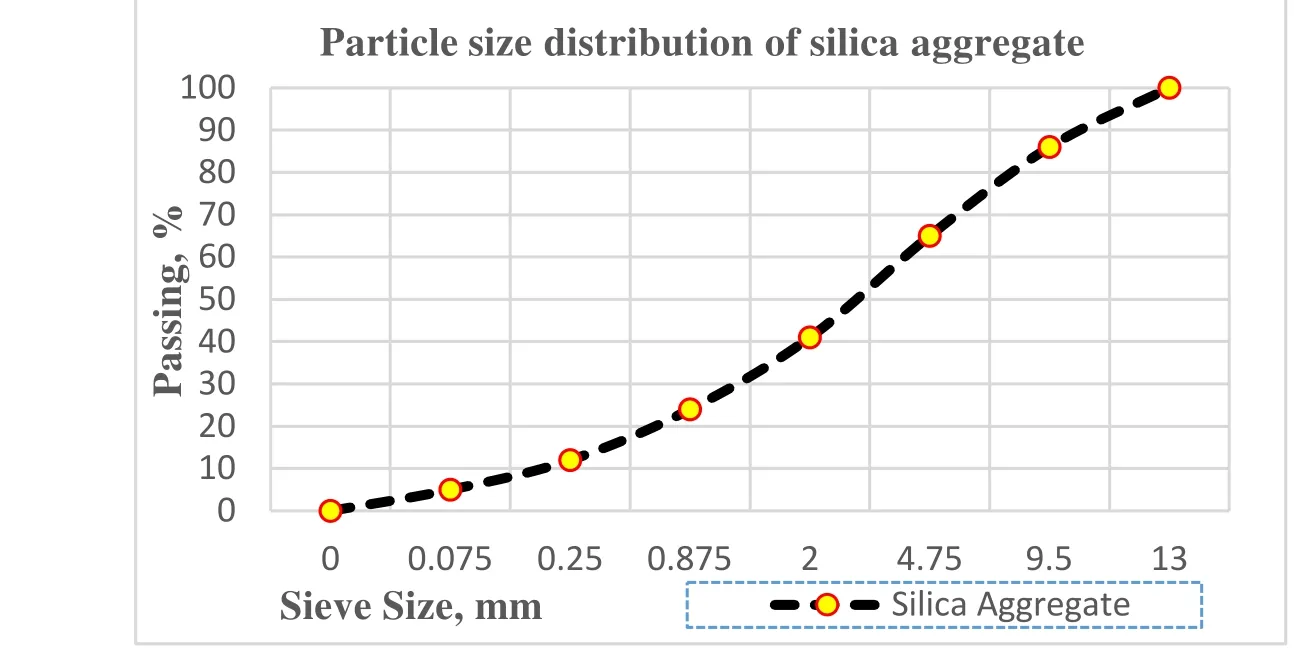
Figure 3: Aggregate particle size distribution
The mixture design is presented in Table 4.

Table 4: Material content of 1m3 mixture
2.3 Experimental study results
The first phase of the experimental study was started with the viscosity and static consistency determination works. Glass fiber reinforced mixes viscosity values are measured by means of eq. (1) and the results are given in Table 5.
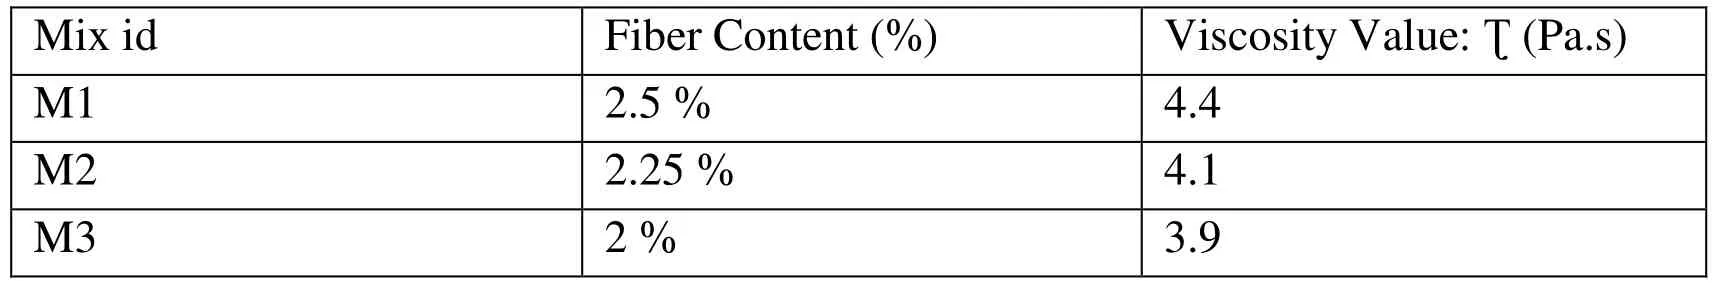
Table 5: Viscosity measurement
Static consistency of the glass fiber added mixes were measured as per the requirements of the EN 1170-1 and results are seen in Fig. 4.

Figure 4: Static consistency results (EN 1170-1)
The general tendency was that the viscosity value increased when fiber content was higher. And spread of the mixes had lower values when they had more fiber content.These were obvious with the literature study results [Ulzurrun, Gonzalo and Carlos Zanuy (2017); Al-Hadithi, Abdulkader Ismail, and Nahla Naji Hilal (2016); Ahmadi and Mohsen et al. (2017)]. Fig. 5.a., 5.b and 5.c. show the rebound results for each mixture,classified by their spray distance and spray gun – surface angle.

Figure 5(a): Rebound results for 90 º gun-surface angle
The figures highlight the roles of viscosity and high gun-surface angle in rebound reduction. Mix I had the lowest rebound values when spraying performed with 90 º gunsurface angle. The increase of rebound could reach 15 % for the worst cases, mainly for the 3.9 viscosity values.
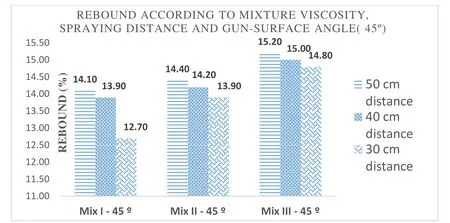
Figure 5(c): Rebound results for 45 º gun-surface angle
Some mixtures seemed more efficient comparing to others, but their behavior depended on the spray distance and angle. Mix I gave good results for the 45 ° angle which is the worst case of the spraying process.
Another point is that the decrease in static consistency value lead to rebound reduction.However, it is not a single characteristic of the mixture to make easy decision.
Bending strength of the mixes were calculated per the required standards: EN 1170-4 and EN 1170-5.

Figure 6: Modulus of Rupture Values (EN 1170-4&5)
The results presented above (Fig. 6) concern only the 28-day bending strength values of the glass fiber reinforced mixes. The minimum required value of 17 Mpa was passed by the all mixes. Decrease in viscosity led to a slight increase in strength values in parallel with the previous researches [Bhogayata, Ankur and Narendra (2017); Da Silva, Marco Antônio, et al. (2017); Armengaud and Julie et al. (2017)]. For general cast concrete, the driest consistency should result in the highest strength; however, for glass fiber reinforced concrete, fiber content plays a significant role for determining the highest strength when they were used within the limits.
The experimental results show that fresh properties of mixes linked with the rebound amounts. But they are very empirical. For this reason, it becomes easier the adjust spray distance and angle to aim less rebound amount. To analyze the problem in more detail and to compare the results with the site studies, the simulation analysis of spraying process was done by the aid of the finite element method based software. As commonly preferred by the academics [Wei and Yang (2016); Vu-Bac, Nguyen-Xuan, Chen, Bordas,Kerfriden, Simpson and Rabczuk (2011)].
3 Numerical studies
3.1 Definition of the problem
This section addresses the phenomenon of spray concrete acting as a fluid. Models were identified to detect the flow rate and compression distribution the fluid concrete generates on the fixed cast surface (Fig. 7).
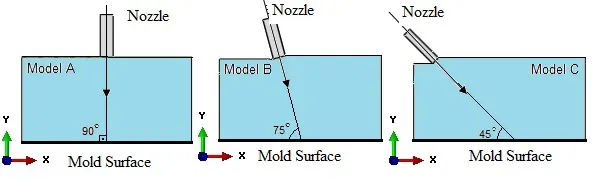
Figure 7: Models and the angle of spray gun above the surface
The spray concrete models were analyzed for different angle, distance and viscosity values as shown in the table below (Table 6).
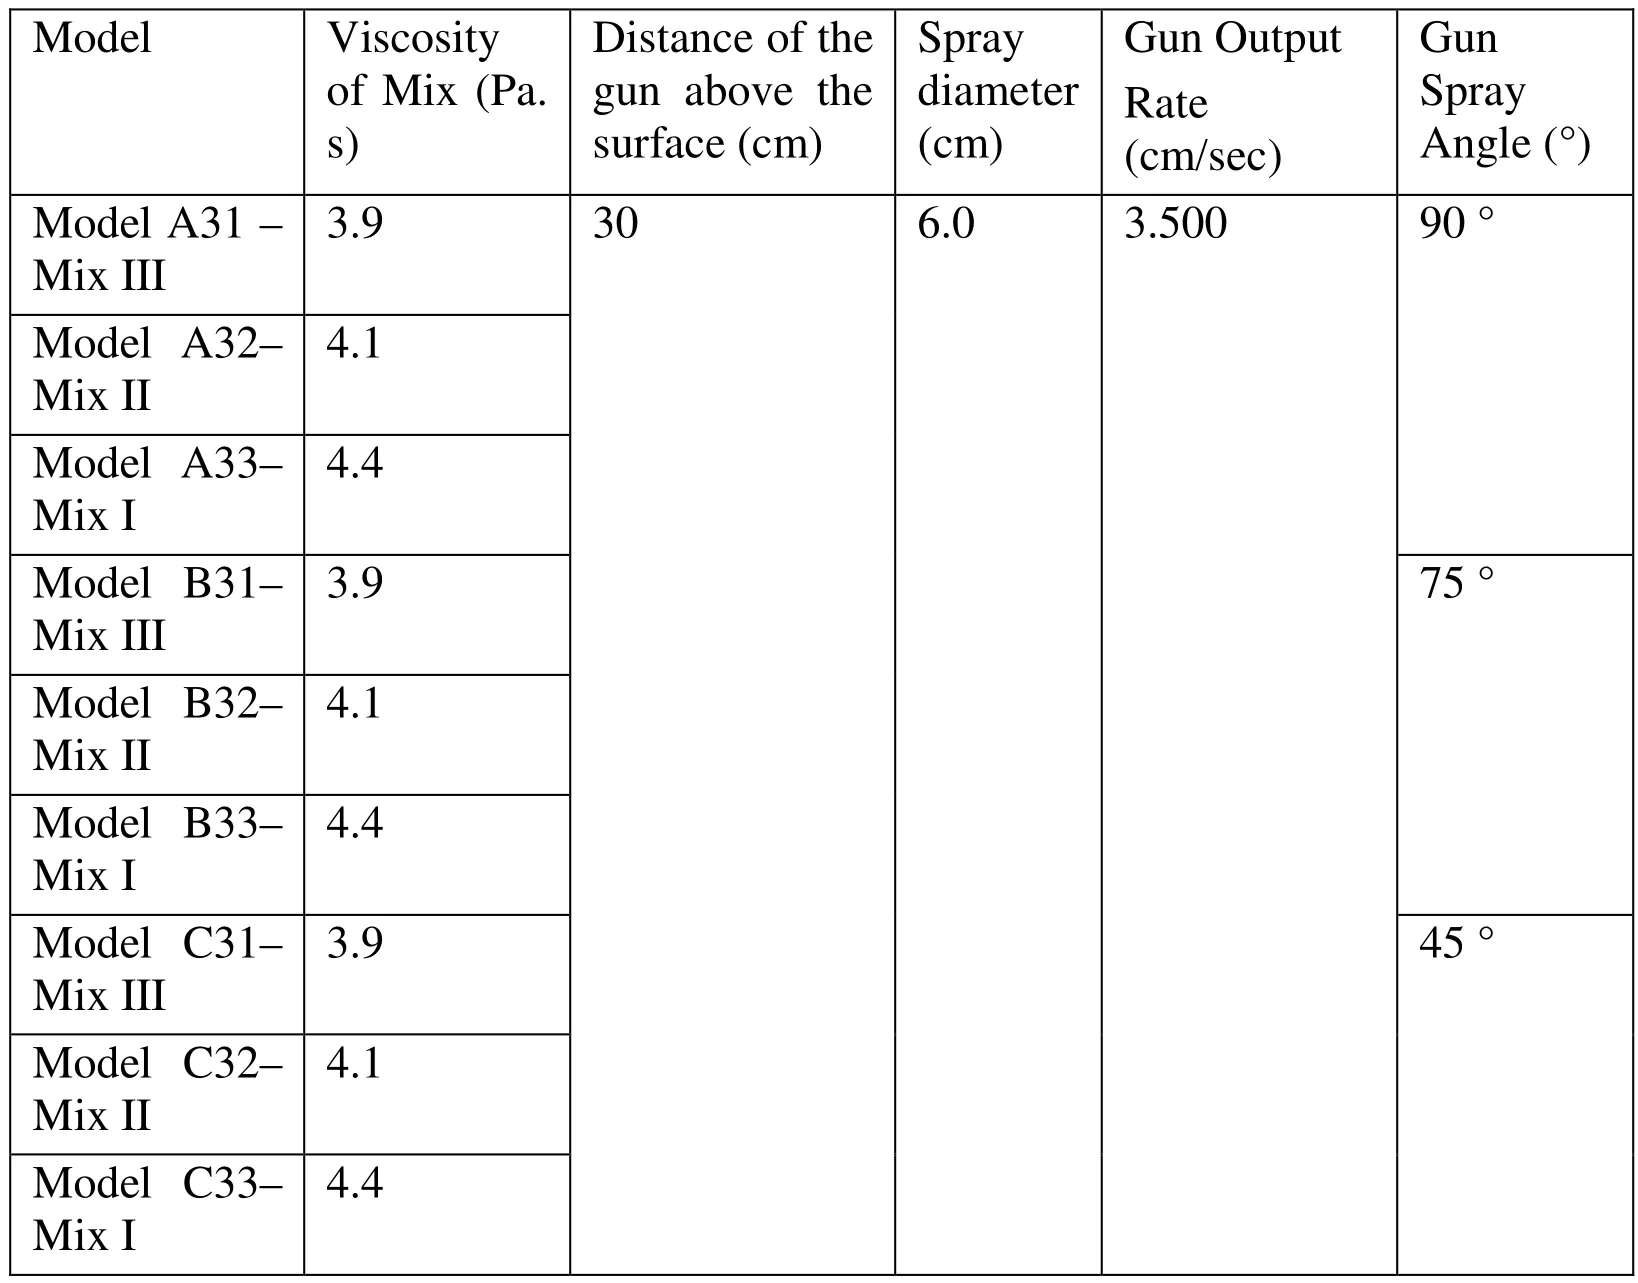
Table 6: Numerical modelling parameters
Examination points were identified on the fixed cast surface which the concrete was to be sprayed on and compression and velocity values were detected for these points (Figure 8).The impact of the concrete sprayed are then identified as these compression and velocity values were obtained.
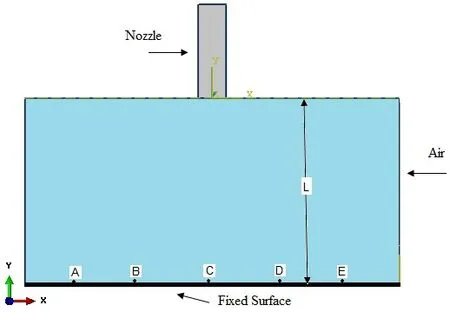
Figure 8: Fixed surface, nozzle and examination points (A, B, C, D, E)
3.2 Solution mesh design
The element geometry used in allocation of the fluid into finite elements is hexahedron.Element types used in fluid models vary. The figure below shows the element type of EC3D8R which is used in fluid models (Fig. 9).

Figure 9: EC3D8R element geometry
This element which is suitable for fluid-structure interaction is Eulerian Continuum 3D,8-node element with reduced integration. It has a form of a modified hexahedron against contact problems. This model involves 7940 points and 3600 elements. The general solution mesh range used for the points and elements given in Fig.10 was taken 1.0 cm while the solution network range used for the areas closer to the nozzle surface was taken 0.5cm. These ranges were defined because of the “Convergence Analysis” as detailed in the Analysis Results section.

Figure 10: Solution mesh structure of the model
3.3 Material properties for simulation
After establishing the model geometry, materials were assigned to the model. The most suitable model was found to be EOS model (applicable for Newtonian’s fluid equation of state) [Nöldgen, Riedel, Thoma and Fehling; Tan, Chan, Poon and Chng; Gebbeken and Greulich (2015); Tai, Chu, Hu and Wu (2011)]. The properties of EOS material are given in Table 7 in detail.

Table 7: EOS material parameters
3.4 Boundary conditions
The following boundary conditions were given in the rectangular model as to allow for flow motion in the x, y direction (Fig. 11).
• VY=3500cm/sec was used for the y direction while nozzle output rate was taken constant.
• No flow was allowed for the boundary conditions of lateral surface for the z direction(Vz= 0 Boundary condition)
• Gravitational pull was applied to the model for the Y direction (-981 cm/sn2).
• No movement was allowed for the x, y and z directions on the surface of the cast.(UX=UY=UZ=0 Boundary condition).
• No fluid acceleration was allowed for the x, y and z directions on the surface of the cast (VX=VY=VZ=0 Boundary condition).

Figure 11: Boundary conditions used in the finite element analysis
3.5 Convergence analysis
The Finite Element Model which is to be modelled using ABAQUS software requires the change in location (Δx) and time (Δt). These values were obtained using different Solution mesh distances with the convergence analysis. The mesh range of the system is defined when no change or a negligible change was observed for the reference value(velocity or pressure, etc. at the same point) even the solution mesh range was reduced. It is well-known that it is possible to obtain definite results by working with reduced values yet a prolonged analysis process is unavoidable. The convergence analysis of the model is shown in the figure below (Fig 12).
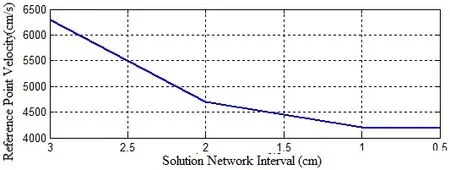
Figure 12: Convergence analysis graph
As seen in Fig. 12, the change in the velocity of the reference point was in negligible rate(2%) even when the solution mesh range was assigned a value less than 1.0cm. For this study, it was determined that it would be better to assign a lesser solution mesh range for parts requires detailed examination and a greater solution mesh range for others to accelerate the process.
3.6 Analysis results
Analysis results of surface contact velocity of sprayed concrete for 90 ° spray angle and 30 cm distance is shown in Fig. 13. It was obvious that Mix III (Model A31) has the maximum resultant velocity for having less viscosity value as 3.9 Pa s. High resultant velocity led to more rebound values.
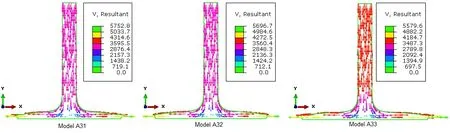
Figure 13: Resultant contact velocity values for 90 ° angle and 30 cm spray distance
Analysis results of surface contact velocity of sprayed concrete for 75 ° spray angle and 30 cm distance are shown in Fig. 14.

Figure 14: Resultant contact velocity values for 75 ° angle and 30 cm spray distance
Spray angle of 75 ° led to high speed of resultant particles. Model B31-Mix III has the maximum resultant contact velocity again having less viscosity values of 3.9 Pa s. As for the rebound in Fig. 14, it can be noted that decreasing the spraying angle does necessarily increase the resultant velocity with the low viscosity values.
The results presented above led to an expectation for obtaining maximum rebound values for 45° angle. Related analysis results are shown in Fig. 15.

Figure 15: Resultant contact velocity values for 45 ° angle and 30 cm spray distance
The minimum value of rebound velocity was found for Model C33 (Mix I) as V=5897.8 cm/sec. It can be noted that decreasing the spraying angle led to more rebound values as presented above.
4 Assessment and Results
Rebound optimization of sprayed glass fiber reinforced concrete is a very complex engineering problem involving many factors. To obtain an optimum rebound value, it is necessary to study the influence of technical parameters: spraying angle, distance and the viscosity of the mixes. This phenomenon can be studied in detail with the aid of the finite element based software as conducted within the scope of this study.
The following outcomes were obtained in the light of the analyses and on-site production conducted.
· The most suitable angle for spraying process are provided with the angle of 90° to achieve minimum rebound effect.
· The most suitable value for the discharge distance was acquired as L=50cm.Furthermore, it was observed that the rebound velocity increased with the rising distance values.
· Rebound velocity is increased with the decreasing angle between the cast surface and the nozzle spray direction. Therefore, rebounding concrete amount is increased due to relatively high velocity.
· It is also observed that the splashed concrete amount was decreased because of gradually increasing viscosity values in the analyses.
Ayış H.İ., (2010) "Tünel Açma Sistemlerinde Çelik Lifli Püskürtme Betonun Uygulanabilirliği", Yüksek Lisans Tezi, Yıldız Teknik Üniversitesi.
Al-Hadithi, Abdulkader Ismail, and Nahla Naji Hilal. (2016) "The possibility of enhancing some properties of self-compacting concrete by adding waste plastic fibers."Journal of Building Engineering 8: 20-28.
Armengaud, Julie, et al. (2017) "Characterization of fresh dry-mix shotcrete and correlation to rebound." Construction and Building Materials 135: 225-232.
Ahmadi, Mohsen, et al. (2017) "Mechanical properties of the concrete containing recycled fibers and aggregates." Construction and Building Materials 144: 392-398.
Arıoğlu, E. Ve Yüksel, A. (2002). Yeraltı Yapılarında Pükürtme Beton. İstanbul:TMMOB Maden Müh. Odası Çalışma Raporu
Bhogayata, Ankur C., and Narendra K. Arora. (2017) "Fresh and strength properties of concrete reinforced with metalized plastic waste fibers." Construction and Building Materials 146: 455-463.
Bourchier, F. B. (1990). Practical Considerations of shotcrete in an underground mining enviroment. Doktora tezi, Toronto Üniversitesi.
Bingham EC, Reiner M. (2004) The rheological properties of cement and cement mortar–stone. J Appl Phys; 4(3):88–96.
Da Silva, Marco Antônio, et al. (2017) "Rheological and mechanical behavior of High Strength Steel Fiber-River Gravel Self Compacting Concrete." Construction and Building Materials 150: 606-618.
Engineer (1993) Standard Practice for Shotcrete, Manual: 20020626
Gebbeken N., Greulich S., (2005) "Effects of StressWave Propagation in Reinforced Concrete Bond considering Crack Opening", Numerical Modelling of Concrete Cracking Innsbruck, Austria.
Ginouse N., Jolin M., (2015) “Investigation of spray pattern in shotcrete applications”,Construction and Building Materials, Volume 93, 15 September.
Ginouse N., Jolin M., Bissonnette B., (2014) “Effect of equipment on spray velocity distribution in shotcrete applications”, Construction and Building Materials, Volume 70,15 November.
H. Armelin, B. Nemkumar, (1998) Development of a general model of aggregate rebound for dry-mix shotcrete— (Part II), Rilem, Mater. Struct. 31 (207) 195–202..
Hofler J., Schlumpf J. (2006) Shotcrete in Tunnel Construction: introduction to the basic technology of sprayed Concrete, 3rd Edition.
J.Warner, (1995) Understanding shotcrete—the fundamentals, Concr. Int. 17 (5) 59– 64.Kamara, M.E; Novak, L.C. (2013) PCA Notes on ACI 318-11 Building Code.
Malmgren, l. Nordlund, E. Ve Rolund,S. (2004). Adhesion strength and shrinkage of shotcrete. Tunneling and underground space technology 20 (2005) 33-48. 2008.
Melbye, T. Ve Garshol, K.F. (2000). Sprayed Concrete for rock support (8. baskı).İsviçre
Morgan, D.R.; Columbia, B., Shotcrete Guides, and Specifications, Shotcrete Magazine,2000, pp. 8-11.
Nanthagopalan P, Santhanam M. (2010) A new empirical test method for the optimisation of viscosity modifying agent dosage in self-compacting concrete. Mater Struct;43(1–2):203–12.
Nöldgen M., Riedel W., Thoma K., Fehling E. "Properties Of Ultra High Performance Concrete (Uhpc) In Tension At High Strain Rates" VIII International Conference on Fracture Mechanics of Concrete and Concrete Structures, pp. 1-13.
Özdoğan M. Y, (2009) "Yeraltı Yapılarında Püskürtme Beton Ve Dolgu Dġzaynı",Yüksek Lisans Tezi, Dozuk Eylül Üniversitesi.
Pei R., Liu J., Wang S. (2015) Use of bacterial cell walls as a viscosity-modifying admixture of concrete. Cement & Concrete Composites 55, 186–195.
Simsek O. (2012) Beton ve Beton Teknolojisi.
Schallom, R.; Ballou, M., ASA, (2003) What you need to know about wet-mix shotcrete.
Saak AW, Jennings HM, Shah SP. (2001) New methodology for designing selfcompacting concrete. ACI Mater J;98(6).
Tan H.S., Chan R., Poon K.J., Chng D., "VIII International Conference on Fracture Mechanics of Concrete and Concrete Structures", VIII International Conference on Fracture Mechanics of Concrete and Concrete Structures pp:1-15.
Tai Y.S., Chu T.L., Hu H.T., Wu J.Y., (2011) "Dynamic response of a reinforced concrete slab subjected to air blast load", Theoretical and Applied Fracture
Mechanics 56, 140–147.
Ulzurrun, Gonzalo SD, and Carlos Zanuy. (2017) "Enhancement of impact performance of reinforced concrete beams without stirrups by adding steel fibers."Construction and Building Materials 145: 166-182.
Vu-Bac, N., Nguyen-Xuan, H. B., Chen, L., Bordas, S., Kerfriden, P., Simpson, R.N., ... & Rabczuk, T. (2011). A node-based smoothed extended finite element method(NS-XFEM) for fracture analysis. Computer Modeling in Engineering and Sciences,73(4), 331.
W. Kusterle, K. Eichler, (1997) Tests with rebound behaviour of dry-sprayed concrete,Tunnel 5, 43– 51.
Wei, W., & Yang, Q. (2016). A Finite Element Procedure for Analysis of Chemo-Mechanical Coupling Behavior of Hydrogels. CMES-COMPUTER MODELING IN ENGINEERING & SCIENCES, 112(1), 33-58.
Yurdakul, Ş. (2001) Püskürtme Beton Teknolojisinin TTK Ocakları Ana Galerilerinde Uygulana bilirliğinin Araştırılması, Yüksek Müh. Tezi, ZKÜ Fen Bilimleri Enstitüsü,Maden Müh. Anabilim Dalı, Zonguldak, 221 s.
Abaqus 6.11 Documentation User’s Manual
 Computer Modeling In Engineering&Sciences2017年2期
- Computer Modeling In Engineering&Sciences的其它文章
- TRISim: A Triage Simulation System to Exploit and Assess Triage Operations for Hospital Managers- Development, Validation and Experiment -
- Plane Vibrations in a Transversely Isotropic Infinite Hollow Cylinder Under Effect of the Rotation and Magnetic Field
- Uniform Query Framework for Relational and NoSQL Databases
- Deformation and failure analysis of river levee induced by coal mining and its influence factor
- Devanagari Handwriting Grading System Based on Curvature Features
- Local and biglobal linear stability analysisof parallel shear flows