Co—movements and Spillover Effects across RMB Interest Rate Swaps and Non—Deliverable Interest Rate Swaps
刘慧+曾美君


【Abstract】This paper is to explore the co-movement effect and the spillover effect between the on-shore Interest Rate Swaps market and the off-shore Non-deliverable Interest Rate Swaps.This paper uses Granger causality tests and BEKK-GARCH(1,1)model to selected series of IRS and NDIRS returns with terms of 3month,6month,9month and 1year from Dec.13,2010-Dec.18,2015.
【Key words】IRS and NDIRS returns;Co-movement effect;spillover effect
1 Backgrounds,literature review and contributions
1.1Backgrounds and literature review
The relationship between the financial markets mainly lead the financial crisis from one market to another,and this relationship consists of two important parts,co-movement effects and volatility spillover effects.
A lot of previously examinations were concentrated on the stock markets,bond markets and the foreign exchange markets.Lin et al.(1994)shows that the New York stock market and the Tokyo stock market have spillover effects to each other.Christiansen(2007)shows that there is no co-movement effect between the Europe bond market and the US bond market.And some researches were focused on the co-movements and spillover effect between the derivative market and the spot market or the different derivative markets.
2 Data and methodology
2.1Data and preliminary statistics
Data for the tests are RMB IRS and NDIRS with terms of 3month,6month,9month,and 1 year from Dec.13th,2010 to Dec.18th,2015.All the swaps are targeted on RMB 7-day repo rate.We chose these swaps because they have relatively higher trading volumes than others.All the data come from Bloomberg.We calculate the returns of the swaps as equation(1).
Xi,t=100×(lnRi,t-lnRi,t-1)
(1)
Xi,t is the return of the swap,Ri,t is the bid price of the swap,i is the kind of the swaps with different terms,3 month,6 month,9 month,1 year.We use IRS3M,NDIRS3M to denotes the returns of on-shore IRS and off-shore NDIRS with the term of 3 months,and it is represented similarly to other different terms.
2.2Methodology and Model
2.2.1Unit Root Test and Granger Causality Test
Granger causality test was used to evaluate the co-movement between the IRS market and NDIRS market.Unit Root tests was used to assure the stationary of the time-series data.
2.2.2BEKK-GARCH(1,1)model
We estimate the significance of the coefficient of variance equation by applying the BEKK-GARCH(1,1)model,and Wald tests help to verify the directions and strength of the spillover effects.
The BEKK-GARCH(1,1)model is presented as follows:
Ht=CC′+Aεt-1εt-1′A′+BHt-1B′;
εt=(ε1,t,ε2,t)′;
Ht=h11,t h12,th21,t h22,t;C=c11 0c21 c22;
A=α11 α12α21 α22;B=β11 β12β21 β22
(2)
In Equation(2),A is the coefficient matrix of the ARCH term;B is the coefficient matrix of the GARCH term.Equation(2)can be transferred to the equation(3a)-(3c).
h21,t=c11c12+α11α12ε21,t-1+(α11α22+α12α21)ε1,t-1ε2,t-1
+α12α22ε22,t-1+2β11β12h11,t-1+(β11β22+β12β21)+β12β22h22,t-1
(3a)
h11,t=c211+α211ε21,t-1+2α11α11ε1,t-1ε2,t-1+α211ε22,t-1
+β211h11,t-1+2β11β12h12,t-1+β212h22,t-1
(3b)
h22,t=c221+c222+α221ε21,t-1+2α21α22ε1,t-1ε2,t-1+α222ε22,t-1
+β221h11,t-1+2β21β22h12,t-1+β222h22,t-1
(3c)
We give three hypotheses:
Hypothesis 1:there is no spillover effect between the IRS market and NDIRS market.
H0:α12=β12=α21=β21=0
Hypothesis 2:NDIRS market has no spillover effect to the IRS market.
H0:α21=β21=0
Hypothesis 3:IRS market has no spillover effect to NDIRS market.
H0:α12=β12=0
2.2.3DCC analysis
We analyze the dynamic conditional correlation of the variances by calculating the DCC coefficient.
ρ=h12,th11,th22
(4)
3 Empirical Analysis
3.1ADF test and Granger Causality test
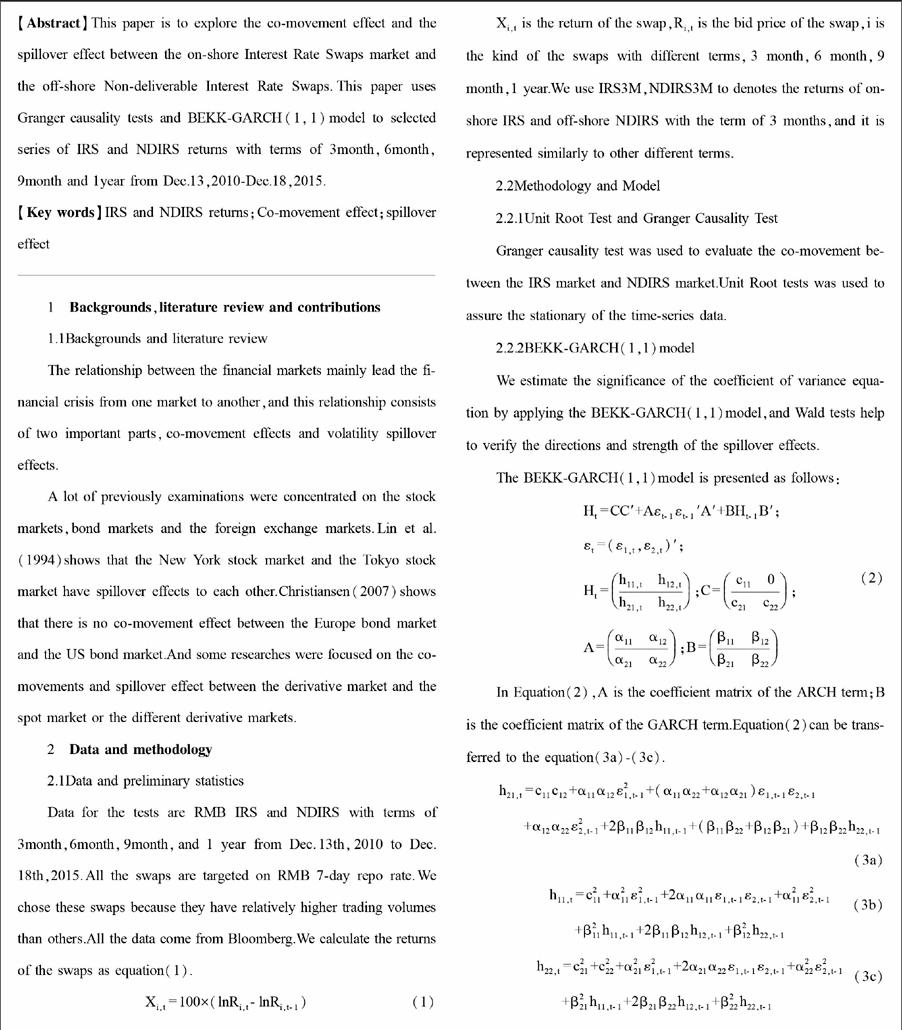
Use ADF test to test the stationary of the time series.The results in Table 2 show that all series we used are stationary.
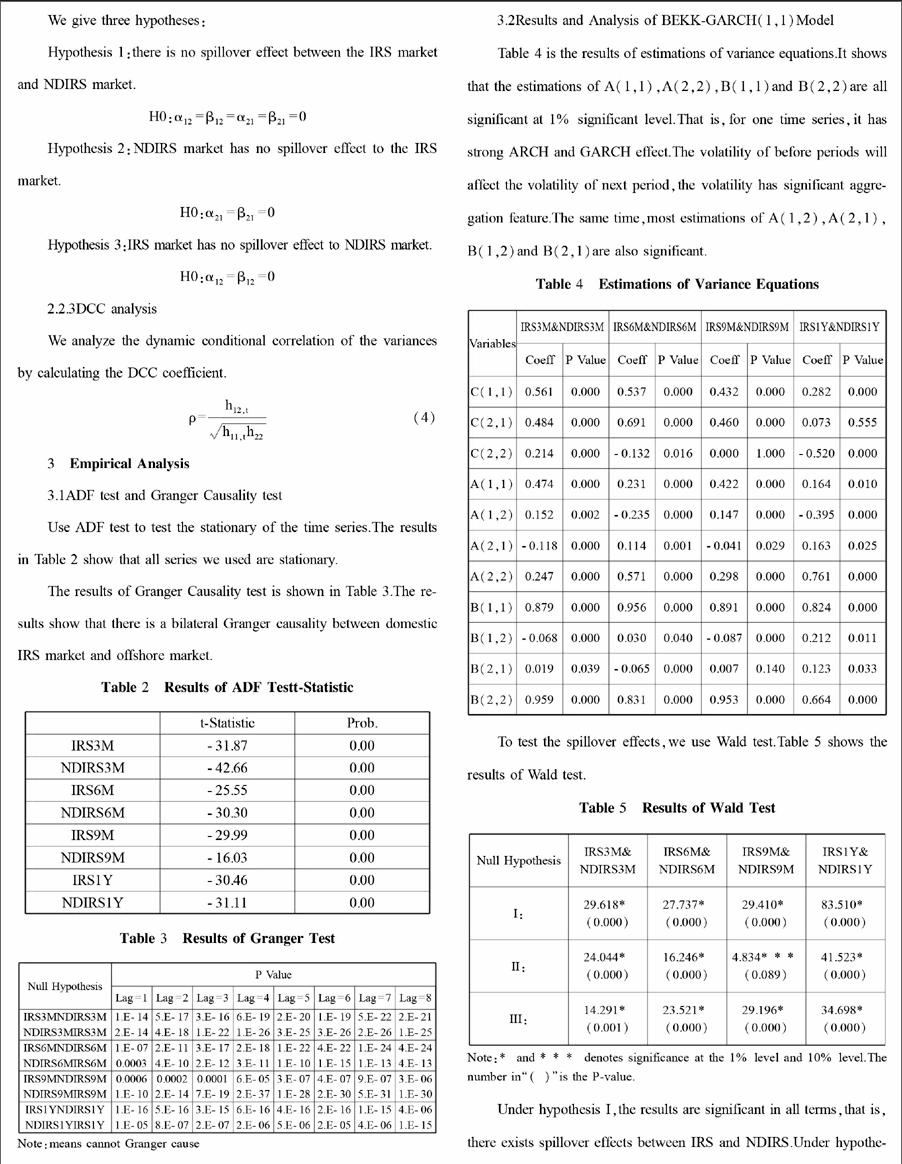
The results of Granger Causality test is shown in Table 3.The results show that there is a bilateral Granger causality between domestic IRS market and offshore market.
3.2Results and Analysis of BEKK-GARCH(1,1)Model
Table 4 is the results of estimations of variance equations.It shows that the estimations of A(1,1),A(2,2),B(1,1)and B(2,2)are all significant at 1% significant level.That is,for one time series,it has strong ARCH and GARCH effect.The volatility of before periods will affect the volatility of next period,the volatility has significant aggregation feature.The same time,most estimations of A(1,2),A(2,1),B(1,2)and B(2,1)are also significant.
To test the spillover effects,we use Wald test.Table 5 shows the results of Wald test.
Under hypothesis I,the results are significant in all terms,that is,there exists spillover effects between IRS and NDIRS.Under hypothesis II,the results mean the NDIRS have spillover effects to IRS.Under hypothesis III,the results means the IRS have spillover effects to NDIRS.
A strong relationship exists between IRS and NDIRS,the information of any market will affect another market.
3.3Analysis of Dynamic Conditional Correlation(DCC)
Use variance and covariance series which come from the BEKK-GARCH(1,1)model,we calculate the DCC.
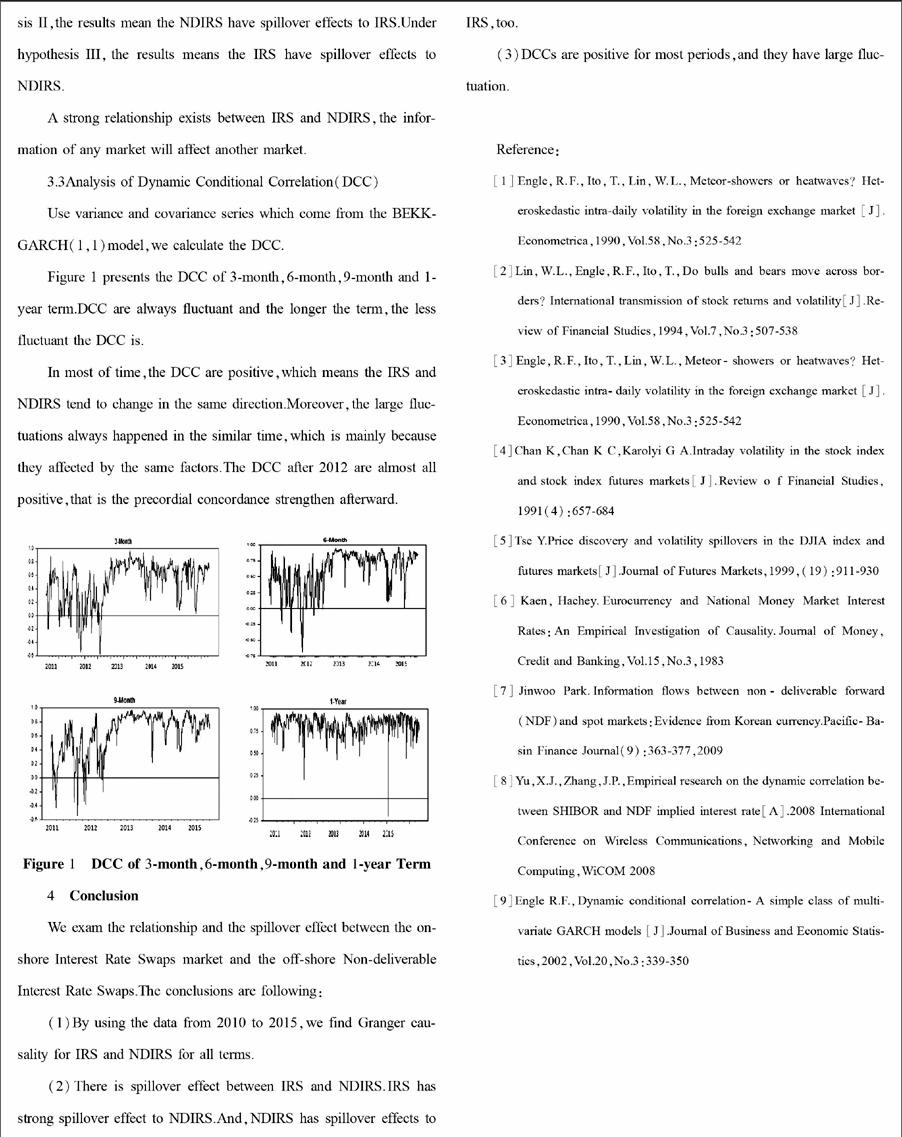
Figure 1 presents the DCC of 3-month,6-month,9-month and 1-year term.DCC are always fluctuant and the longer the term,the less fluctuant the DCC is.
In most of time,the DCC are positive,which means the IRS and NDIRS tend to change in the same direction.Moreover,the large fluctuations always happened in the similar time,which is mainly because they affected by the same factors.The DCC after 2012 are almost all positive,that is the precordial concordance strengthen afterward.
Figure 1 DCC of 3-month,6-month,9-month and 1-year Term
4 Conclusion
We exam the relationship and the spillover effect between the on-shore Interest Rate Swaps market and the off-shore Non-deliverable Interest Rate Swaps.The conclusions are following:
(1)By using the data from 2010 to 2015,we find Granger causality for IRS and NDIRS for all terms.
(2)There is spillover effect between IRS and NDIRS.IRS has strong spillover effect to NDIRS.And,NDIRS has spillover effects to IRS,too.
(3)DCCs are positive for most periods,and they have large fluctuation.
Reference:
[1]Engle,R.F.,Ito,T.,Lin,W.L.,Meteor-showers or heatwaves? Heteroskedastic intra-daily volatility in the foreign exchange market [J].Econometrica,1990,Vol.58,No.3:525-542
[2]Lin,W.L.,Engle,R.F.,Ito,T.,Do bulls and bears move across borders? International transmission of stock returns and volatility[J].Review of Financial Studies,1994,Vol.7,No.3:507-538
[3]Engle,R.F.,Ito,T.,Lin,W.L.,Meteor-showers or heatwaves? Heteroskedastic intra-daily volatility in the foreign exchange market [J].Econometrica,1990,Vol.58,No.3:525-542
[4]Chan K,Chan K C,Karolyi G A.Intraday volatility in the stock index and stock index futures markets[J].Review o f Financial Studies,1991(4):657-684
[5]Tse Y.Price discovery and volatility spillovers in the DJIA index and futures markets[J].Journal of Futures Markets,1999,(19):911-930
[6]Kaen,Hachey.Eurocurrency and National Money Market Interest Rates:An Empirical Investigation of Causality.Journal of Money,Credit and Banking,Vol.15,No.3,1983
[7]Jinwoo Park.Information flows between non-deliverable forward(NDF)and spot markets:Evidence from Korean currency.Pacific-Basin Finance Journal(9):363-377,2009
[8]Yu,X.J.,Zhang,J.P.,Empirical research on the dynamic correlation between SHIBOR and NDF implied interest rate[A].2008 International Conference on Wireless Communications,Networking and Mobile Computing,WiCOM 2008
[9]Engle R.F.,Dynamic conditional correlation-A simple class of multivariate GARCH models [J].Journal of Business and Economic Statistics,2002,Vol.20,No.3:339-350

