Capital Market Analysis
2017-03-30 23:58刘娇姜雷鸣邢诗雨
商情 2017年5期
关键词:雷鸣
刘娇+姜雷鸣+邢诗雨

LIU Jiao JIANG leiming XING shiyu Mehmet Burak OKTEM
Abstract:The purpose of this paper is to test whether the capital asset pricing model (CAPM) is valid in two Chinese stock markets. Both STATA and EXCEL software were used on account of processing the empirical data (samples) available for Shanghai and Shenzhen stock exchanges. Additionally, this paper adopts the single index model to estimate the beta coefficient of individual stocks as well as cross-section tests to analyze the relationship between expected stock returns and beta coefficient.
1.Introduction
Capital Asset Pricing Model (CAPM) is developed by American scholars Sharp (1964) and Lintel (1965) on the basis of Asset Portfolio Theory. The major objective of CAPM is to set appropriate price for securities traded in the market. Nevertheless, models not only used for pricing market securities but also for determining the expected return of those assets.
According to the Modern Asset Portfolio Theory, any portfolio traded in the market has the potential to be exposed to two types of risks which are defined as, systematic and unsystematic risks (Culetu, 2012). Systematic risks are generated by overall economic operations, such as inflation, employment, economic crisis and so on. On the other hand, unsystematic risks are associated with the nature of assets. Systematic risks cannot be eliminated for any asset portfolio within a market, however, unsystematic risks can be reduced significantly by adding appropriate securities in the portfolio and even can be eliminated. In this point, CAPM is a very useful model for pricing systematic risks and computing expected returns of assets in defined market. Currently, application of CAPM is widely used in investment banking and corporate finance (Chrysafis, 2012). However, CAPM is not free from shortcomings. The model ignores several price affecting factors, restricted by many assumptions and simplifies the financial complexity of the real world.
This paper will examine the validity of CAPM in Chinese stock markets. The research is built upon the regression analysis of all stocks traded in Shanghai and Shenzhen stock exchange, excluding the bias stocks, in order to provide reliable results both for investors and literature. This paper is divided into three parts. Firstly, background information about CAPM delivered in the literature review section. Secondly, the data collected for testing the validity of CAPM in Chinese stock markets. Finally, results of the analysis has interpreted and inferred in the conclusion part.
2.Literature Review
Similar to other models in the literature, CAPM has also developed for minimizing their rational assumptions on security returns and risk of the market which can lead investors expectations seriously deviate from the actual market conditions. Therefore, the aim of this model, just like the other ones, is to reduce irrational assumptions and feed the decision making process with a rational theoretical background. Prior to CAPM, Markovitz found the Modern Portfolio Theory in 1952 with the objective of optimizing the expected return of a portfolio and confining the level of risk (Bodie et al, 2014). However, the theorys excessive input requirements make it difficult to apply compared to CAPM.
Besides, some scholars examined and modified CAPM. Sharpe (1965) made a first study related to this kind of verification. He selected 34 American mutual funds as the sample, calculated and made a regression analysis of the annual average return and its standard deviation of each fund from 1954 and 1963, and found the approximately linear relationship between average return and β. Black, Jensen (1972) verified the stocks of all listed companies of American Stock Exchange (AMEX) from 1931 to 1956, proving the positive correlation between average stock return and β, and the influence of unsystematic risks on return. Fama and Macbeth (1973) carried out the verification by multiple linear regression model (later known as FM model), and found that there was a linear relationship between average return and β as described by CAPM.
On the other hand, CAPM has developed and mostly tested in the western world. Applicability of the model has queried by several researchers in Chinese markets. Gu & Liu (2007) took the weekly closing prices of shares in Shenzhen stock market from 2000 to 2005 as the research object, and made time series and cross-section regression tests by the methods of OLS and SML. Their research results demonstrated a weak linear relationship between average stock return and systematic risks which contradicts with the CAPM. Furthermore, Gao & Tao (2007) tested 100 shares from Shanghai composite index from 2004 to 2006 as the market portfolio by equidistant sampling, and divided the sample into three periods by combining the methods of BJS and FM to build an investment portfolio, which scattered a large majority of unsystematic risks and increased the proportion of systematic risks of the portfolio in total risks.
China is a rapidly changing and developing country and reflects this change in every aspects of the economy. Nonetheless, findings of the previous research (mentioned in the paragraph above) on two different Chinese stock markets contradicts with the CAPM, they cover relatively old periods of Chinese markets compared with the speed of change in the country. Hence, there is still need for an examination whether CAPM is valid and applicable in recent market conditions of China. This research will take the responsibility to examine the validity of CAPM in two Chinese stock markets at the same time and cover more recent time periods for regression analysis with the aim of filling the gap in the literature.
3.Introduction to CAPM
CAPM mainly represents the relationship between a single security or portfolio and the systematic risk return, i.e. the return of a single portfolio is equal to the sum of the risk-free risk return and the market risk premium (Zabarankin, 2014). Its formula is as follows:
E(Ri)=Rf+βi[E(Rm)-Rf]
βi=COV(Ri,Rm)/σ2m
Where represents the expected return of an individual stock or portfolio, represents the expected return of the market, and represents the systematic risk coefficient of a portfolio.
The basic assumptions of CAPM are as follows:
(1) There are numerous investors, and the wealth of each investor is negligible compared with the total wealth of all investors. (2) All investors plan their investment behaviors during the same security holding period. (3) The investment scope of investors is limited to the assets traded on the public financial market. Moreover, the number of the assets is fixed. Meanwhile, all assets are tradable and completely divisible. (4) There exist risk-free assets, and investors are able to borrow or lend money without amount limit at a risk-free interest rate. (5) The market is perfect, that is, investors dont have to pay taxes, there is no security transaction cost such as commissions and service charges, and no rules or restrictions limit short purchase. (6) Investors are rational and risk averters who seek the minimization of the standard deviation of the investment portfolio, namely, risk minimization. (7) With identical viewpoints for security evaluation and economic situation, all investors invest in the same order no matter how the security prices change. (8) The capital market is frictionless and has no information cost, and all investors can obtain information simultaneously.
4.Data Collection
This paper collects all the data from CSMAR. Firstly, this paper used all stocks traded between the dates of January 01, 2008 – December 31, 2015 in Shenzhen and Shanghai Stock Exchanges as research sample, excluding the B stocks and the companies newly listed between given dates, in order to avoid misleading biased outcomes caused by sample selection, and make the results more reliable.
In this study, the sample data include the monthly regression of each individual share. In the formula ≈pt . is the stock price of the current period, and pt-1 is the stock price of the last period. In addition, the risk-free interest rate refers to the interest rate gained from a risk-free investment. After taking full account of the research content and data sources in this paper, the short-term treasury bond rate is adopted as the risk-free interest rate.
5.Methodology
This research use the EXCEL and STATA software to make data analysis whether the CAPM model is efficient in two Chinese stock markets or not. The study holds the data analysis in two major steps which the first step computes Time-series followed by Cross-section test.
5.1Time-Series Test
The time series test covers the period between 2008 and 2015 for this research. The results give coefficients (β) of 720 individual stocks and calculated by the formula:Rit=αi+βRmt+εit. In the next part, the data has been divided into 10 subgroups in order to provide more reliable and manageable results
5.1.1 Calculate the β of Individual Stock
As mentioned in the previous section, the β was calculated by the given formula in this research:
Rit=αi+βRmt+εit
(Rit: return rate of individual stock, Rmt: the return rate of market, εit: residual. αi: intercept)
Table 1 Demonstrates the Individual Stock Regression Results
Per the Table 1, results clearly show that the β coefficient of individual stocks are located around 1 and almost each calculated Alpha (α) value is closed to zero. Then all the data get through the hypothesis testing. The D-W is often around 2 which means there is no serial connection between individual stock return and market return.
5.1.2 Calculate the β of Portfolio Stock
As mentioned in the previous section 720 individual stocks traded in both Shanghai and Shenzhen exchanges are analysed. In this section these individual stocks has divided into ten groups evenly, which is 72 stocks per portfolio. Additionally, the average returns of each portfolio has computed by guidance of the given model: Rpt=αp+βpRmt+εpt. The return of portfolios have calculated by the given formula:Rpt=(∑Rit)/N .
Table 2 The Regression Results of Portfolio
The results show that all portfolio betas (β) are greater than zero. Positive portfolio beta (β) defines that the portfolio returns of this research has a positive relationship with market return in the given period, in other words portfolios are moving with the same direction of the market. Besides, D-W values of the portfolios are clustered around 2 which means the risk premium of portfolio are located within the first-order autocorrelation. Finally, R2 values of ten portfolios are in between 0.7 to 0.9 and get through F-test which shows that there is a considerable linear relationship. Hence, β and σ values are appropriate to be used for the cross-section tests.
5.2 Cross-Section Test
5.2.1 Test the relationship between return and risk
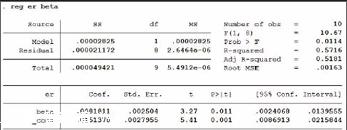
Here we introduced two models to test the CAPM in the cross-section portfolios. The first model is to test the relationship between Beta and Expected Return of the ten portfolios, the regression equation is Rpt=r0+r1βpt+εp(Equation 1).
The null hypothesis of this research is H0: r1= 0.If CAPM holds in the ten portfolios, the coefficient r1 should be significant different from 0, or we need to reject the null hypothesis.
The findings illustrated in the following table shows that P value is smaller than 0.05 which means null hypothesis should be rejected. Therefore, there is a linear relationship between portfolio return and β coefficient. Hence, the result proves that CAPM is valid and applicable for Chinese stock markets.
5.2.2 Cross-Section Tests for CAPM
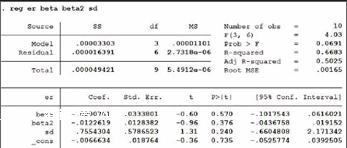
In favor of making the result more convincing, unsystematic risk has added to the model to find out whether the systematic risk is the sole factor has impact on stock prices. The null hypothesis of this research is H0: r0= r1=r2= r3=0. The model uses the regression equation below:
Rp=r0+r1βp+r2βp2+r3σ+εp ( Equation 2).
(Rp:portfolio return.α:standard deviation of residual. r0,r1,r2,r3: parameters.)
The findings illustrated in the table above shows that P value is more than 0.05 which means null hypothesis should be accepted. Hence, there is no relationship between other factors and stock returns.
Compare the results of Model 1 and model 2, it is obvious that the expected return is only linear correlated to the beta of portfolios. Once the model add more variables such as squares of beta, or the residual standard deviations, the parameters of regression will be insignificant, and the relationships will not hold. The two regressions fully show the evidence of CAPM hold in China Stock markets.
Conclusion:
In this research, we selected all the stocks traded (excluding the bias stocks) in Shanghai and Shenzhen stock exchanges between 2008 and 2015. Different than the previous studies (Literature Review) examined CAPM in Chinese stock markets, this study analyzed both stock markets at the same time and selected a broad and recent time period. Monthly analysis of 720 individual stocks within the given time horizon showed that it eliminates the other factors affecting stock returns and shows a linear relationship among β coefficient and stock returns. Therefore, the research proves that CAPM is valid and applicable in Chinese stock markets. The result of research can also interpreted as Chinese stock markets gained more maturity compared with earlier years and became more predictable.
References:
[1]Brennan, M. (1970). Taxes, market valuation and corporate financial policyNational Tax Journal, 23 (4): 417-429.
[2]Black, F. (1972). Capital Market Equilibrium with Restricted Borrowing. The Journal of Business, 45(3), 444-455.
[3]Black, F., & Scholes, M. (1973).The Pricing of Options and Corporate Liabilities.Journal of Political Economy, 81(3), 637-654.
[4]Bodie, Z., Kane, A.,& Marcus, AJ. (2014). Investments. (Asia Global ed., McGraw-Hill/Irwin series in finance, insurance, and real estate). New York.
[5]Gao, Y., &Tao,Y. (2007). The empirical research of CAPM in Shanghai stock market.Economy and management, 11, 77-81.
[6]Gu, RB., & Liu, YH. (2007). The empirical research of CAPM in Shenzhou stock market.Journal of Anhui Univeristy (Natural Science), 2, 17-20.
[7]Chrysafis, K. (2012). Corporate investment appraisal with possibilistic CAPM.Mathematical And Computer Modelling, 55(4), 1041-1050.
[8]Culetu, D. (2012). Testingthe CAPM(Capital Asset Pricing Model) on Bucharest Stock Exchange. Metalurgia International, 17(8), 204-206.
[9]Fama, E., & Macbeth, J. (1973). Risk, Return, and Equilibrium: Empirical Tests. Journal of Political Economy, 81(3), 607-636.
[10]Sharpe, W. F. (1964). Capital Asset Prices: A Theoryof Market EquilibriumunderCinditionsof Risk. Journal of Finance, 19(3), 425-443.
[11]Lintner, J. (1965). The Valuation of Risk Assets and the Selection of Risky Investments in Stock Portfolios and Capital Budgets.The Review of Economics and Statistics, 47(1), 13-37.
[12]Zabarankin, Pavlikov, &Uryasev.(2014). Capital Asset Pricing Model (CAPM) with drawdown measure.European Journal of Operational Research, 234(2), 508-517.
猜你喜欢
文艺论坛(2021年4期)2021-11-28
东坡赤壁诗词(2020年4期)2020-09-02
东坡赤壁诗词(2019年3期)2019-07-05
东坡赤壁诗词(2018年6期)2018-12-22
东坡赤壁诗词(2018年6期)2018-12-22
小猕猴学习画刊·下半月(2018年3期)2018-05-14
知识就是力量(2017年12期)2018-01-15
现代营销·经营版(2017年10期)2017-10-27
晚晴(2017年6期)2017-06-27
今古传奇·故事版(2017年4期)2017-03-24