
A Novel Two-Layer Model for Overall Quality Assessment of Multichannel Audio
2017-04-09 05:52JiyueLiuJingWangMinLiuXiangXieJingmingKuang
China Communications 2017年9期
Jiyue Liu, Jing Wang*, Min Liu, Xiang Xie, Jingming Kuang
School of Information and Technology, Beijing Institute of Technology, China The corresponding author, email: wangjing@bit.edu.cn
I. INTRODUCTION
Compared to the traditional two-channel stereo audio, the multichannel audio can provide hearing-optimized experiences with higher audio quality and better spatial effect. Thus it has been used extensively in many aspects such as real-time video conferences, 3D movie application, and 3D game playing. The wide application of multichannel audio calls for research to improve the technology of storage, transmission, compression, encoding and decoding of this novel kind of audio. Processing an audio file with different methods will impact the file in different ways. With the increasing requirements for the multichannel audio quality, it has become necessary to put forward new technology to minimize the variance of the output caused by different processing methods. In order to evaluate and optimize the performance of multichannel audio processing techniques, it is highly significant to assess the overall quality of the audio after processing.
There are two kinds of methods which can evaluate audio quality: subjective and objective assessments. Some subjective listening test standards such as ITU-R BS.1116-3 [1],ITU-R BS.1285-0 [2] and ITU-R BS.1534-3 [3] have been widely used in assessing all kinds of audio including the dual channel stereo and multichannel audio. Although formal listening tests still represent the “gold standard” [4], these subjective tests have shortcomings like time inefficiency and high monetary costs. Hence, objective tests are designed to solve these problems. However, the existing techniques cannot make a good assessment of multichannel audio’s quality. The most widely used audio quality evaluation model recommended by ITU-R BS.1387-1, also named as PEAQ [5] is able to process stereo and multichannel audio signals. But each channel is handled separately, which results in the lack of spatial characteristics and information between channels. Lately, more efforts have been made to establish objective models to evaluate audio quality of multichannel audio from the view of spatial information. Ref [4] proposed an objective measurement of perceived auditory quality in multichannel audio compression coding systems which firstly converts multichannel signals into binaural signals using Head Related Transfer Functions (HRTFs).Ref [6] extended and modified the standard PEAQ algorithm to measure two-channel stereo audio signals more accurately by introducing a binaural hearing model. Ref [7] proposed a mapping model to assess multichannel audio quality by employing a binaural auditory model as frontend to provide perceptually relevant binaural features for the reference and the test audio signals.
Most existing models just refer to one general indicator: the audio’s overall quality score, which brings about deficient results.Thus, in order to provide a more appropriate and accurate solution to the overall quality assessment of multichannel audio, this paper proposes a novel two-layer model set: the first layer outputs Audio Quality Score (AQS)and Spatial Perception Score (SPS), and the second layer outputs the Overall Object Score(OOS). In this model set, the AQS is derived from an improved PEAQ model called Audio Quality Objective Model based on MLR. This parameter can indicate the multichannel audio’s basic quality difference between the original audio and the distorted audio. The SPS is obtained through Spatial Quality Objective Model based on NN, and it can be described by the distortion of binaural space cues. These two kinds of attributes will also be marked in the subjective assessment to describe the subjective basic audio quality and spatial perception characteristics. Considering the limitation of formal subjective listening environment,this paper only designs a model based on the test of 2D multichannel audio, e.g. 5.1 channels audio, which is a kind of surround sound system that has been widely used so far. The prediction model set is trained and verified by formal listening tests of 5.1 channels audio under varying test conditions.
The rest of this paper is organized as follows. In Sect. 2, the method of subjective test is designed. Then Sect. 3 introduces the objective two-lawyer model. Section 4 shows the results of proposed method in evaluating 5.1 channels audio quality. Finally, Sect. 5 is a conclusion of this paper.
II. DESIGN OF SUBJECTIVE LISTENING TEST
2.1 Listening test database
The subjective test database includes many different kinds of audio types, e.g. natural sound, voice (both Chinese and English), music, etc. The audio in this database composes original clean audio signals. The distorted database consists of audio signals processed with different methods to simulate distortion that may happen in the actual situation in the processing of multichannel audio (in this paper mainly 5.1 surround sound). The audio signals processing include changing codec bit rates,band limitation, adding white noise, etc.
In the listening tests, seven different original 5.1 channels audio signals are selected to represent as many kinds of sounds as possible.Each audio signal’s sample rate is 48kHz.Other information about the test signals is described briefly in table 1. After processing,there are a total of 69 distorted audio signals in the distorted database, and then 70% of them (48 distorted audio signals) are selected for training models, and the others (21 distorted audio signals) for testing. The training database is used for fitting objective models and the testing database is for evaluating the accuracy of the model.
2.2 Test method
Before the start of the subjective test, 30 questionnaires were distributed to investigate the indicators that people pay attention to when they listen to multichannel audio. According to the results, almost all of the respondents agreed that the main factors affecting multichannel audio’s quality were basic audio quality and spatial perception quality. Consequently, these two indicators were adopted as the evaluation indexes in the subjective test.
In this paper, the design and the listening environment of the subjective test were strictly based on ITU-R BS.1116. The test procedure referred to the “double-blind triple-stimulus with hidden reference” in BS.1116-3 [1].Experienced listeners were selected in order to ensure the accuracy of test. Each listener heard three stimuli (“A”, “B” and “C”). The known reference signal was always available as source “A”. The hidden reference signal and the signal under test were simultaneously available but were “randomly” assigned to “B”and “C”, depending on the trial. All the tested 5.1 channels audio signals were reproduced from five full band and a low frequency band ONKYO studio monitors which were connected with a high quality sound card. The 5.1 channels studio monitors were allocated based on ITU-R BS.775-3 [8].
To improve the reliability of the subjective listening results, listeners were required to mark every audio with three parameters obtained from the questionnaires: subjective audio quality score, subjective spatial quality score and overall subjective score. The details of these parameters are described below.
Subjective Audio Quality Score (Y1) presents multichannel audio’s basic audio quality[3]. It was used for judging any and all detected differences in basic audio quality between the reference audio and the test audio.
Subjective Spatial Quality Score (Y2) measures multichannel audio’s spatial perception quality. It consists of two components:spaciousness (the extent of the space being portrayed), and envelopment (the sensation of being surrounded by sound) [9].

Table I Test audio included in the listening test database

Table II Five-grade impairment scale
Overall Subjective Score (OSS) describes multichannel audio’s overall feeling towards all aspects.
The subjective voting principle of these three parameters follows BS.1116. Details of the score’s grade scale are listed below in table 2.
A total of 24 listeners with musical accomplishment participated in the subjective listening test. Before the formal test, the subjects were pre-screened to exclude the people who were insensitive to the impairment of 5.1 channels audio quality, and to help listeners to get familiar with the types of test audio, quality range, test equipment and score levels at the same time. In the pre-screening, the distorted types of audio signals were the same as those in the formal test. After pre-screening, 12 listeners were excluded while the others were chosen to take the following formal test.
After the subjective test, t-test, which is a post-screening method proposed in ITU-R BS.1116 standard, was employed to ensure the accuracy of test results. The mean of differences of all the test audio signal scores marked by listeners around overall mean’st-distribution was used to construct a oneside confidence interval whose confidence is 95%. If a listener’s interval upper limit is not less than zero, then all of this listener’s data would be eliminated. Through post-screening,4 listeners’ data were excluded, and the mean of the other 8 listeners’ data was used to build the model. Table 3 shows the 8 listeners’ t-test results.

Table III T-test of subjective test results
In the table, Sum means the sum of subjective scores’ difference between distorted audio and original audio of each listener, Mean and Variance are the average value and variance of Sum respectively, t-value is the t-test results.
III. DESIGN OF THE TWO-LAYER MODEL FOR OVERALL OBJECTIVE QUALITY TEST
3.1 Brief of the model set
The model set of the overall quality assessment of multichannel audio consists of two layers. In the first layer, two parameters are extracted from two objective models. One parameter is the Objective Audio Quality Score,corresponding to the subjective audio quality score, which aims to reflect the basic audio quality of the test audio. The other parameter is the Objective Spatial Quality Score, corresponding to the subjective spatial quality score, which aims to reflect the spatial perception quality (spaciousness and envelopment)of the test audio. Through the overall objective model in the second layer, the overall objective quality score of the whole predicting model set can be obtained.
All of the models in the model set are trained and tested by the subjective testing data set. The audio signals are used for extracting the model’s input parameters, and the scores are used as the model’s output for training and testing.
3.2 First layer of the model
3.2.1 Audio quality objective parameters and model
Since PEAQ is a known and reliable method to measure single channel signals [6], it has been widely used in the area of audio processing. But for 5.1 channels audio and other multichannel audio, if the PEAQ scores of each channel are simply averaged to get the audio quality score, the inter-channel cues will be overlooked, which will lead to a fairly poor matching between objective results and actually subjective audio quality.
To solve this problem, we build an audio quality objective model, using each channel’s PEAQ and subjective audio quality scores.In this paper, we focus on 5.1 channels audio which contains 6 channels: fl(front left), FR(front right), FC (front center), LFE (low frequency effects), BL (back left), and BR (back right). The objective difference grade values of each channel are computed by PEAQ tool.The Objective Difference Grade (ODG) is the variable output by the PEAQ method and corresponds to the Subjective Difference Grade(SDG) in the subjective domain [5]. Since the ODG values ranging from 0 to -4, correspond with subjective audio quality scores ranging from 1 to 5, the ODG values were converted to PEAQ using the expression below:

For each test audio signal, there is a six-vector representing every channels’ PEAQ score (FL, FR, FC, LEF, BL, BR), which we call as X1.

To map X1to the corresponding Y1which was gained from subjective test to acquire a model (Audio Quality Objective Model), Multiple Linear Regression (MLR) was employed.MLR is a multivariate statistical technique for examining the linear correlations between two or more independent variables and a single dependent variable. Since X1is a six-vector and Y1is a single variable, it is feasible to use MLR. The mapping formula is shown below:
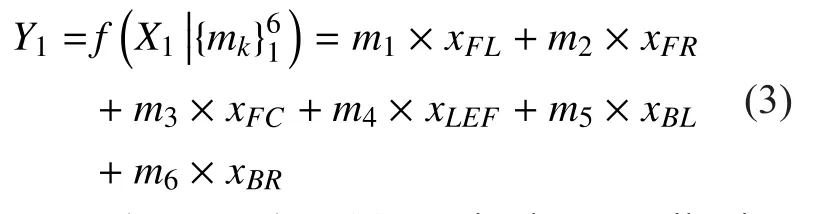
In the equation (3), mkis the contribution coefficients (weight) of each channel’s PEAQ score in this Audio Quality Objective Model.As each of the elements in X1has a weight in this model, it’s possible to find the contribution of each channel, and then obtain the overall audio quality AQS.
3.2.2 Spatial quality objective parameters and model
The spatial impression of multichannel audio can be expressed by the spatial distortion degree which is computed from the spatial parameters’ difference between the original signal and the distorted signal. While a person is listening to the audio, his brain will obtain the spatial information through analyzing three indexes: Inter-aural Phase Difference (IPD,the same with ITD (Inter-aural Time Differences)), Inter-aural Level Difference (ILD, the same with IID (Inter-aural Intensity Differences)) and Inter-aural Coherence (IC). They are important to the positioning of spatial sound image according to the analysis of the effectiveness of the various spatial factors in indoor space, outdoor space, near-field, far-field and multiple sound sources [10].
The directions of the sound source in the horizontal (2D) plane can be expressed by ILD and IPD, and the distance of sound sources can be expressed by ILD and intensity of sound sources [11]. These factors belong to the inter-aural difference.
Because the inter-channel difference corresponds to the inter-aural difference for the multi-channel audio signal, the former parameters are denoted as Inter-Channel Phase Difference (ICPD), Inter-Channel Level Difference (ICLD), and Inter-Channel Coherence(ICC), respectively. Therefore, it can restore the original spatial information based on these parameters for multichannel audio signals.These three space cues have been successfully used in BCC coding [12] and MPEG Surround[13]. In this paper, we use ICPD, ICLD and ICC to describe the surround effects of 5.1 channels audio.
For the sub-band b, A1(k) is the spectrum coefficient of the input frame in one channel;A2(k) is the spectrum coefficient of the input frame in another channel; * denotes complex conjugation; Abis the number of spectral coefficients in sub-band b. These three spatial parameters are defined below.
ICPD is defined as the phase differences(dimensionless) between the selected two channels in equation (4).

ICLD is defined as the level differences between the selected two channels. It is defined in the logarithmic domain in accordance with human auditory system in equation (5).

ICC is defined as the normalized cross-correlation coefficient (dimensionless) of the two channels in equation (6).

The set of FL-FR, BL-BR, FC-FL, FC-FR is chosen because LEF is a separate channel[9] and contributes little to spaciousness and envelopment, while FC interacts a lot with fland FR. For 5.1 channels audio, these combinations lead to twelve perceived spatial parameters Pijfor each audio.

The average spatial distortion between the original signal and the distorted signal is calculated by using the Euclidean distance as follows.

P1stands for original audio’s spatial parameters and P2stands for the distorted one.D (X2) is the average distortion of T frames,which is used to reflect objective spatial perception audio quality corresponds with subjective audio perceive score (Y2).
The objective spatial perception model is obtained by mapping X2to Y2. Because the human auditory system is nonlinear, we proposed to use Neural Network (NN) to achieve better fitting effect. The results in table 4 reflect that compared with general linear regression, NN is a more effective way to achieve this model.
The number of hidden nodes of NN model can be roughly estimated by the following empirical formula.

In the equation (9), m is the number of the hidden nodes and n is the number of inputting nodes. As this model has 12 inputting nodes,the number of the hidden nodes is possibly 3,4 or 5.
Through a lot of experiments, finally 4 was chosen for the NN model as the number of the hidden nodes because 4 hidden nodes could provide enough goodness of fit and low complexity.
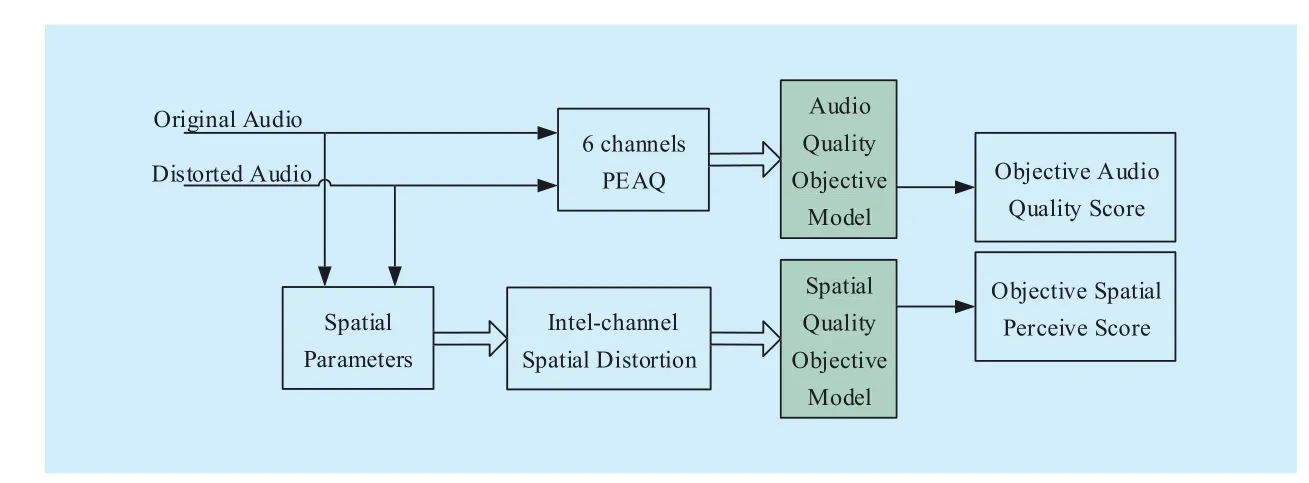
Fig. 1 The diagram of first layer
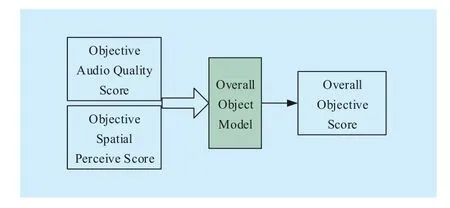
Fig. 2 The diagram of second layer
The diagram of the first layer is shown in figure 1.
3.3 Second layer of the model
As subjective and objective parameters have been calculated above, the next step is to build a final quality model to get the overall objective score.
To establish this model, subjective parameters Y1and Y2are used as independent variables. Mapping them to OSS by MLR, the model will be obtained from the following equation.

Here, OOS is the dependent variable of Objective Overall Score; ƒ is the MLR tool which has been obtained in section 3.2.1; AQS is one of independent variables of the known Audio Quality Score (subjective or objective);SPS is the other independent variable of the known Spatial Perceive Score (subjective or objective); ε is an error correction constant.
The diagram of the second layer of the whole model is shown in figure 2.
IV. EXPERIMENT RESULTS
4.1 Algorithm performance evaluation parameters
The algorithms’ performance is evaluated by using the correlation coefficient ρabbetween predicted score aiand subjective score bi,which is defined as
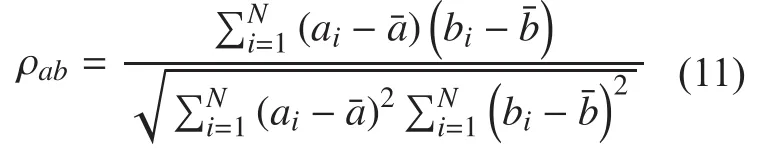
In the equation (11), a and b are the two variables to be evaluated;andare the respective mean value of a and b; N is the number of subjective scores.
How well the data fit a statistical model is indicated by the coefficient of determination R2. It reflects the proportion of the variance in the dependent variable that is predictable from the independent variable. An R2of 1 indicates that the regression line perfectly fits the data,while an R2of 0 indicates that the line does not fit the data at all.

Data measurement accuracy is assessed by Root Mean Square Error (RMSE). It represents the sample standard deviation of the differences between predicted values and observed values. Smaller RMSE means better accuracy.

Optimal Percentage (abbreviated as OP)quantitatively reflects the specific degree of ascension. Its value is determined by the following equation:

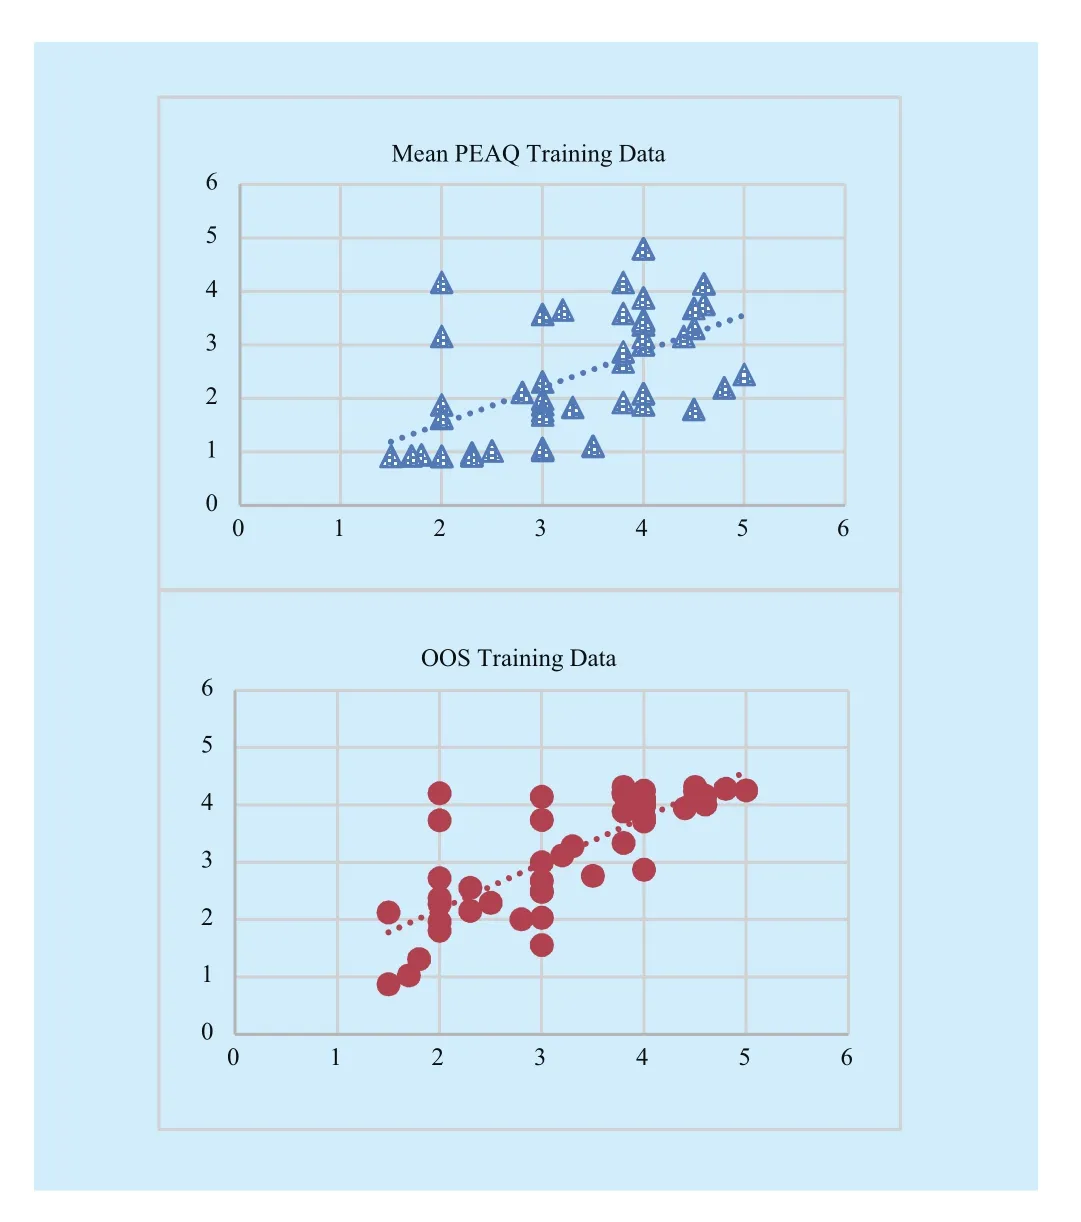
Here, p is the performance parameters of the traditional method and q is the performance parameters of the proposed method.OP should be expressed as a percentage. If q>p, OP represents the percentage ascension of the parameter to be evaluated between the traditional method and the proposed method;if q The Audio Quality Objective Model in this experiment is shown in equation (15). It was trained and tested by the results of subjective experiment. From this equation, it is easy to find that for the selected 5.1 channels audio,fland FR’s contribution (weight) to the basic quality is nearly equivalent, and the same is true with BL and BR. The model above using MLR tool shows better correlation with subjective scores than mean PEAQ scores, which can be seen in figure 3. In this and following figures, subjective scores are on the vertical x-axis while model’s predictive scores on the horizontal y-axis. If the trend line of scatters is closer to y=x, it indicates higher correlation between predictive scores and subjective scores. Fig. 3 The diagram of Audio Quality Objective Model’s performance Fig. 4 The diagram of Spatial Quality Objective Mode The Spatial Quality Objective Model in this experiment was built by NN. To prove that NN can lead to a better result, MLR tool was also used as a comparison. Table 4 reflects that NN leads to a better result. The structure of the NN model is shown in figure 4. To get the overall results, the objective AQS and objective SPS obtained in the first layer are put into the Overall Objective Model.Then the results were compared with the mean value of the PEAQ scores (Mean PEAQ) in figure 5 and table 4. OOS stands for the proposed method and Mean PEAQ stands for the conventional method by averaging PEAQ values among six channels. Figure 5 (a) and (b) show the scatter plot of the training data and testing data’s objectiveOOS and objective Mean PEAQ respectively.It is quite clear that the trend lines (dash lines)in OOS plot are aligned with the diagonal line more closely than that in Mean PEAQ plot,which means compared to mean PEAQ, OOS is more relevant with subjective score. This indicates that the proposed mapping model can provide a better performance. Table IV First layer model’s performance evaluation parameters The parameters in table 5 show that this proposed two-layer model can achieve great improvement compared to the conventional PEAQ method. Since the optimal percentage in Ref. [14] of the previous single layer model is 27.34% for ρab, it means that the layered structure can better simulate the judgment of human brain to obtain the overall quality of multichannel audio. The objective measurement method proposed in this paper is based on a two-layer model.Three parameters: AQS, SPS and the overall score are evaluated in the experiment. Subjective listening test is carried out by ITU-R BS.1116. Objective parameters’ mapping methods include MLR and NN. Fig. 5(a) The scatter plot of training data’s results Fig. 5(b) The scatter plot of testing data’s results Compared to the traditional average PEAQ method and previous single layer models,this two-layer model can not only improve goodness of fit between objective scores and subjective scores, but also make it possible to find out the basic quality and spatial quality of the audio to be tested, which is helpful to know about the factors affecting the overall quality of multichannel audio. Further studies will be done to increase the correlation degree between objective scores and subjective scores by introducing more attributes and designing more experiments. Table 5(a) Overall model’s performance evaluation parameters for training data Table 5(b) Overall model’s performance evaluation parameters for testing data The authors would like to thank the reviewers for their suggestions. The work in this paper is supported by the National Natural Science Foundation of China (No. 61571044,No.11590772, and No. 61473041). [1] ITU-R BS.1116-3, “Methods for the subjective assessment of small impairments in audio systems,” Geneva, Switzerland, 2015. [2] ITU-R BS.1285-0, “Pre-selection methods for the subjective assessment of small impairments in audio systems,” Geneva, Switzerland, 1997. [3] ITU-R BS.1534-3, “Method for the subjective assessment of intermediate quality level of coding systems,” Geneva, Switzerland, 2015. [4] C. Inyong, G. S. Barbara, B. C. Sang, S. Koeng-mo, “Objective Measurement of Perceived Auditory Quality in Multichannel Audio Compression Coding Systems,” Journal of the Audio Engineering Society, Vol. 56, pp. 3-17, 2008. [5] ITU-R BS.1387-1, “Method for objective measurements of perceived audio quality,” Geneva,Switzerland, 2001. [6] M. Schäfer, M. Bahram and P. Vary, “An extension of the PEAQ measure by a binaural hearing model,” Proc. Acoustics, Speech and Signal Processing (ICASSP), Vancouver, BC, pp. 8164-8168,2013. [7] Jan-Hendrik Fleßner, et al. “Quality assessment of multi-channel audio processing schemes based on a binaural auditory model,” Proc. 2014 IEEE International Conference on Acoustics, pp.1340-1344, 2014. [8] ITU-R BS.775-3, “Multichannel stereophonic sound system with and without accompanying picture,” Geneva, Switzerland, 2012. [9] T. Holman, “Surround Sound: Up and Running,”Burlingdon: Focal Press, 2008. [10] Breebaart, Jeroen, et al. “Parametric Coding of Stereo Audio,” EURASIP Journal on Advances in Signal Processing, pp 1-18, Sept, 2005. [11] C. Yang, R.M Hu, L.Y Su, et al. “A 3D audio coding technique based on extracting the distance parameter,” Proc. IEEE International Conference on Multimedia and Expo, pp 1-6, 2014. [12] C. Faller and F. Baumgarte, “Binaural cue coding: a novel and efficient representation of spatial audio,” Proc. Acoustics, Speech, and Signal Processing (ICASSP), 2002 IEEE International Conference on, Orlando, FL, USA, pp. II-1841-II-1844, 2002. [13] Breebaart J, Faller C. MPEG Surround[M]// Spatial Audio Processing: MPEG Surround and Other Applications. John Wiley & Sons, Ltd, pp 93-125, 2007. [14] J. Wang et al., “Objective Measurement of Spatial Audio Coding Quality Based on MNLR Mapping Model,” Proc. 2015 International Conference on Intelligent Information Hiding and Multimedia Signal Processing (IIH-MSP), Adelaide, SA, pp. 388-392, 2015.4.2 Results of the first layer


4.3 Results of the second layer(overall results)

V. CONCLUSIONS


ACKNOWLEDGEMENTS
- China Communications的其它文章
- A Privacy-Based SLA Violation Detection Model for the Security of Cloud Computing
- Empathizing with Emotional Robot Based on Cognition Reappraisal
- Light Weight Cryptographic Address Generation (LWCGA) Using System State Entropy Gathering for IPv6 Based MANETs
- A Flow-Based Authentication Handover Mechanism for Multi-Domain SDN Mobility Environment
- An Aware-Scheduling Security Architecture with Priority-Equal Multi-Controller for SDN
- Homomorphic Error-Control Codes for Linear Network Coding in Packet Networks