不同土壤水分条件下油松幼苗光合作用的气孔和非气孔限制*
——试验和模拟结果
2017-08-30 14:24郭文霞赵志江李俊清
林业科学 2017年7期
郭文霞 赵志江 郑 娇 李俊清
(1.北京林业大学森林培育与保护省部共建教育部重点实验室 北京100083; 2.中国林学会 北京100091;3.悉尼科技大学植物功能生物学和气候变化研究组 新南威尔士2007; 4.福建中咨工程咨询有限公司 福州 350003)
不同土壤水分条件下油松幼苗光合作用的气孔和非气孔限制*
——试验和模拟结果
郭文霞1,2,3赵志江4郑 娇1李俊清1
(1.北京林业大学森林培育与保护省部共建教育部重点实验室 北京100083; 2.中国林学会 北京100091;3.悉尼科技大学植物功能生物学和气候变化研究组 新南威尔士2007; 4.福建中咨工程咨询有限公司 福州 350003)
【目的】 了解不同土壤水分条件下油松幼苗叶片的气体交换特性及光合作用的气孔和非气孔限制,Ball-Berry模型、Leuning模型和Medlyn模型模拟的光合速率与气孔导度之间的关系,以及土壤水分含量和CO2供需对气孔模型的影响。【方法】 测定4种不同土壤水分条件8% (W0)、12% (W1)、16% (W2)、20% (W3)下油松幼苗叶片的气体交换数据,并将实测数据与气孔模型的模拟数据进行对比。【结果】 在4种土壤水分条件下都有明显的光合午休现象,中午净光合速率(A)和气孔导度(gs)都会下降; 在中、低土壤水分条件下(W0、W1和W2),中午净光合速率和气孔导度的下降还伴随着胞间CO2浓度(Ci)的下降; 然而,在高土壤水分条件(W3),中午净光合速率和气孔导度的下降却伴随着胞间CO2浓度的升高; 在W0、W1和W2土壤水分条件下,气孔导度降幅比净光合速率大; 相反,在W3土壤水分条件下,气孔导度降幅要比净光合速率小。在4个土壤水分条件下,净光合速率和气孔导度之间都具有高度相关性; 在W0、W1和W2土壤水分条件下,Ci和gs之间也具有负相关,Ci随着gs的下降而降低,但在W3水分条件下,A和gs之间具正相关;而Ci和gs之间的变化不规律。【结论】 在W0、W1和W2土壤水分条件下,光合午休是由气孔关闭主导,而不是由叶肉细胞光合能力的下降主导; 与此相反,在W3土壤水分条件下,光合午休是由非气孔限制,即叶肉细胞的光合能力降低主导。3个气孔模型的模拟结果表明,无论是采用全天数据还是采用上午和下午的数据,在4个土壤水分条件下,Medlyn模型的模拟效果都是最好的, 而Medlyn模型的模拟效果,在不同土壤水分条件下,以及上午和下午存在明显差异。这说明Medlyn模型可以通过引入能够反映土壤水分条件对气孔行为影响的函数来得到改善; 对于具有光合午休现象的植物来说,运用气孔模型进行模拟时应该将上午和下午的数据分开,分别模拟。当气孔限制和非气孔限制同时存在时,应该分别模拟光合速率与气孔导度之间的关系,并且可以给模型引入一个函数来提高模型的模拟效果。
油松; 叶片气体交换; 气孔导度; 气孔经验模型; 气孔优化模型
Photosynthesis is pivotal for plant growth as the source of primary production by which plants use light energy to synthesize organic compounds. The net CO2assimilation rat is determined by the characteristics of the photosynthetic machinery (including photosynthetic capacity), the rate of CO2diffusion to intercellular leaf spaces and the concentration of intercellular CO2. These are, in turn, influenced by weather and soil conditions (e.g., solar irradiation, temperature and soil water content). As irradiance and temperature reach a maximum at mid-day and humidity declines towards a daily minimum, many plants exhibit the well-documented mid-day depression in photosynthesis. This decrease in photosynthesis can significantly limit plant growth.
Causes of mid-day depression are generally ascribed to either stomatal limitations or non-stomatal limitations (decreased photosynthetic capacity). Guoetal.(1994) also reported that the mid-day depression of photosynthesis in cotton leaves coincided with photoinhibition and increased photorespiration, consistent with the finding of Xu (1988) and Ogren (1988). Guoetal.(1996) later found that photorespiration could alleviate photoinhibition in cotton. Finally, Muraokaetal.(2000) argued that the mid-day depression of photosynthesis inArisaemaheterophyllumwasthe combined effects of diffusional (stomatal) limitation, photoinhibition and enhanced photorespiration.
Stomatal limitation results from stomatal closure, which can be induced by a large leaf-to-air water vapour pressure deficit or low leaf water potential (Hsiao, 1973; Maier-Maercker, 1983; Mottetal., 1991), thus decreasing the CO2concentration in the intercellular spaces (Langeetal., 1985; Raschkeetal., 1986; Wiseetal., 1990). Non-stomatal limitation (e.g., photoinhibition) is often assumed implicitly as a metabolic constraint (Ishidaetal., 1999; Ishidaetal., 1996) due to the inactivation of photosynthetic reactions associated with photo-system (PS) II (Demmig-Adamsetal., 1992; Longetal., 1994; Powles, 1984).
In field environments, limitation of one process of photosynthetic CO2assimilation can enhance the limitations of additional processes (Cheesemanetal., 1996; Foyeretal., 1990). Thus, decreased CO2concentration in the intercellular spaces induced by stomatal closure at high temperature and high irradiance can enhance the sensitivity of the photosynthetic apparatus to high-light stress and damage the PSII photochemistry (Cornicetal., 1996; Petersonetal., 1988). Water availability is considered the environmental factor that most strongly limits plant CO2assimilation world-wide (Nemanietal., 2003), particularly during water stress (Lawlor, 1995). Thus, mid-day depression of photosynthesis during drought is more severe (Benetal., 1987; Cornicetal., 1989; Quicketal., 1992) than in the absence of drought. It is generally assumed that water stress affects photosynthesis primarily through stomatal closure, rather than a direct effect on the capacity of the photosynthetic apparatus (Cornic, 1994; Jones, 1998; Snchezetal., 1999; Tourneuxetal., 1995). However, Tezaraetal.(1995) found that stomatal control of photosynthesis becomes progressively less effective as water stress intensifies, consistent with the results of Grassietal.(2005), who found that about half of the decline in light saturated CO2assimilation may be attributable to non-stomatal limitations under severe drought conditions. It therefore remains debatable as to whether stomatal closure is more important than non-stomatal limitations in causing mid-day depression in photosynthesis during the progression of water stress (Flexasetal., 2002; Lawlor, 2002; Tezaraetal., 1999).
Models of vegetation function are widely used to predict the effects of climate change on carbon, water and nutrient cycles of terrestrial ecosystems (Arnelletal., 2006; Ciaisetal., 2007; Ostleetal., 2009; Sitchetal., 2008). Stomatal conductance, the process that governs plant water use and carbon uptake, is fundamental to such models (Linetal., 2015). Stomatal conductance is linearly correlated with net carbon assimilation rate under steady state conditions (Wongetal., 1979), but when atmospheric CO2concentration or relative humidity are varied, this relationship breaks down. Stomatal conductance declines with increasing atmospheric CO2concentration, but net carbon assimilation rate increases. When relative humidity decreases, stomatal conductance declines non-linearly but net carbon assimilation rate changes little (Farquharetal., 1984; Grantz, 1990; Mottetal., 1991). An empirical model was developed by Balletal.(1987) (hereafter referred to as BWB model) to describe stomatal conductance as a function of biotic and abiotic factors. However stomata respond to evaporative demand or transpiration (Monteith, 1995) rather than to relative humidity perse (Sheriff, 1984) and consequently Leuning (1990) found that usingCs-Г, whereCsis the atmospheric CO2concentration, and Г is CO2compensation concentration, instead ofCsin the Ball-Berry model give a better fit and Leuning (1995) revised the Ball-Berry model using leaf-to-air water vapour pressure deficit as evaporative demand instead of relative humidity (hereafter referred to as the Leuning model). These two stomatal models are widely used as they are simple to parameterize from leaf-scale data, are easy to implement at large scales and appear to capture the fundamentals of stomatal behaviour. However, there are several important criticisms that can be made of both models (Aphaloetal., 1991; Eamusetal., 2008; Medlynetal., 2005; Mottetal., 1991). The two major criticisms are that first, they are both empirical (i.e., derived from a large amount of experimental data), which makes them difficult to extrapolate to environmental regimes beyond their original parameterisation and second they have no theoretical basis for predicting or interpreting differences among species and environments (Krinneretal., 2005).
In contrast to these empirical models, there is along-standing theory of optimal stomatal behaviour (Cowanetal., 1977), which postulates that stomata should act to maximize carbon gain (photosynthesis,An) while at the same time minimizing water lost (transpiration,E). Based on this theory, Harietal. (1986) produced the optimal stomatal conductance model. Although several implementations of this optimal model have been attempted (Arnethetal., 2002; Katuletal., 2009; Lloyd, 1991), none has been widely used, principally because the marginal water cost of carbon gain is difficult to estimate but also because previous implementations do not correctly capture stomatal responses to atmospheric CO2concentration. Medlynetal.(2011) reconciled the optimal and empirical models of stomatal conductance and derived a unified model (hereafter referred to as Medlyn model). The benefits of this unified model are that it:1) included a biological interpretation of the model parameters that were previously regarded as empirical constants and 2) provided a powerful quantitative framework for research into the long-term acclimation and adaptation of stomatal function under conditions of global environmental change.
All of the three stomatal conductance models, BWB model, Leuning model, Medlyn model, successfully summarized the observations of stomatal behaviour in well-watered plants. However, soil water is frequently limiting to plant growth. Stomatal models can incorporate the effects of soil moisture on stomatal conductance using an electrical resistance analogy for the transport of water from soil to roots to correctly simulate the patterns in conductance and CO2as simulation during drought (Berningeretal., 1996; Op de Beecketal., 2010; Salaetal., 1996b). Field and laboratory studies of gas exchange show a marked daytime asymmetry, with higher fluxes of water and CO2in the morning than in the afternoon after mid-day depression of photosynthesis (Dereketal., 2001; Grantetal., 1999), especially during conditions of low soil water content (Oliosoetal., 1996; Prioretal., 1997). That accounts for the effects of supply and demand for CO2by photosynthesis and respiration, which affects stomatal conductance through variations in intercellular CO2concentration (Assmann, 1999). Whether the models are able to capture the effects of supply and demand for CO2is also debateable. Tardieuetal.(1993) and Tuzetetal.(2003) found the stomatal models were not able to capture the observed asymmetry for fluxes of water and CO2in the morning and afternoon during periods of water stress.
P.tabulaeformis, an endemic evergreen coniferous species in China, is a key species of coniferous forests in arid, semi-arid and semi-humid regions of China. It is widely used as an afforestation and reforestation tree species in ecological restoration and soil conservation programs (Liu, 2002; Zhengetal., 1978). TheseP.tabulaeformisforests spread naturally from northeast to north and from central to western regions of China, between east longitude 103°20′ to 124°45′, north latitude 31°00′ to 43°33′, and 100 to 2 600 m, a.s.l, (Ma, 1989; Zhengetal., 1978).The distribution area is up to 1 620 000 hm2(Ma, 1989). Across this range climatic conditions are very different, with average annual rainfall ranging from 400 mm to 1 000 mm, average annual temperature ranging from 1 to 16 ℃ and altitude ranging from 100 to 2 600 m. The principle aim of the work described here is to examine howP.tabulaeformisphotosynthesis responds to variation in soil moisture content.
In this paper, we examined diurnal changes in CO2exchange in needles ofP.tabulaeformisseedlings grown under different soil water conditions. We hypothesised: 1) in different soil water conditions, the midday depression of photosynthesis inP.tabulaeformisseedlings was consistent; 2) the relative importance of stomatal and non-stomatal limitations on the midday depression of photosynthesis was variable in different soil water conditions; and 3) the different soil water conditions would not impacts the supply and demand for CO2on the relationships of CO2assimilation and stomatal conductance simulated by three alternative stomatal models.
1 Materials and methods
1.1 Plant materials and experimental treatments
All experiments were conducted at the Xiaotangshan Experiment Station (40°15′N, 116°13′E, and altitude 101 m) of Beijing Forestry University, located in the northern suburbs of Beijing, China. In mid-March 2012, before new leaf emergence, two-year-oldP.tabulaeformisseedlings (an average of approximately 18 cm tall, obtained from the Container Tree Seedling Nursery in Luanping County, Heibei Province) were transplanted into plastic cylindrical pots (25 cm diameter×30 cm depth) filled with field soil, with one seedling per pot. Field soil was collected from the Xiaotangshan Experimental Station, and was a mixture of sand and peat (1∶1 volume) with medium fertility (pH 8.8, N 19.6 mg·kg-1, P 4.6 mg·kg-1, K 135 mg·kg-1). The soil was air dried and 8 kg of the mixed soil was added to each pot. The potted seedlings were held in the greenhouse and watered every two days to avoid water stress, and were exposed to ambient sunlight, temperature and relative humidity throughout the day.
In late May 2012, 80 healthy and similarly sizedP.tabulaeformisseedlings were selected and randomly divided into 4 groups, with 20 seedlings per group. Each group was subjected to one of the four soil water content regimes: 1) soil water content is 8% (W0), 2) soil water content is 12% (W1), 3) soil water content is 16% (W2), and 4) soil water content is 20% (W3). An additional 20 seedlings were used to determine the average initial dry mass. Soil water treatments began on 15 June 2012, and ended on 25 October 2012. Seedlings grew under each treatment for 130 days. During those days, soil water was monitored by weighting, and watered to supplement water as needed (W0, 8%; W1, 12%; W2, 16%; W3, 20% soil water content) at 6:00 PM every day. After watered, a thick layer of straw was placed on the pot soil to ensure that the soil moisture content was similar over the course of the day. The experimental layout was surrounded with a single row of border plants to protect the experimental seedlings from external influences, and all subplots and main pots were rotated weekly to provide for random distribution. There were 4 sampling days (sunny day) following treatment initiation.
1.2 Leaf gas exchange and environment measurements (A,gs,Ci, PPFD,Tleafand VPD)
Leaf gas exchange was measured in the field on the clear days of 2 July, 23 July, 17 August and 21 September 2012. Three seedlings ofP.tabulaeformisfor each soil water treatment were used and three needles measured per tree. For each measurement day, the same seedlings for every soil water treatment were used. All the leaf gas exchange and environmental measurements were conducted every 2 h from 7:00 to 17:00 on each sampling day. Each needle was allowed 5-10 min to equilibrate to chamber conditions, when readings were stable and the coefficient of variation was < 1%.
Leaf gas exchange was measured using a portable open gas exchange system (LI-6400;Li-Cor Inc., Lincoln, Nebraska, USA) equipped with a needle leaf chamber. The clamp-on leaf chamber allowed natural illumination of the upper and lower leaf surface during measurements. Net CO2assimilation rate (A), stomatal conductance (gs), intercellular CO2concentration (Ci) and leaf to air vapour pressure deficit (VPD) were determined using simultaneous measurements of CO2and H2O vapour flux, air temperature (Tair) and leaf temperature (Tleaf). The CO2concentration of the air entering the leaf chamber (Ca) was controlled at 400 mmol·mol-1. Air temperature in the chamber was adjusted manually to the air temperature outside the system, and relative humidity in the chamber was adjusted to be similar to the ambient humidity. Incident photosynthetic photon flux density (PPFD) on the leaf surface andTleafwere measured using a chamber-in quantum sensor and a thermocouple, respectively. WithCiandCastomatal limitation (L) was calculated according to (Berryetal., 1982).
For each plant, total leaf area was calculated as mean leaf area per leaf × the number of leaves per plant, the number of leaves per plant were counted and the mean leaf area per leaf was calculated as follow(Lietal., 2007):
(1)
Where LARL represent mean leaf area per leaf,d(mm) was the mean width of leaf,h(mm) was the mean thickness of leaf,lwas the leaf length (measured by steel tape),nwas the number of leaf samples (in this study,nwas 40 and included 20 old leaves and 20 new leaves).dandhwere the mean values measured by digital vernier caliper (accuracy 0.01 mm) at 1/4, 1/2 and 3/4 length of leaf.
TheA/PPFD curves under the four soil water conditions were measured also using the LI-6400, equipped with red and blue light sources. All measurements were conducted under ambient CO2concentration, temperature and relative humidity.The PPFD chosen were 1 600, 1 300, 1 000, 800, 500, 300, 150, 100, 50 and 20 μmol·m-2s-1. There were three replicate seedlings per treatment and three needles per seedling measured.
1.3 Assessment methods
The limitations imposed by stomatal or non-stomatal factors in the mid-day depression of photosynthesis inP.tabulaeformiswas investigated by: 1) comparing the changes ofAin air with the changes ofgs, 2) comparing the direction of changes inA,gsandCiduring the diurnal course of photosynthesis, 3) comparing the co-regulations ofAandgs,gsandCi, and 4) comparing the direction of changes inCiand the stomatal limitation index (L,L=1-Ci/Ca) (Farquharetal., 1982).
Ciis an important factor in the regulation ofA, as the variations inCiwere used as a first indicator of stomatal limitations toA(Xu, 1997). So the stomatal limitation (stomatal closure) reducedCi, but the non-stomatal limitation reduced photosynthetic activity thereby raisingCi(Xu, 1997). When the two limitation factors exist simultaneously, the direction ofCichanges depends on the direction of the dominant factor changes. So, during the diurnal courses, if the midday depression in photosynthesis (Aandgs) is in accordance with decreases inCi, it is the stomatal limitations that controls the midday depression of photosynthesis mainly, while if the midday depression in photosynthesis (Aandgs) is in accordance with increases inCi, it is mainly the non-stomatal limitations that controls the midday depression of photosynthesis. In addition, the comparison of the magnitude of midday depression inAandgsis also evidence to clarify whether the stomatal or non-stomatal limitations control the midday depression of photosynthesis predominantly (Quicketal., 1992). If the changes ofgsare larger than the midday depressions inA, indicates that the midday depression of photosynthesis is mainly due to stomatal limitations. However, if the changes ofgsare smaller instead, the midday depression of photosynthesis is mainly controlled by the non-stomatal limitation. Simultaneously, the co-regulation ofA,Ciandgs, is also able to demonstrate which limitations, stomatal or non-stomatal, control the midday depression of photosynthesis (Escalonaetal., 2000). In the diurnal courses, when the midday depression of photosynthesis occurs, ifCireduces butLincreases, the stomatal limitation predominantly controls the midday depression of photosynthesis, however, ifCiincreases butLreduces, the non-stomatal limitation plays the dominant role (Farquharetal., 1982).
1.4 The models
Wongetal. (1979) found that under steady state conditions,gsis strongly linear correlated withA. However, whenCsor relative humidity (hs) varied, the relationship ofgstoAwas less straight forward but presented several patterns. And in all of those patterns,gstended to decline with increasingCswhileAincreased; whenhsdecreased,gstended to decline, while there was relatively little change inA. Based on a series of leaf gas exchange experiments, (Balletal., 1987) developed the following empirical expression forgs:
(2)
Whereaandg0are fitted parameters,Ais the net assimilation rate (μmol·m-2s-1),hsis the relative humidity andCsis the CO2concentration of air at the leaf surface,gsis the stomatal conductance.
Seeing that Eq. (2) is not applicable to low CO2concentration, Leuning (1990) found that usingCs-Г, where Г is the CO2compensation concentration, instead ofCsgives a better fit. And (Aphaloetal., 1991) foundgsresponded to humidity deficit rather than to surfacehswhich was widely accepted. In the same year, Mottetal.(1991) demonstratedgsresponded to atmospheric humidity through evaporation from the leaf, rather than to the humidity deficit itself, because there is a close link between the transpiration rate (Et) and humidity deficit (Et=gs·VPDs). By adopting these modifications, Leuning(1995) proposed a revised form of the Ball-Berry model:
(3)
Wherea,g0,AandCsare equivalent to that in Eq. (2), Г is the CO2compensation concentration, VPD0is a parameter reflecting characteristics of response of stomata to atmospheric VPD. Here, the value of VPD0is specified as 1.5, and VPD in air is used instead of VPDs, because VPD is a meteorological variable and can be easily obtained.
These models[Eq. (2) and (3)] are widely used because: they are straightforward to parameterize from leaf-scale data, are easy to implement at large scales, and nonetheless appear to capture the fundamentals of stomatal behaviour. However, there are several important criticisms that can be made of both models (Aphaloetal., 1991; Eamusetal., 2008; Medlynetal., 2005; Mottetal., 1991). The major criticism of both models is that they are empirical in nature, having no theoretical basis for predicting or interpreting differences in parameter values among species and vegetation types, lacking confidence in applying them to novel situations (such as under increasing atmospheric CO2concentration), and the parameters are simply assumed constant for all C3 vegetation in many regional and global models (Krinneretal., 2005). In 1977, Cowanetal. (1977) developed a theory of optimal stomatal behaviour, which postulates that stomata should act to maximize carbon gain (photosynthesis,A) while at the same time minimizing water lost (transpiration,E). Based on this theory, Harietal. (1986) obtained the optimal stomatal conductance model. Medlynetal.(2011) reconcile the optimal and empirical models ofgsas:
(4)
Wherea,g0,AandCsare equivalent to that in Eq. (3), VPD is leaf to air vapour pressure deficit.
1.5 Statistical analyses
The experiment followed a completely randomized design.To assess the response ofP.tabulaeformisseedlings to different soil water content, we further focused our analysis on the relationship between measured and simulatedgsusing BWB model, Leuning model, and Medlyn model. models under the four soil water treatments. Moreover, we also fitted the three alternative models to the four soil water condition datasets separated into morning and afternoon to quantify the stomatal and non-stomatal limitation effects. The effects of soil water content and stomatal and non-stomatal limitations on the simulation ofgsinP.tabulaeformisseedlings were evaluated withR2andSp. HereR2is coefficient for the determination of the regression formula for the models;Spis slope of the linear regression. Because Leuning model has one additional parameter, the Akaike Information Criterion (AIC) was calculated to allow an unbiased comparison of the goodness-of-fit of the models (Hilbornetal., 1997).
2 Results
2.1 Diurnal changes of environmental conditions
The values for environmental conditions are averaged over the 4 d of measurement as the conditions were similar. At 7:00 local time, the incident PPFD was about 300 μmol·m-2s-1, and increased rapidly (Fig. 1a), peaking at 1 200 μmol·m-2s-1at 11:00. The incident PPFD decreased thereafter, by 17:00, it was only about 200 μmol·m-2s-1.The leaf temperature (Tleaf) increased along with the increase of PPFD and air temperature (not shown) from about 32 ℃ at 7.00 to about 42 ℃ at 11:00. By 15:00, the Tleafwas similar to 11:00, but dropped to 40 ℃ in the late afternoon (Fig. 1b). Leaf-to-air vapour pressure deficit (VPD) was about 2.0 kPa in the early morning, increasing to about 5.0 kPa at 11:00 and by 15:00 it decreased below 4.5 kPa, further decreasing to 4.0 kPa by 17:00 (Fig. 1c).
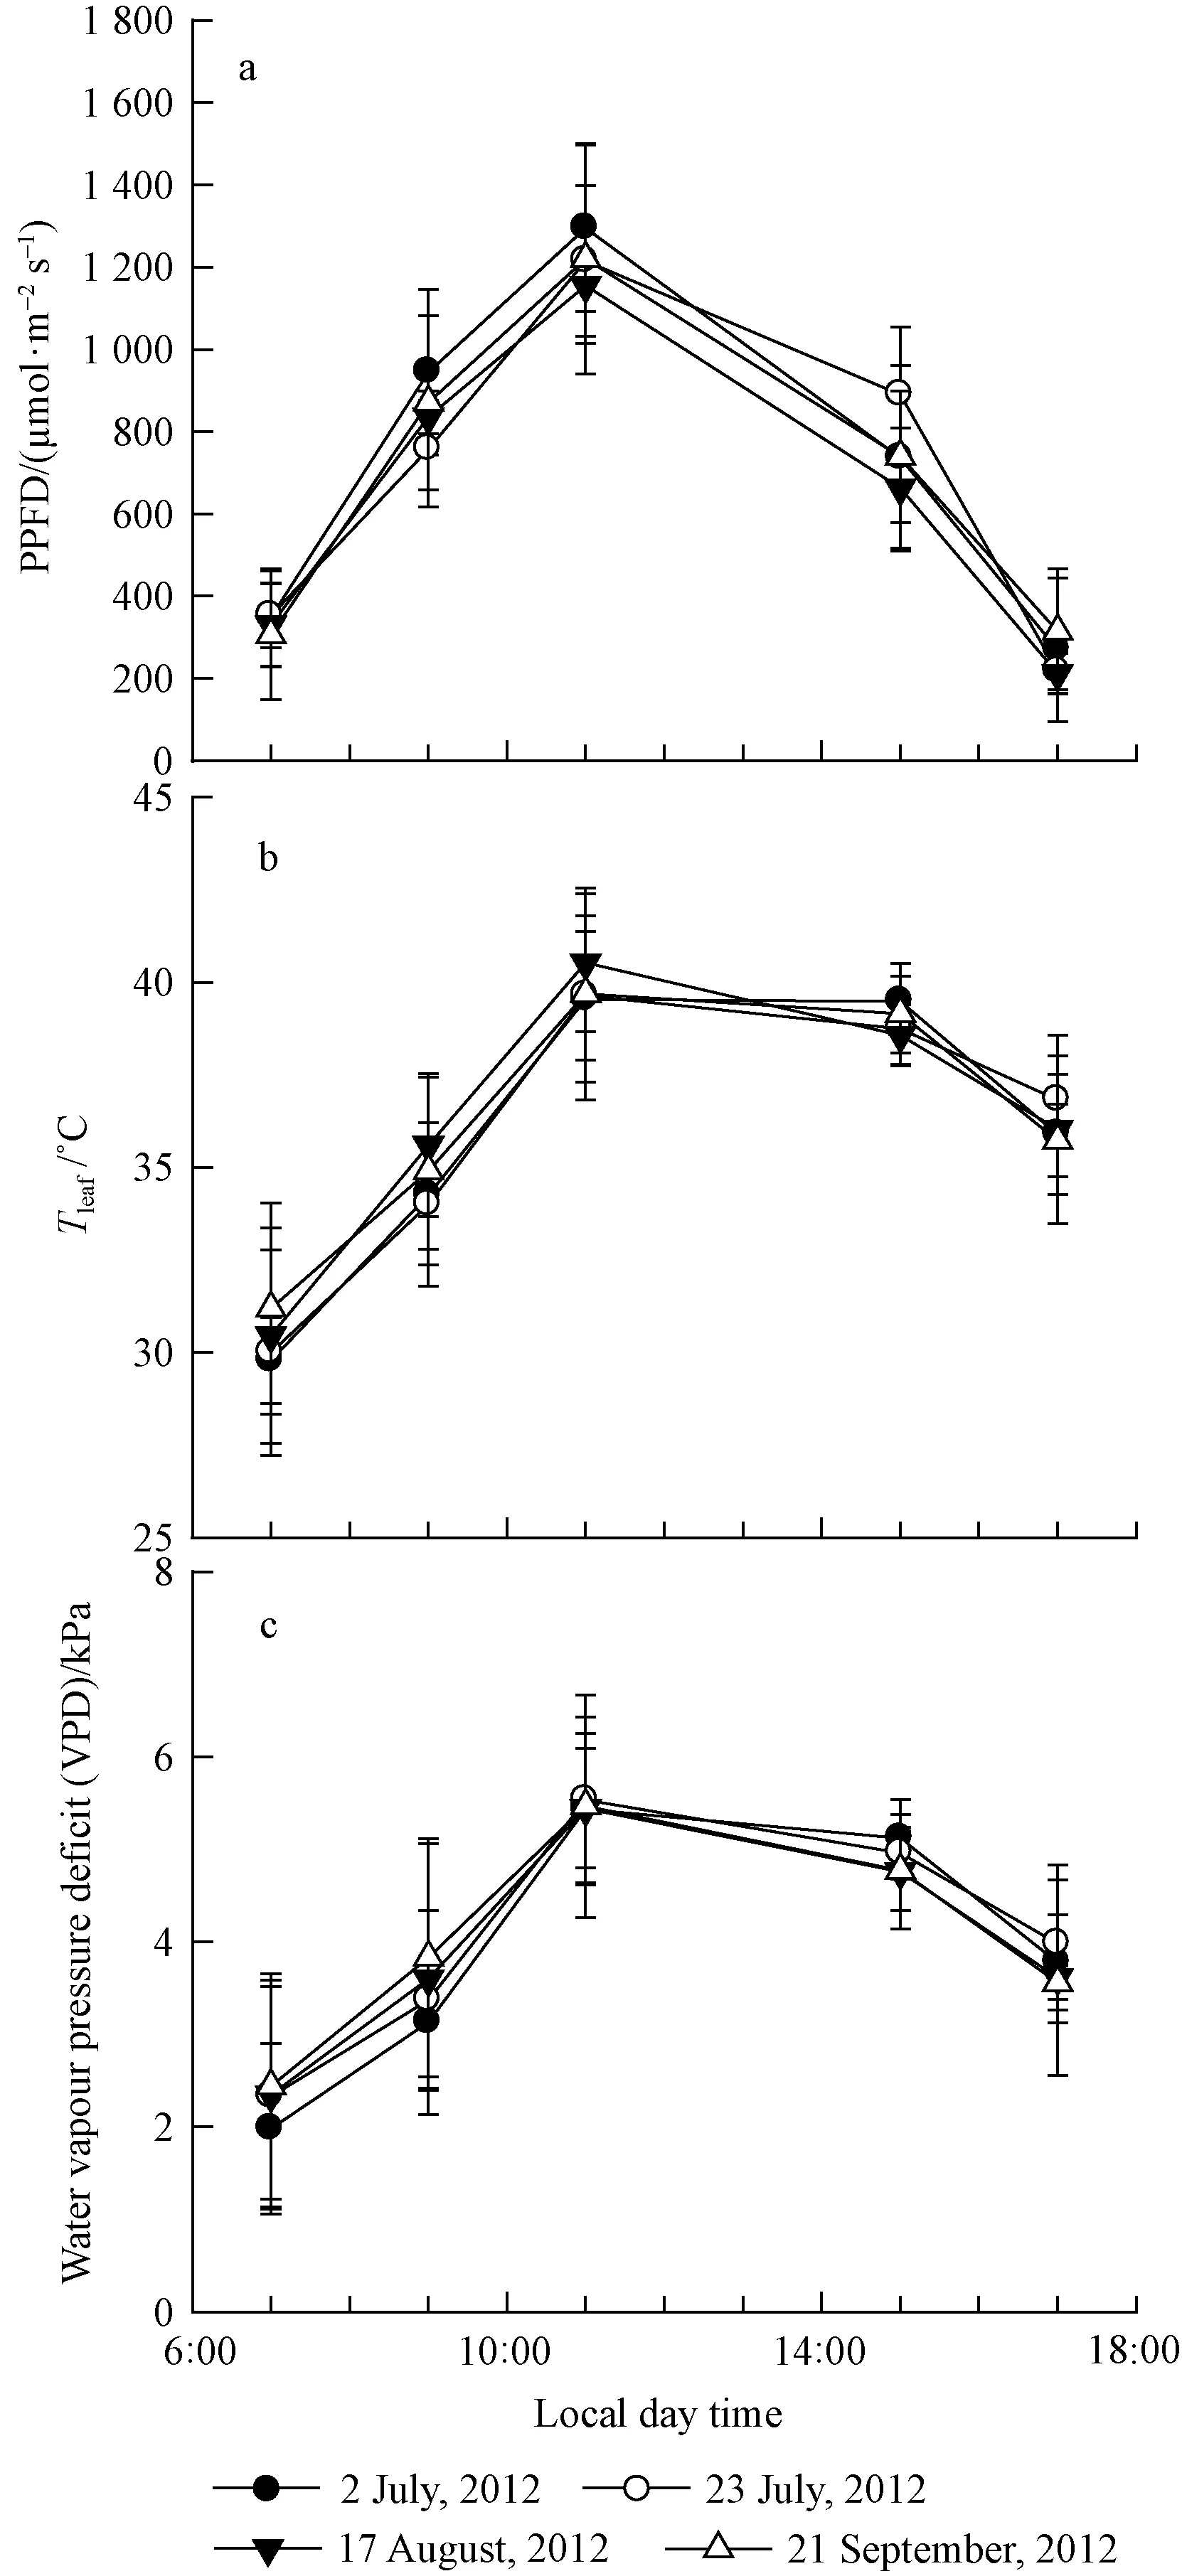
Fig.1 Diurnal courses of variation in photosynthetic photon flux density (PPFD), temperature and leaf to air vapour pressure deficit (VPD) for P. tabulaeformis seedlings in four separate days Vertical bars represent SE of the means (n=4)
2.2 Diurnal patterns of leaf gas exchange under natural PPFD conditions
Significant diurnal changes inA,gs,CiandLwere observed inP.tabulaeformisleaves for the 4 day average values of measurements in the different soil water treatments.Aincreased rapidly from about 2.0 μmol·m-2s-1at 7:00 to a maximum at 9:00 across the four soil water treatments (Fig. 2), followed by a decline during the day under W0and W1soil water treatments (Fig. 2). However, under W2and W3soil water treatments,adecreased after midday, but recovered slightly at 15:00. The decrease was larger in the W2soil water treatment compared to the W3treatment (Fig. 2). The maximum values ofAwere about 3.0, 3.5, 5.5 and 5.0 μmol·m-2s-1in the four soil water treatments (W0, W1, W2and W3), respectively.
The diurnal course ofgschanges paralleled those ofA(Fig.2). Thusgsincreased in the morning and reached a maximum at 9:00 across the four soil water treatments. For the two driest treatments,gsdecreased during the day but for the two wettest soil water treatments,gsdecreased after midmorning, but recovered at 15:00. This change was slight in the W3soil water treatment, but more noticeable in the W2soil water treatment. Under the four soil water treatments, the maximum values ofgswere about 0.04,0.05,0.07 and 0.45 mol·m-2s-1in the four soil water treatments (W0, W1, W2and W3), respectively.
The diurnal patterns ofCidiffered significantly across the four soil water treatments (Fig.2).Under W0and W1soil water treatments,Ciresponded similarly togsin the morning: increasing rapidly in the early morning and reaching a maximum at 9.00 h, then decreasing for the remainder of the morning. In the afternoon,Ciincreased in the W0and W1treatments but then increased slightly for the rest of the day, in contrast to the pattern observed forgs. Under the W2soil water treatment, theCiresponded contrarily togsin the morning: high in the early morning, reaching a minimum at about midday; but in the afternoon,Ciresponded similarly togs: increasing after midday and reaching its second peak, then decreasing in the late afternoon. Under W3soil water treatment, theCiresponded contrarily togsboth in the morning and afternoon: high in the early morning, reaching a minimum at about 9:00, but then increasing to its second peak at the late afternoon.
The diurnal patterns in variation of stomatal limitation index,L, were opposite to those observed inCiin the four soil water treatments (Fig. 2). Under W0and W1soil water treatments,Lwere high in the early morning, and then declined to a minimum at 9:00, after thatLincreased at midday, but in the afternoonLdecreased again, while in late afternoonLsignificant further declined in W0but had no significant changes in W1. Under W2soil water treatments,Lincreased in the early morning, reaching a maximum at 11:00, decreasing during the early and mid-afternoon, but increasing slightly in the late afternoon. In the W3soil water treatment,Lincreased in the early morning, reaching a maximum at 9:00, there after significant declined by afternoon and had no significant changes yet during late afternoon.
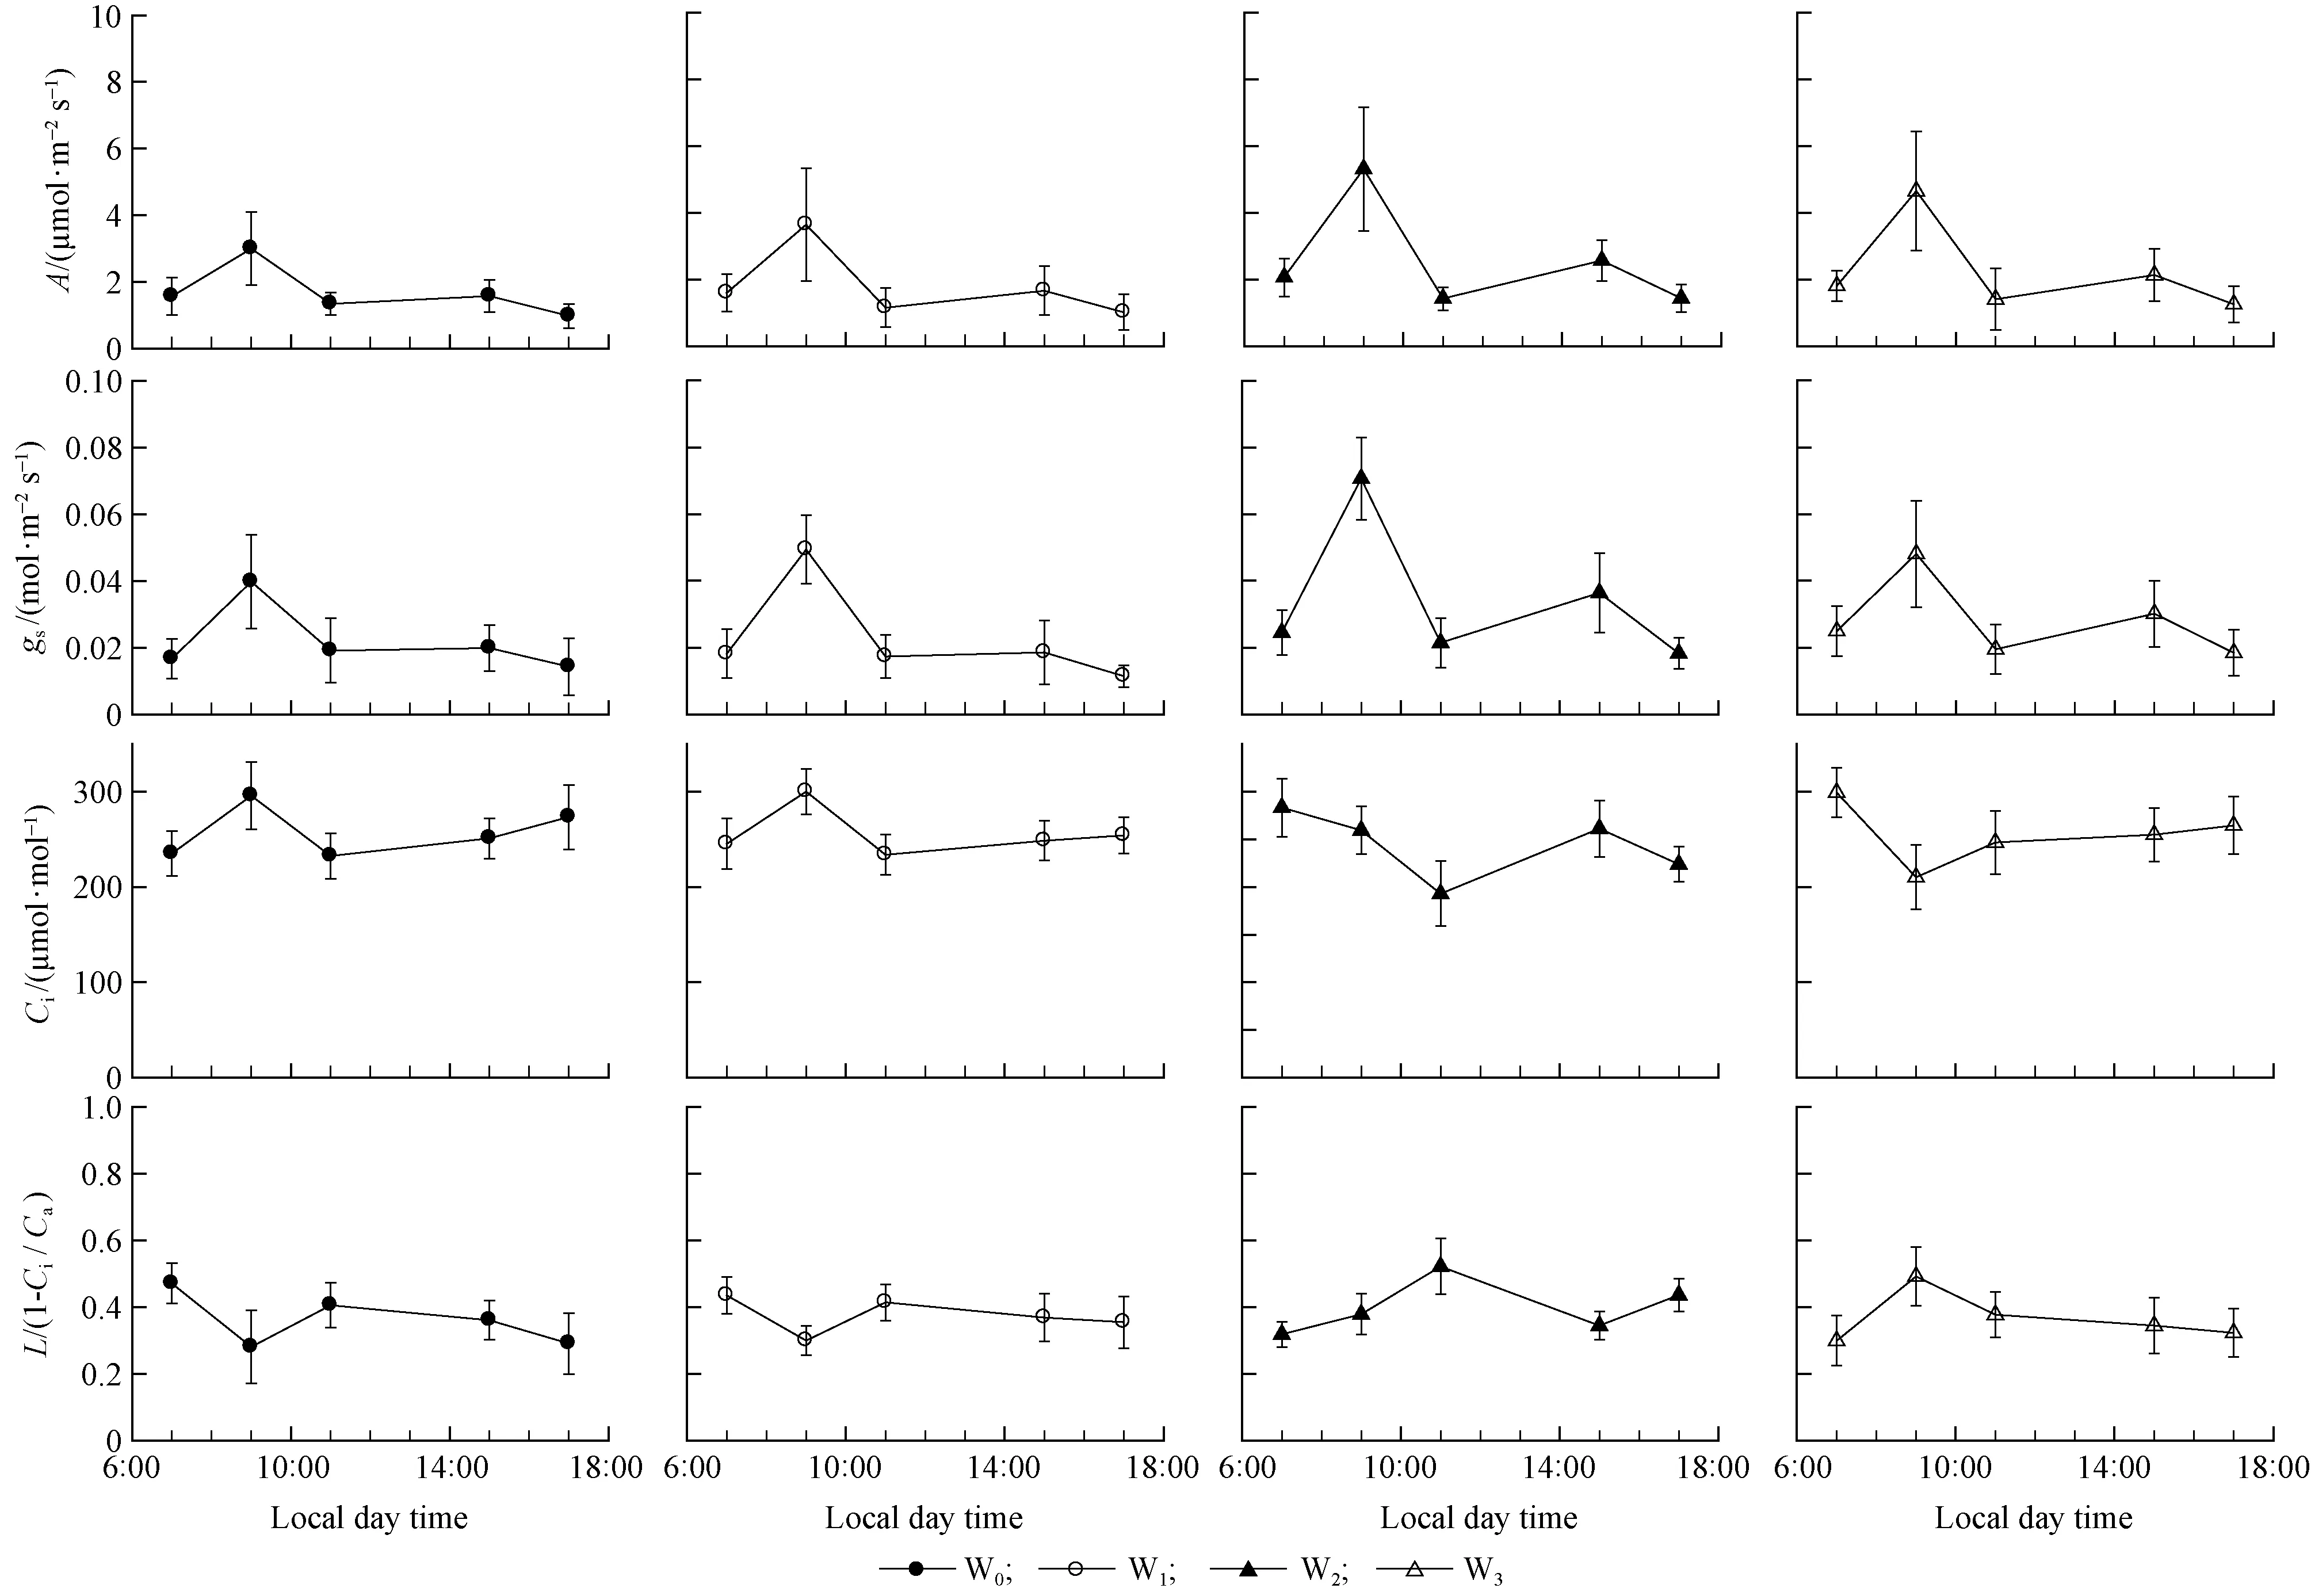
Fig.2 Diurnal changes in gas exchange of P. tabulaeformis seedlings in four soil water treatments Measurements were taken on four, very similar sunny days in an open field on 2 July, 23 July, 17 August, and 21 September Vertical bars represent SE of the means (n=4).
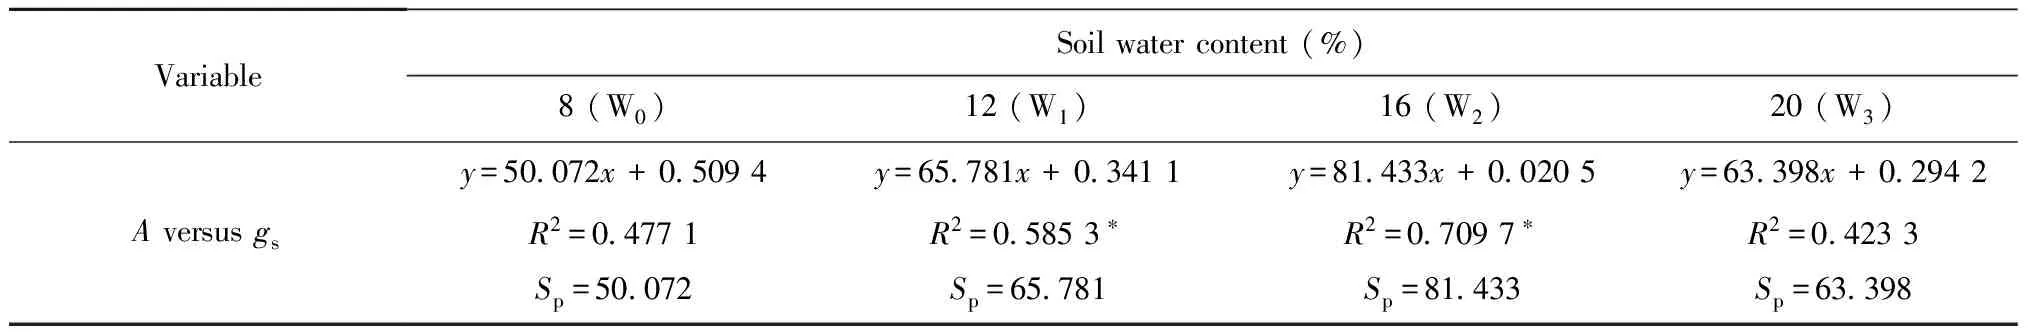
Tab.1 Corresponding equations for the regression of A and gs shown in Fig.3①
①R2is coefficient for the determination of the regression formula for the models (goodness-of-fit),Spis slope of the linear regression, * and ** noted significant differences atP<0.05 andP<0.01 level. The same below.
2.3 Regulation ofAbygsandCibygsin different soil water treatments
The CO2assimilation rateAwas a linear function ofgsacross all four water treatments across both morning and afternoon dates, as the goodness-of-fitR2W1and W2soil water treatments, that linear relationship performed significantly better than the others atP<0.05 level. Meanwhile, the sensitivity ofAtogsdecreased with the increasing of soil water content from W0to W2, as the slopeSPincreased from 50.072 to 65.781 and to 81.433. But when the soil water content continues to rise from W2to W3, the sensitivity ofAtogswill increase.

Fig.3 Relationships between CO2 assimilation rate (A) and stomatal conductance (gs), intercellular CO2 concentration (Ci) and stomatal conductance (gs) for P. tabulaeformis in the four soil water treatments (W0, W1, W2 and W3)
From Fig.3, it was also found for low values ofgs(gs< 0.02 mol·m-2s-1) there was a linear correlation betweengsandCifor all four treatments (Fig.3). However, asgsincreasedCiincreased curvilinearly and asymptotically so thatCiapproachedCafor large values ofgs.
2.4 Model comparisons
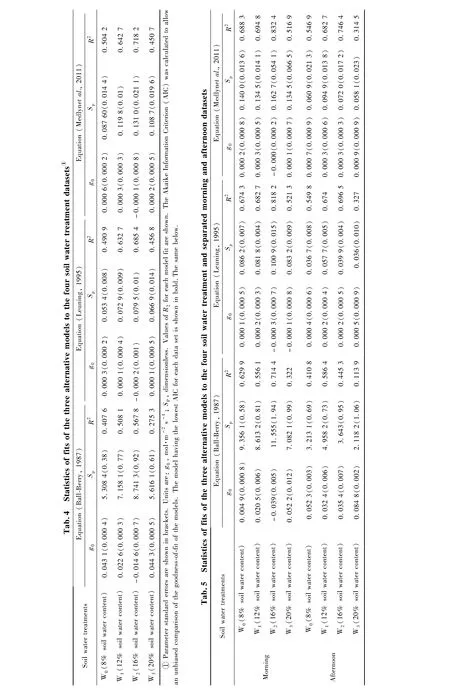
We fitted the BWB model, Leuning model, and Medlyn model to the four datasets (Fig.4), obtained from diurnal courses of stomatal conductance measured on the four soil water treatments, using SIGMAPLOT (v. 10.0, Systat Software Inc.). Tab.2 gives the regression equations and the goodness-of-fitR2, Table 4 shows the statistics of the model fits. The Medlyn model gives the best fit for W0, W1and W2soil water treatments datasets, when AIC statistics are compared (Tab.4). The Leuning model was the best fit for W3soil water treatment datasets, but have a relatively poor fit for other soil water treatment datasets, asR2was higher than that of the other two models. The BWB model give the worst fit for all of the four treatments W0,W1,W2and W3, particularly the W3soil water treatment datasets, whereR2was just 0.275 3. Overall, the Medlyn model performed best, giving highR2values for all treatment datasets.
We also fitted the BWB model, Leuning model, and Medlyn model to the four soil water treatments datasets separated into morning and afternoon (before and after 12.00) (Fig.4). The corresponding regression equations and the goodness-of-fitR2of the six datasets contained in Tab.3, and the statistics of the model fits in Tab.5. The Medlyn model give the best fit for W0, W1and W2soil water treatments datasets, but the Leuning model was the best fit for W3soil water treatment datasets, whether in the morning or afternoon. While the BWB model give the worst fit for all of the four treatments W0,W1,W2and W3whether in the morning or afternoon, particularly in the W3afternoon soil water treatment datasets, whereR2was just 0.113 9.
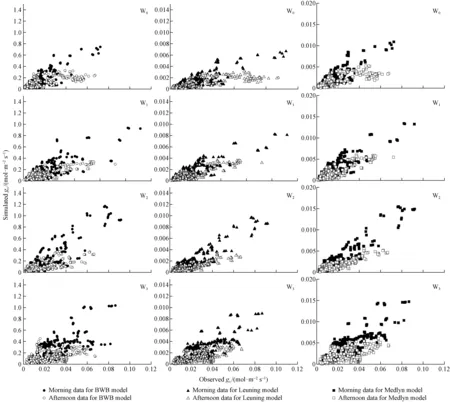
Fig.4 Comparison of simulated gs by BWB, Leuning and Medlyn models and observed gs for P. tabulaeformis in four soil water treatments (W0, W1, W2 and W3) separated into morning and afternoon
We visualize fits of the Medlynetal. (2011) model to our four soil water treatment datasets in Fig.5 and morning and afternoon separated datasets in Fig.6. The key point demonstrated by Fig. 5 is that the slope of the relationship (and thereforeSP) clearly differs among soil water treatments W0, W1, W2and W3. And it varies in a consistent manner from W0to W2, with values lowest in W0and highest in W2. When morning and afternoon separated, the difference of the relationship slope is obvious yet either in the morning or in the afternoon.
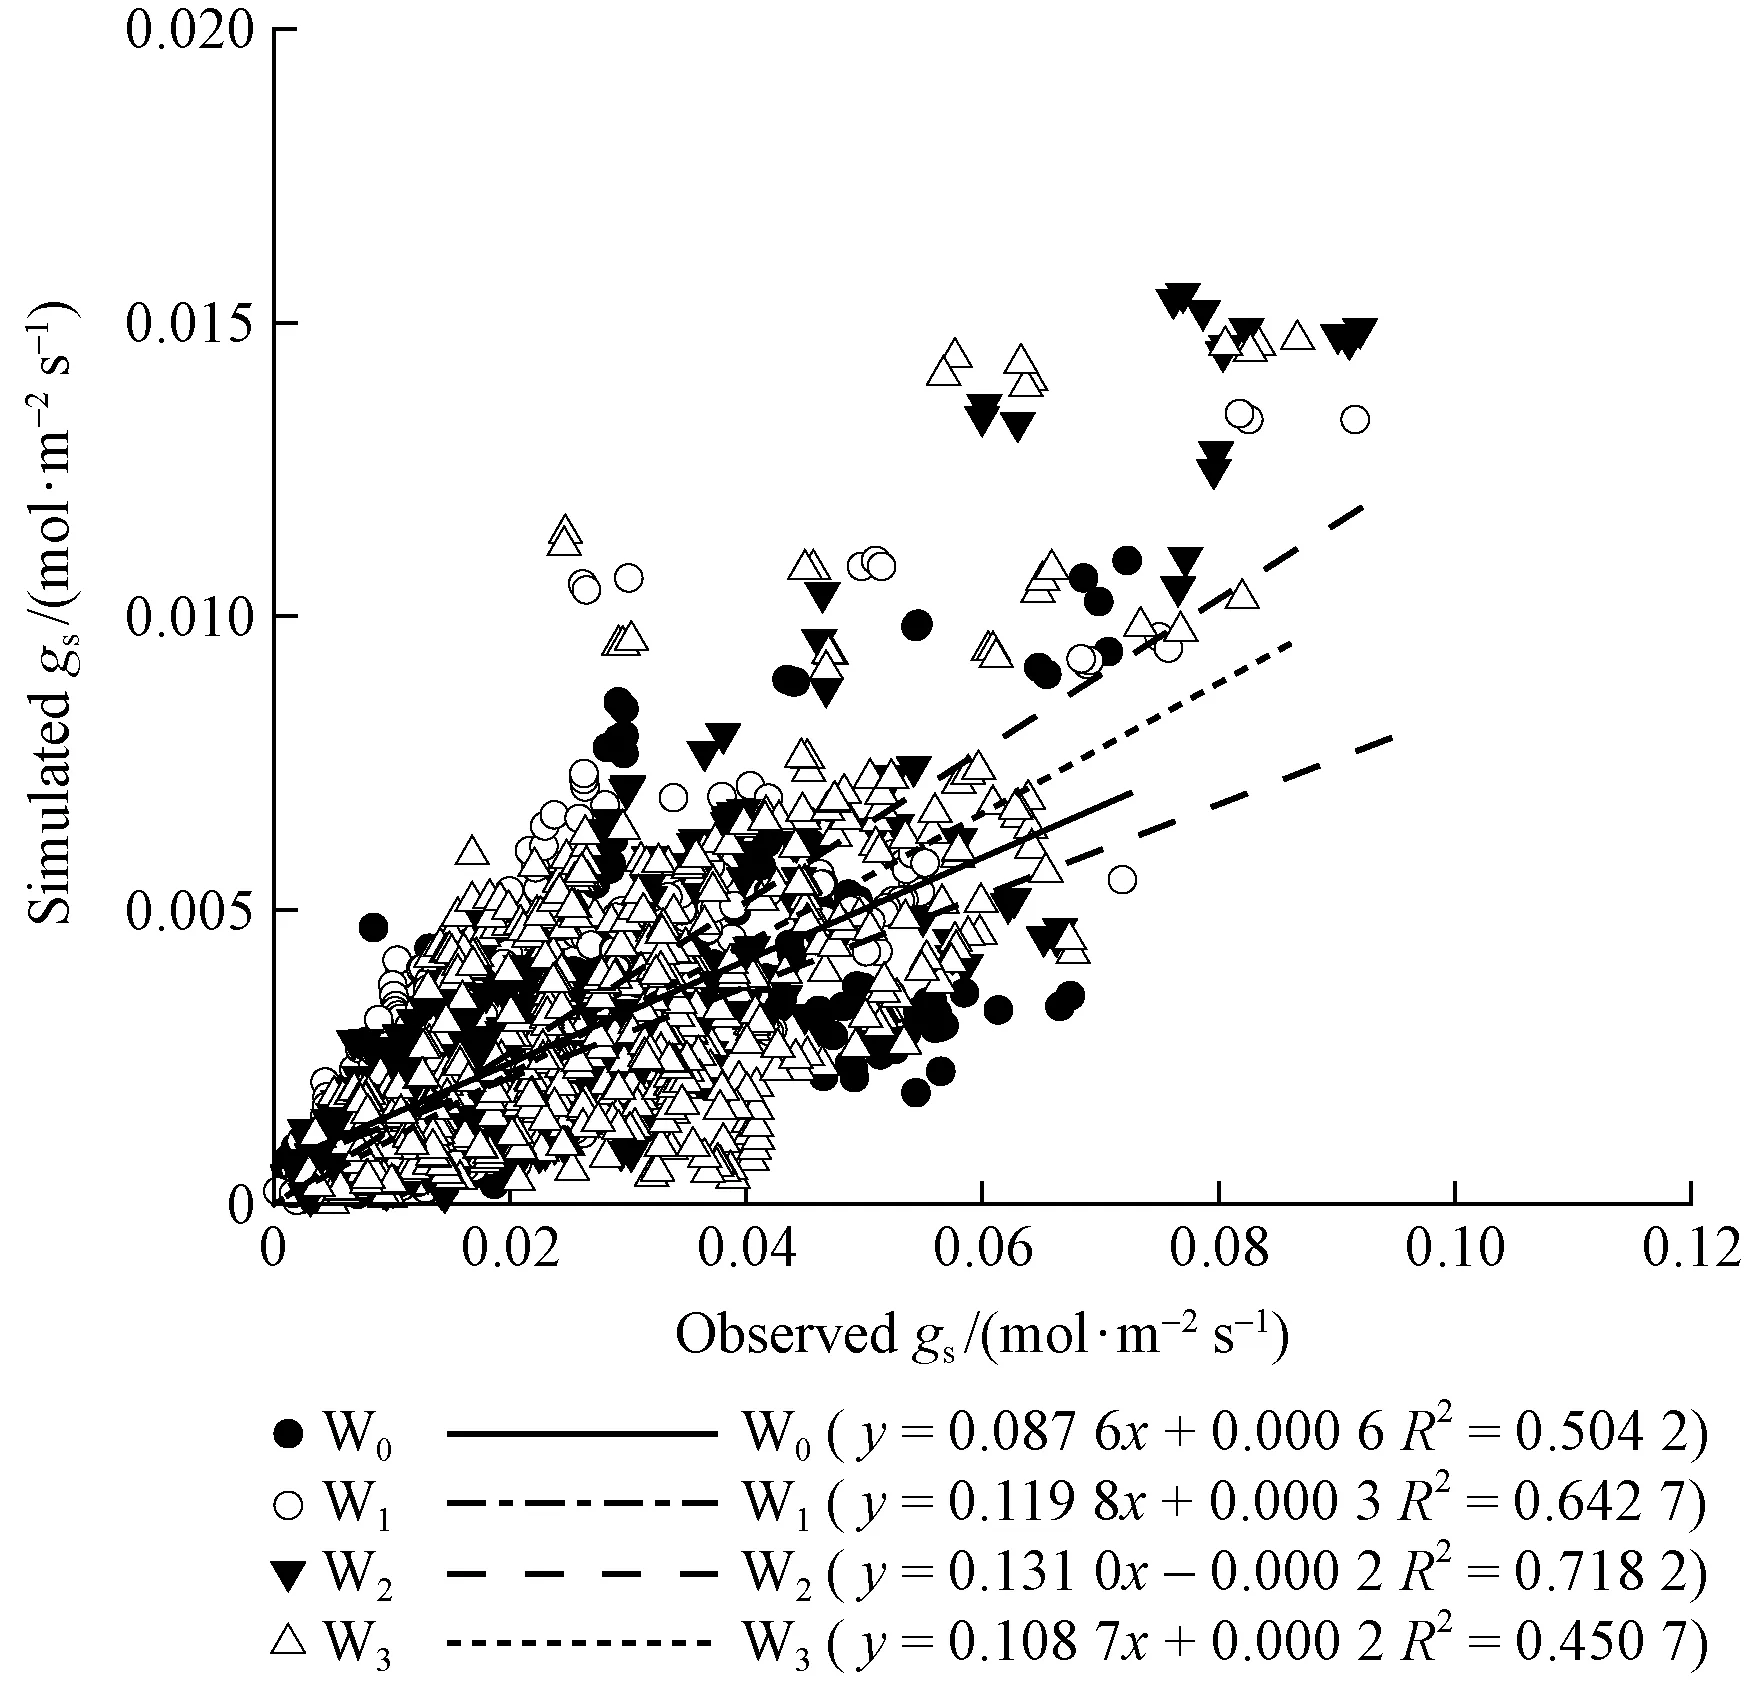
Fig.5 Comparison of simulated gs by Medlyn model and observed gs for P. tabulaeformis in four soil water treatments
3 Discussion
3.1 Diurnal variations in CO2exchange in different soil water conditions
Regression ofAand PPFD in the morning and afternoon shows thatP.tabulaeformisleaves behaved differently in the morning and afternoon. The results ofP.tabulaeformisleaves gas exchange diurnal variations suggest that midday depression ofAoccurred under our experiment conditions across the four soil water treatments. The midday depression inAcould be due to several factors, for example, large PPPF flux causing photoinhibition, high temperatures inhibiting metabolism, or large VPD causing stomatal closure and decreasing or restricting the flux of CO2into the leaf, all of which could be summarized in stomatal limitation and non-stomatal limitation.
3.2 Stomatal and non-stomatal effects on the midday depression ofAresponse to different soil water conditions
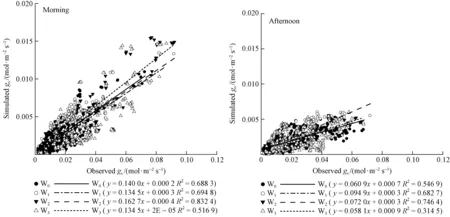
Fig.6 Comparison of simulated gs by Medlyn model and observed gsfor P. tabulaeformis in four soil water treatments separated into morning and afternoon
The relative importance of stomatal and non-stomatal effects as mechanisms controlling the leaf CO2assimilation under water stress has been a matter of controversy (Chaves, 1991; Cornic, 1994; Flexasetal., 2002). However the response of plant CO2assimilation to water stress may depend on the rapidity of the stress and the susceptibility of the individual species (Flexasetal., 2002). The present data shows that in different soil water status, the controlling effects of stomatal and non-stomatal on the midday leaf photosynthesis decline forP.tabulaeformisseedlings were different.
The results shown in Fig. 2 indicates that in the low and medium soil water status treatments, the midday depression inAcould be attributed to the closure of stomata (decrease ings), and consequently caused the parallel decline in intercellular CO2concentrationCi, rather than the decreased photosynthetic capacity of mesophyll cells. This result was constant with that observed in Norway spruce trees (Cornic, 1994; Gentyetal., 1987; Medranoetal., 1997;pundaetal., 2005). However, in the high soil water status treatments (W3), the decrease inAat midday were accompanied by a decrease ingsbut an increase inCi, which suggest the midday depression inAwas more controlled by the decreased photosynthetic capacity of mesophyll cells, which consequently caused the increase inCi, and that stomatal effects are of little or no importance. This was in full agreement with early studies by Kaiser (1987), Cornicetal.(1989) and Huangetal.(2006), who found that stomatal limitation is not responsible for the decreased CO2assimilation before the relative water content decreased below 70%.
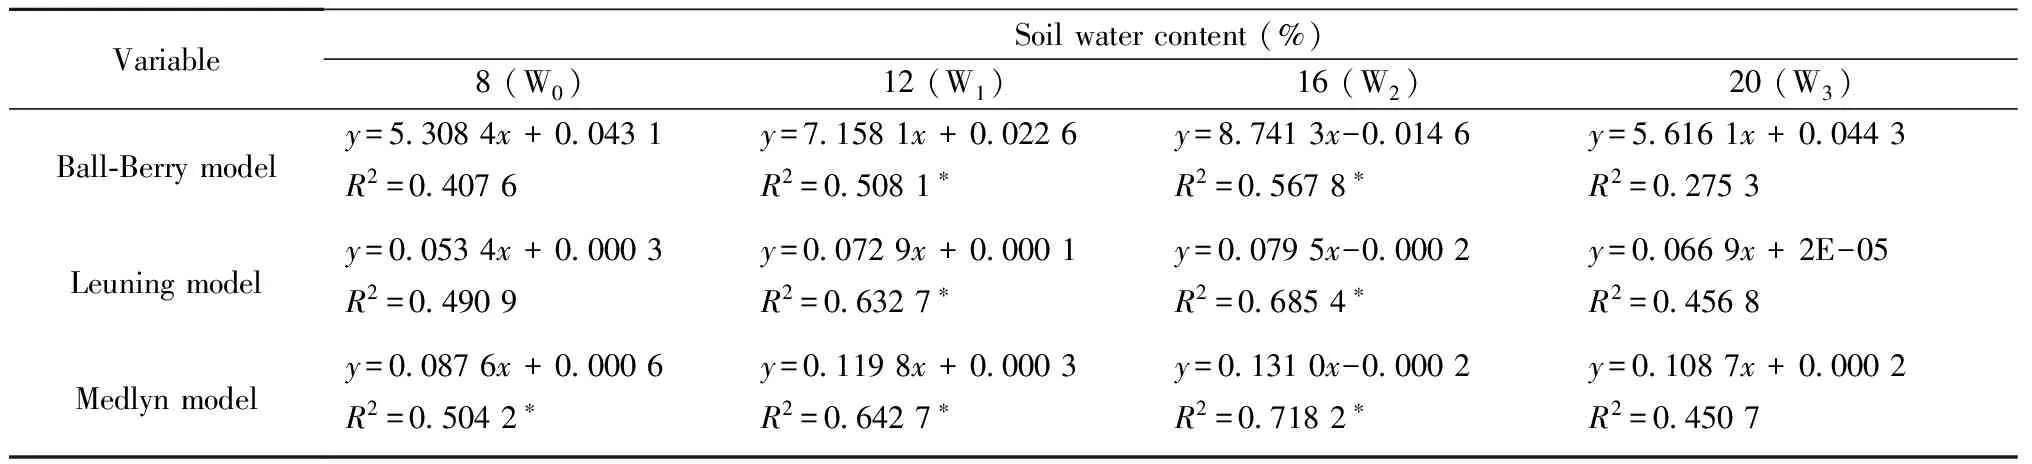
Tab.2 Corresponding equations for the regressions of the simulated gs (by the three models) and the observed gs under the four soil water treatments, and the goodness-of-fit, R2 of the models
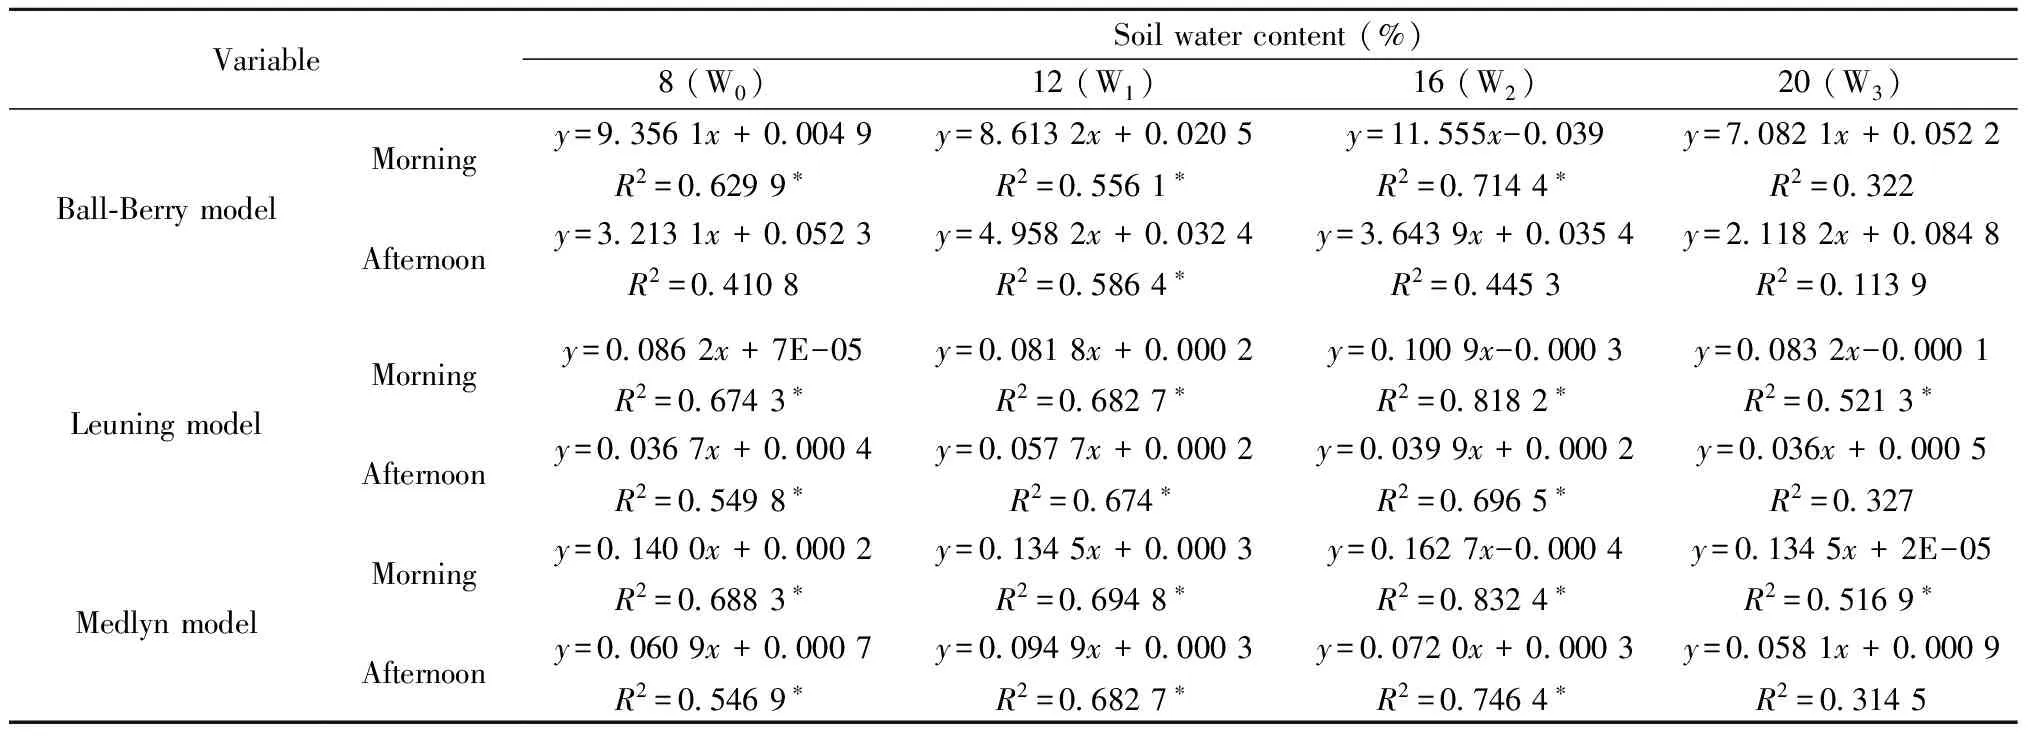
Tab.3 Corresponding equations for the regressions of the simulated gs (by the three models) and the observed gs under the four soil water treatments, and the goodness-of-fit, R2 of the models
In addition, during the diurnal rhythms, in W0, W1and W2soil water treatments, the changes ofgswere larger than the inhibition ofA; but in W3soil water treatment, the changes ofgswas of a little smaller magnitude than the inhibition ofA(Fig. 2). These also supported the conclusion that in the low and medium soil water treatments (W0, W1and W2), the midday depression inAwas more controlled by the decrease ingsdue to stomatal closure, but in the high soil water treatment (W3), it was more controlled by the decrease in photosynthetic activity of mesophyll cells.
Moreover, that conclusion could also be the result of aco-regulation ofA,gsandCi. It is expected that, for long-term experiments,Aadjustment togswill lead to a highAvsgspositive correlation, even though non-stomatal effects are important. Medranoetal.(1997) and Escalonaetal.(2000) previously reported, for long-term water stress, a highAvsgscorrelation took place in accordance with parallel decreases ofAandgs, but simultaneously with important reductions in photosynthetic capacity. This further indicated that a highAvsgspositive correlationcould not prove the depression inAwas a result of stomatal limitation. So many reports agreed with Xu (1997), that the reliable proof of stomatal limitation is not theAvsgspositive correlation, but the parallel decreases ofA,gsandCi, while the proof of non-stomatal limitation is the parallel decreases ofAandgsaccordance with increase ofCi. The present data shows that in low and medium soil water treatments (W0, W1and W2), there is a parallel decrease ofA,gsandCiwhen all data of the diurnal courses for the four sampling days are pooled (Fig.3). Nevertheless, in the higher soil water treatment (W3),Aandgsdecreased parallel, but accordance with constantCiat highgsand with some increasingCiand some decreasingCiat lowgs(Fig.3). This indicated that in low and medium soil water treatments (W0, W1and W2), the midday depression inAwere predominantly controlled by stomatal limitation, but in the higher soil water treatment (W3), it was mainly attributed to non-stomatal limitation, though stomatal limitation also existed. In fact, Giménezetal.(1992) and Gunasekeraetal.(1993) have shown by different approaches that the firstgsreduction (highest values) is not matched by a fall inCi, indicating the presence of non-stomatal effects.
3.3 Model comparisons
Models of vegetation function have a major role to play in advancing our understanding of terrestrial ecosystem responses to global change(Ciaisetal., 2007; Gedneyetal., 2006; Ostleetal., 2009; Sitchetal., 2008). Whereas, stomatal conductance, the process that governs plant water use and carbon uptake, is fundamental to such models, as stomatal conductance plays a fundamental role in determining vegetation carbon and water balances. In this paper, we compared the three stomatal conductance models: BWB model, Leuning model, and Medlyn model, inP.tabulaeformisseedlings grown under four soil water treatments and found the correlations betweenAandgsgive a considerably higherR2than the stomatal model of BWB, but give a considerably lowerR2than the stomatal model of Leuning and Medlyn in all of the four soil water treatments. These actually indicated that the correlation betweenAandgswas improved by inclusion of a VPD (leaf-to-air vapour pressure deficit) term instead of the simple RH (relative humidity) term. This conclusion proved the criticism of Aphaloetal.(1991), Mottetal. (1991) and Eamusetal. (2008) to the BWB model that stomata sense transpiration and/or peristomatal water fluxes rather than relative humidity. So when introduced into Leuning and Medlyn model, which incorporating an empirical dependence on leaf-to-air vapour pressure deficit (VPD, kPa), a proxy for transpiration, replacing of relative humidity (RH), the regression coefficientR2was obviously increased. Meanwhile, the Medlyn model performed better than Leuning model, as the Leuning model was just the best fit for W3treatment datasets but had a relatively poor fit for other soil water treatment datasets. We note that the major difference between the Leuning model and the Medlyn model was the form of VPD response lying in the behaviour ofgswhen VPD approaching to zero, as the Leuning model used the hyperbolic VPD response but the Medlyn model used the square root form of VPD. According to the conclusion of Medlynetal.(2011), stomata conductance at low VPD is bounded in Leuning model but unbounded in Medlyn model. In fact, Wangetal.,(2009) had suggested that stomatal conductance was unbounded as VPD approached zero from eddy covariance studies, supporting the conclusion of Medlynetal.(2011). Meanwhile, from the viewpoints of both model correctness and model stability, Medlynetal.(2011) also proved that an unbounded value ofgswas acceptable, as althoughgsmay be unbounded, transpiration (E) is not;E≈gs·VPD, so thatEgoes to zero as VPD goes to zero. So the Medlyn model gives the best fit. Lloyd(1991) had found the square root form of VPD (VPD-1/2) give the best fit to data fromMacadamiaintegrifolia.
For the best fit, the Medlyn model was selected to test the effects of the soil water treatments on the regression relation between simulatedgsand observedgsinP.tabulaeformisseedlings. The result indicated that the relationship between simulatedgsand observedgswas significantly affected by soil water content, as the slope of the relationship (and thereforeSP) clearly differs among soil water treatments. Meanwhile, the significance of the correlation was also changed with the changing of soil water content, in the moderate soil water conditionsR2was high, but in the low soil water conditionsR2declined (Tab.2). This confirms the assuming of Medlynetal.(2011) that the relationship given by the Medlyn model will be changed as soil moisture potential is reduced. According to the study of Medlynetal. (2011), the key model parameterSPwas proportional to both the CO2compensation point and the marginal water cost of plant carbon gain, λ (mol H2O·mol-1C), while the value of λ could be thought of as representing the amount of water that a plant was prepared to spend to gain carbon. As early as in 1986, the theoretical studies of λ suggested that λ was likely to be related to whole-plant carbon-water economy (Givnish, 1986). Later, evidence is accumulating that photosynthetic capacity and maximal stomatal conductance are related to plant hydraulic architecture (Buccietal., 2005; Clearwateretal., 2001; Hubbardetal., 2001; Katuletal., 2003; Tayloretal., 2008). Thus, Medlynetal.(2011) consider the values of λ obtained under well-watered conditions are likely to be a useful quantitative way of characterizing whole-plant level water-use strategies. But under drought conditions, theoretical analysis of the optimal stomatal conductance by Makelaetal. (1996) indicates that the expected value of carbon assimilation is maximized if the value of λ declines as drought progresses. So some models using the empirical approach incorporate an equivalent assumption, reducing the parameterSPas a function of soil moisture content (Kirschbaum, 1999; Salaetal., 1996a), and some recent implementations decrease theSPparameter as a function of leaf water potential rather than soil moisture content (Tuzetetal., 2003). Although such assumptions have been found to improve the simulations whether of forest water use during drought (Salaetal., 1996b), or of leaf-level photosynthesis and transpiration over a growing season (Berningeretal., 1996; Op de Beecketal., 2010). However, very few studies have directly examined how the relationship between photosynthesis and stomatal conductance is affected by drought, except one study onPinusponderosa, which directly examined that question but found the model intercept, rather than the slope, was related to soil moisture potential (Missonetal., 2004). So Medlynetal.(2011) considered may be the relationship given by Medlyn model would break down as soil moisture potential was reduced. All the same, Medlyn model still offers a quantitative framework within which it would be possible to critically examine how soil moisture stress affects stomatal behaviour. On this basis, we suggest that the Medlyn model should incorporate a function which can reflect the influence of soil moisture on the stomatal behaviour to improve the simulation. Like this, the Medlyn model will be able to directly exam how the relationship between photosynthesis and stomatal conductance is affected by soil moisture.
Moreover, we also compared the three stomatal conductance models inP.tabulaeformisseedlings grown under the four soil water conditions separated in morning and afternoon. The results showed that the Medlyn model performed best yet either in the morning or afternoon, and it performed different between in the morning and in the afternoon especially under water stress conditions (W0and W3). There is a major assumption of the Medlyn model that stomatal conductance acts as if it was optimizing for RuBP regeneration-limited photosynthesis rather than Rubisco-limited photosynthesis, but this is not the same as assuming that photosynthesis is always limited by RuBP regeneration. Based on this assumption, the Medlyn model correctly captures the response of stomatal conductance to atmospheric CO2concentration (Ca), which differs considerably according to which limitation is considered. If Rubisco-limited photosynthesis is considered, stomatal conductance is predicted to increase with increasedCa, but if RuBP regeneration-limited photosynthesis is considered, stomatal conductance is predicted to decline nonlinearly withCa, which agrees closely with observations of (Morison, 1987). However, in this research the midday depression of photosynthesisAoccurred across the four soil water conditions especially under water stress conditions (W0and W3), and the reason for themidday depression were Rubisco-limitedand RuBP regeneration-limited (stomatal and non-stomatal limited). So, when both stomatal and non-stomatal limitations exist, the simulation of the relationships between photosynthesis and stomatal conductance should be separated, or incorporated a function to the model which assumes that stomatal conductance is regulated by rates of electron translation and by rates of Rubisco activity, or by the balance between the two processes to improve the simulation.
4 Conclusion
P.tabulaeformissuffered midday depression in photosynthesisAacross the four soil water treatments. But the depression was restored slightly in the afternoon in the medium and high soil water conditions, but was not restored under low soil water conditions. The cause of the midday depression differs across the four soil water treatments. In the low and medium soil water conditions (W0, W1and W2), midday depression inAwas caused by the closure of stomata (stomatal limitation), but in high soil water conditions (W3) midday depression occurred because of a decreased photosynthetic capacity of mesophyll cells (non-stomatal limitation). In addition, in this experiment the Medlyn model performed best in simulating the relationship between photosynthesis and stomatal conductance and that relationship was significantly affected by soil water stress (low or high) and the relative importance of stomatal and non-stomatal limitations of photosynthesis. We propose that the Medlyn model should incorporate a function which can reflect the influence of soil moisture on the stomatal behaviour to improve the simulation of the relationship between photosynthesis and stomatal conductance under different soil water conditions. We also propose when both stomatal and non-stomatal limitations exist, the simulation of the relationships between photosynthesis and stomatal conductance should be separated, or incorporated a function to the model which assumes that stomatal conductance is regulated by rates of electron translation and by rates of Rubisco activity, or by the balance between the two processes to improve the simulation.
Reference
Aphalo P J, Jarvis P G. 1991. Do stomata respond to humidity? Plant, Cell & Environment, 14(1):127-132.
Arnell N W, Knorr W, Prentice I C,etal. 2006. A climate-change risk analysis for world ecosystems. Proceedings of the National Academy of Sciences of the United States, 103(35):13116-13120.
Assmann S M. 1999. The cellular basis of guard cell sensing of rising CO2. Plant, Cell & Environment, 22(6):629-37.
Ball J, Woodrow L E, Beny J A. 1987.A model predicting stomatal conductance and its contribution to the control of photosynthesis under different environmental conditions∥Biggins J. Progress in photosynthesis research. Dordrecht:Springers,221-224.
Ben G Y, Osmond C B, Sharkey T D. 1987. Comparisons of photosynthetic responses of xanthium strumarium and helianthus annuus to chronic and acute water stress in sun and shade. Plant Physiology, 84(2):476-82.
Berninger F, Makela A, Hari P. 1996. Optimal control of gas exchange during drought: Empirical evidence. Annals of Botany, 77(5):469-476.
Berry J A, Downton W J S. 1982.Environmental Regulation of Photosynthesis∥Govindjee. Photosynthesis: development,carbon metabolism and productivity(volⅡ).New York:Academic Press, 263-343.
Bucci S J, Goldstein G, Meinzer F C,etal. 2005. Mechanisms contributing to seasonal homeostasis of minimum leaf water potential and predawn disequilibrium between soil and plant water potential in Neotropical savanna trees. Trees, 19(3):296-304.
Chaves M M. 1991. Effects of Water Deficits on Carbon Assimilation. Journal of Experimental Botany, 42(1):1-16.
Cheeseman J M, Lexa M. 1996. Gas exchange: models and measurements∥Baker N R.Advances in photosynthesis.Netherlands:Springer,223-240.
Ciais P, de Noblet-Ducoudre N, Friedlingstein P,etal. 2007. Changes in climate and land use have a larger direct impact than rising CO2on global river runoff trends. Proceedings of the National Academy of Sciences of the United States, 104(39):15242-15247.
Clearwater M J, Meinzer F C. 2001. Relationships between hydraulic architecture and leaf photosynthetic capacity in nitrogen-fertilized Eucalyptus grandis trees. Tree Physiology, 21(10):683-690.
Cornic G. 1994.Drought stress and high light effects on leaf photosynthesis∥Bake N R, Boger S R.Photoinhibition of photosynthesis: from molecular mechanisms to the field. Oxfard:Bios Scientific,297-313.
Cornic G, Gouallec J L, Briantais J M,etal. 1989. Effect of dehydration and high light on photosynthesis of two C3 plants (PhaseolusvulgarisL. andElatostemarepens(Lour.) Hall f.). Planta, 177(1):84-90.
Cornic G, Massacci A. 1996.Leaf photosynthesis under drougt stress. Photosynthesis and the environment. Dordrecht:Springer,347-366.
Cowan I R, Farquhar G D.1977. Stomatal function in relation to leaf metabolism and environment.Symp Soc Exp Biol,31:471-505.
Demmig-Adams B, Adams W W. 1992. Photoprotection and other responses of plants to high light stress. Annual Review of Plant Physiology and Plant Molecular Biology, 43(1):599-626.
Derek E, Hutley L B, O’Grady A P. 2001. Daily and seasonal patterns of carbon and water fluxes above a north Australian savanna. Tree Physiology, 21(12/13):977-988.
Eamus D, Taylor D T, Macinnis-Ng C M O,etal. 2008. Comparing model predictions and experimental data for the response of stomatal conductance and guard cell turgor to manipulations of cuticular conductance, leaf-to-air vapour pressure difference and temperature: feedback mechanisms are able to account for all observations. Plant, Cell & Environment, 31(3):269-277.
Escalona J M, Flexas J, Medrano H. 2000. Stomatal and non-stomatal limitations of photosynthesis under water stress in field-grown grapevines. Functional Plant Biology, 27(1):87.
Farquhar G D, Sharkey T D. 1982. Stomatal conductance and photosynthesis. Annual Review of Plant Physiology, 33:317-345.
Farquhar G D, Wong S C. 1984. An empirical model of stomatal conductance. Functional Plant Biology, 11(3):191-210.
Flexas J, Medrano H. 2002. Drought-inhibition of photosynthesis in C3 plants: Stomatal and non-stomatal limitations revisited. Annals of Botany, 89(2):183-189.
Foyer C, Furbank R, Harbinson J,etal. 1990. The mechanisms contributing to photosynthetic control of electron transport by carbon assimilation in leaves. Photosynth Res, 25(2):83-100.
Gedney N, Cox P M, Betts R A,etal. 2006. Detection of a direct carbon dioxide effect in continental river runoff records. Nature, 439(7078):835-838.
Genty B, Briantais J M, Da Silva J B V. 1987. Effects of drought on primary photosynthetic processes of cotton leaves. Plant Physiology, 83(2):360-364.
Gimenez C, Mitchell V J, Lawlor D W. 1992. Regulation of photosynthetic rate of two sunflower hybrids under water stress. Plant Physiology, 98(2):516-524.
Givnish T J, 1986. Optimal stomatal conductance, allocation of energy between leaves and roots, and the marginal cost of transpiration∥Givnish T J. On the economy of plant form and function.Cambridge:Cambridge Univesity Press,171-213.
Grant R F, Wall G W, Kimball B A,etal. 1999. Crop water relations under different CO2and irrigation: testing of ecosys with the free air CO2enrichment (FACE) experiment. Agricultural and Forest Meteorology, 95(1):27-51.
Grantz D A. 1990. Plant response to atmospheric humidity. Plant, Cell & Environment, 13(7):667-679.
Grassi G, Magnani F. 2005. Stomatal, mesophyll conductance and biochemical limitations to photosynthesis as affected by drought and leaf ontogeny in ash and oak trees. Plant, Cell & Environment, 28(7):834-849.
Gunasekera D, Berkowitz G A. 1993. Use of transgenic plants with ribulose-1,5-bisphosphate carboxylase/oxygenase antisense DNA to evaluate the rate limitation of photosynthesis under water stress. Plant Physiology, 103(2):629-635.
Guo L W, Xu D Q, Shen Y K. 1994. The cause of midday decline ofphotosynthesis efficiency in cotton leaves under field condition. Acta Phytophysiology Sin, 20:360-366.
Guo L W, Xu D Q, Shen Y K. 1996. Relation between photorespiration and photoinhibition in cotton leaves. Chinese Science Bulletin, 41(5):415-420.
Hari P, Mäkelä A, Korpilahti E,etal. 1986. Optimal control of gas exchange. Tree Physiology, 2(1/3):169-175.
Hilborn R, Mangel M. 1997. The ecological detective: Confronting models with data. Princeton:Princeton University Press.
Hsiao T C. 1973. Plant responses to water stress. Annual Review of Plant Physiology, 24(1):519-570.
Huang L F, Zheng J H, Zhang Y Y,etal. 2006. Diurnal variations in gas exchange, chlorophyll fluorescence quenching and light allocation in soybean leaves: The cause for midday depression in CO2assimilation. Scientia Horticulturae, 110(2):214-218.
Hubbard R M, Ryan M G, Stiller V,etal. 2001. Stomatal conductance and photosynthesis vary linearly with plant hydraulic conductance in ponderosa pine. Plant, Cell & Environment, 24(1):113-121.
Ishida A, Toma T, Marjenah. 1999. Limitation of leaf carbon gain by stomatal and photochemical processes in the top canopy of Macaranga conifera, a tropical pioneer tree. Tree Physiology, 19(7):467-473.
Ishida A, Toma T, Matsumoto Y,etal. 1996. Diurnal changes in leaf gas exchange characteristics in the uppermost canopy of a rain forest tree,DryobalanopsaromaticaGaertn. f. Tree Physiology, 16(9):779-785.
Jones H G. 1998. Stomatal control of photosynthesis and transpiration. Journal of Experimental Botany, 49(S):387-398.
Kaiser W M. 1987. Effects of water defieit on photosynthetic capacity. Physiologia Plantarum, 71(1):142-150.
Katul G, Leuning R, Oren R. 2003. Relationship between plant hydraulic and biochemical properties derived from a steady-state coupled water and carbon transport model. Plant, Cell & Environment, 26(3):339-350.
Katul G G, Palmroth S, Oren R. 2009. Leaf stomatal responses to vapour pressure deficit under current and CO2-enriched atmosphere explained by the economics of gas exchange. Plant, Cell & Environment, 32(8):968-979.
Kirschbaum M U F. 1999. CenW, a forest growth model with linked carbon, energy, nutrient and water cycles. Ecological Modelling, 118(1):17-59.
Krinner G, Viovy N, de Noblet-Ducoudré N,etal. 2005. A dynamic global vegetation model for studies of the coupled atmosphere-biosphere system. Global Biogeochemical Cycles, 19(1):GB1015.
Lange O L, Tenhunen J D, Beyschlag W. 1985. Effects of humidity during diurnal courses on the CO2-and light-saturated rate of net CO2uptake in the sclerophyllous leaves of Arbutus unedo. Oecologia, 67:301-304.
Lawlor D W. 1995. The effects of water deficit on photosynthesis∥Smirnoff N.Environmental and plant metabolism: Flexibility and acclimation.Oxford:bios scientific publishers,129-160.
Lawlor D W. 2002. Limitation to photosynthesis in water-stressed leaves: Stomata vs. metabolism and the role of ATP. Annals of Botany, 89(7):871-885.
Leuning R. 1990. Modelling stomatal behaviour and and photosynthesis ofEucalyptusgrandis. Functional Plant Biology, 17(2):159-175.
Leuning R. 1995. A critical appraisal of a combined stomatal-photosynthesis model for C3 plants. Plant, Cell & Environment, 18(4):339-355.
Li X R, Liu Q J, Cai Z,etal. 2007. Specific leaf area and leaf area index of conifer plantations in Qianyanzhou station of subtropical China. Acta Phytoecology Sinica, 31(1):93-101.
Lin Y S, Medlyn B E, Duursma R,etal. 2015. Optimal stomatal behaviour around the world.Natare Climate Change,5:459-464.
Liu Q. 2002.Ecological research on subalpine coniferous forests in China. Chengdu:Sichuan University Press.
Lloyd J. 1991. Modelling stomatal responses to environment inMacadamiaintegrifolia. Functional Plant Biology, 18(6):649-660.
Long S P, Humphries S, Falkowski P G. 1994. Photoinhibition of photosynthesis in nature. Annual Review of Plant Physiology and Plant Molecular Biology, 45(1):633-662.
Ma Q Y. 1989. Dividing the main region of Chinese Pine based on climatic factors. Journal of Beijing Forestry University, 11(2):1-9.
Maier-Maercker U. 1983. The role of peristomatal transpiration in the mechanism of stomatal movement. Plant, Cell & Environment, 6(5):369-380.
Makela A, Berninger F, Hari P. 1996. Optimal control of gas exchange during drought: Theoretical analysis. Annals of Botany, 77(5):461-468.
Medlyn B E, Berbigier P, Clement R,etal. 2005. Carbon balance of coniferous forests growing in contrasting climates: Model-based analysis. Agricultural and Forest Meteorology, 131(1/2):97-124.
Medlyn B E, Duursma R A, Eamus D,etal. 2011. Reconciling the optimal and empirical approaches to modelling stomatal conductance. Global Change Biology, 17(6):2134-2144.
Medrano H, Parry M A J, Socias X,etal. 1997. Long term water stress inactivates Rubisco in subterranean clover. Annals of Applied Biology, 131(3):491-501.
Misson L, Panek J A, Goldstein A H. 2004. A comparison of three approaches to modeling leaf gas exchange in annually drought-stressed ponderosa pine forests. Tree Physiology, 24(5):529-541.
Morison J I L. 1987. Intercellular CO2concentration and stomatal response to CO2∥Zeiger E,Farquhar G D, Comen I R. Stomatal function. California:Stanford University Press,229-251.
Mott K A, Parkhurst D F. 1991. Stomatal responses to humidity in air and helox. Plant, Cell & Environment, 14(5):509-515.
Muraoka H, Tang Y, Terashima I,etal. 2000. Contributions of diffusional limitation, photoinhibition and photorespiration to midday depression of photosynthesis inArisaemaheterophyllumin natural high light. Plant, Cell & Environment, 23(3):235-250.
Nemani R R, Keeling C D, Hashimoto H,etal. 2003. Climate-driven increases in global terrestrial net primary production from 1982 to 1999. Science, 300(5625):1560-1563.
Ogren E. 1988. Photoinhibition of photosynthesis in willow leaves under field conditions. Planta, 175(2):229-36.
Olioso A, Carlson T N, Brisson N. 1996. Simulation of diurnal transpiration and photosynthesis of a water stressed soybean crop. Agricultural and Forest Meteorology, 81(1/2):41-59.
Op de Beeck M, Löw M, Deckmyn G,etal. 2010. A comparison of photosynthesis-dependent stomatal models using twig cuvette field data for adult beech (FagussylvaticaL.). Agricultural and Forest Meteorology, 150(4):531-540.
Ostle N J, Smith P, Fisher R,etal. 2009. Integrating plant-soil interactions into global carbon cycle models. Journal of Ecology, 97(5):851-863.
Peterson R B, Sivak M N, Walker D A. 1988. Relationship between steady-state fluorescence yield and photosynthetic efficiency in spinach leaf tissue. Plant Physiology, 88(1):158-163.
Powles S B. 1984. Photoinhibition of photosynthesis induced by visible light. Annual Review of Plant Physiology, 35(1):15-44.
Prior L D, Derek E, Duff G A. 1997. Seasonal and diurnal patterns of carbon assimilation, stomatal conductance and leaf water potential inEucalyptustetrodontasaplings in a wet-dry savanna in northern Australia. Australian Journal of Botany, 45(2):241-258.
Quick W P, Chaves M M, Wendler R,etal. 1992. The effect of water stress on photosynthetic carbon metabolism in four species grown under field conditions. Plant, Cell & Environment, 15(1):25-35.
Raschke K, Resemann A. 1986. The midday depression of CO2assimilation in leaves ofArbutusunedoL.: diurnal changes in photosynthetic capacity related to changes in temperature and humidity. Planta, 168(4):546-558.
Sala A, Tenhunen J D. 1996a. Simulations of canopy net photosynthesis and transpiration in QuercusilexL. under the influence of seasonal drought. Agricultural & Forest Meteorology, 78(3/4):203-222.
Sala A, Tenhunen J D. 1996b. Simulations of canopy net photosynthesis and transpiration in QuercusilexL. under the influence of seasonal drought. Agricultural and Forest Meteorology, 78(3/4):203-222.
Sheriff D W. 1984. Epidermal transpiration and stomatal responses to humidity: some hypotheses explored. Plant, Cell & Environment, 7(9):669-677.
Sitch S, Huntingford C, Gedney N,etal. 2008. Evaluation of the terrestrial carbon cycle, future plant geography and climate-carbon cycle feedbacks using five dynamic global vegetation models (DGVMs). Global Change Biology, 14(9):2015-2039.
Tardieu F, Davies W J. 1993. Integration of hydraulic and chemical signalling in the control of stomatal conductance and water status of droughted plants: opinion. Plant, Cell & Environment, 16(4):341-349.
Taylor D, Eamus D. 2008. Coordinating leaf functional traits with branch hydraulic conductivity: resource substitution and implications for carbon gain. Tree Physiology, 28(8):1169-1177.
Tezara W, Lawlor D W. 1995.Effects of water stress on the biochemistry and physiology of photosynthesis in sunflower∥Mathrs P. Photosynthesis: from light to biosphere.Dordrecht:Klurver Academic Publishers,625-628.
Tezara W, Mitchell V J, Driscoll S D,etal. 1999. Water stress inhibits plant photosynthesis by decreasing coupling factor and ATP. Nature, 401(6756):914-917.
Tourneux C, Peltier G. 1995. Effect of water deficit on photosynthetic oxygen exchange measured using18O2and mass spectrometry inSolanumtuberosumL. leaf discs. Planta, 195(4):570-577.
Tuzet A, Perrier A, Leuning R. 2003. A coupled model of stomatal conductance, photosynthesis and transpiration. Plant, Cell & Environment, 26(7):1097-1116.
Wang S, Yang Y, Trishchenko A P. 2009. Assessment of canopy stomatal conductance models using flux measurements. Ecological Modelling, 220(17):2115-2118.
Wise R R, Frederick J R, Alm D M,etal. 1990. Investigation of limitations to photosynthesis induced by leaf water deficit in field-grown sunflower. Plant, Cell & Environment, 13(9):923-931.
Wong S C, Cowan I R, Farquhar G D. 1979. Stomatal conductance correlates with photosynthetic capacity. Nature, 282(5737):424-426.
Xu D Q. 1988. Photosynthetic efficiency. Plant Physiology Communications, 24(5):3-9.
Xu D Q. 1997. Some problems in stomatal limitation analysis of photosynthesis. Plant Physiology Communications, 33(4):241-245.
Zheng W J, Fu L G. 1978.Flora of China (Ⅶ). Beijing:Science Press, 32-281.
(责任编辑 王艳娜 郭广荣)
date: 2016-03-01; Revised date: 2017-03-21.
Stomatal and Non-Stomatal Limitation to Photosynthesis inPinustabulaeformisSeedling under Different Soil Water Conditions: Experimental and Simulation Results
Guo Wenxia1, 2, 3Zhao Zhijiang4Zheng Jiao1Li Junqing1
(1.KeyLaboratoryforSilvicultureandConservationofMinistryofEducation,BeijingForestryUniversityBeijing100083; 2.ChineseSocietyofForestryBeijing100091; 3.PlantFunctionalBiologyandClimateChangeCluster,theUniversityofTechnologySydneyNSW2007; 4.FujianCIECCEngineeringConsultingCo.LtdFuzhou350003)
Midday depression in photosynthesis is common in plants, but the relative importance of stomatal and non-stomatal limitation to photosynthesis is variable among species.Pinustabulaeformisis a conifer and distributed widely over China, which suggests its adaptability to a wide range of climate and soil water conditions. The aims of this study were to (a) understand the leaf gas exchange characteristics and stomatal and non-stomatal limitation of photosynthesis inP.tabulaeformisseedlings under different soil water conditions; (b) to compare the relationships between photosynthesis and stomatal conductance through simulation with three stomatal models; and (c) to determine the impact of the soil water content and the CO2supply and demand on the simulation results. We measured diurnal variations in leaf-scale gas exchange ofP.tabulaeformisseedlings grown under four soil water conditions: 8% (W0), 12% (W1), 16% (W2) and 20% (W3) soil water content. There was a clear midday depression of net CO2assimilation rate (A) and stomatal conductance (gs) in the all four soil water conditions. In the low and moderate soil water conditions (W0, W1and W2), the midday depression inAandgswas accompanied with the decrease in intercellular CO2concentration (Ci). However, in the high soil water condition (W3), the decreases inAandgsat midday were coupled with an increase inCi. In addition, reduction ofgswas bigger than the inhibition ofAin the W0, W1and W2. By contrast, in the W3treatment, change ingswas in a smaller magnitude than the inhibition ofA. Moreover, a high correlation betweenAandgswas observed across all treatments, and decrease inCiparalleled to reductions ingsin W0, W1and W2treatments. However, in the W3treatment,Aandgscorrelated positively with each other, andCiremained unchanged at highgsand either increased or decreased at lowgs. These results suggested that midday depression ofAin W0, W1and W2soil water conditions was caused by closure of stomata rather than a decreased photosynthetic capacity of mesophyll cells. In contrast, midday depression inAin wet soil was controlled by non-stomatal decreases in the photosynthetic capacity of mesophyll cells. The comparison of stomatal models showed that the Medlyn model performed best in all of the four soil water conditions whether or not morning and afternoon were analysed separately. However the relationships between photosynthesis and stomatal conductance simulated by the Medlyn model differed significantly in different soil water treatments, and with morning and afternoon data separated, indicating that the Medlyn model can be improved by incorporating a function which can reflect the influence of soil moisture on the stomatal behaviour in different soil water conditions. Furthermore, it is suggested that the model simulations should be run separately in morning and afternoon for the plants that have remarkable midday depression in photosynthesis. Finally, we suggest that when both stomatal and non-stomatal limitations exist, the simulation of the relationships between photosynthesis and stomatal conductance should be operated separately, and a function, which assumes that stomatal conductance is regulated by rates of electron translation and by rates of Rubisco activity, or by the balance between the two processes, should be incorporated into the model to improve the simulation.
Pinustabulaeformis; leaf gas exchange; stomatal conductance; empirical stomatal model; optimal stomatal model
10.11707/j.1001-7488.20170703
S718.43
A
1001-7488(2017)07-0018-19
Fund project: Beijing to Build Key Discipline “Ecology” Project (20140801); High Level University Construction Project of China Scholarship Council (2012).
* Li Junqing is corresponding author. We thank Prof. Shen Yingbai for the advice in the design of the experiment, associate professor Lei Niya for her help in the purchase ofP.tabulaeformisseedlings, the staff (Yan Zhigang, Yan Zhiyong and Dong Xiaoyong) of Beijing Forestry University Nursery for their help during the experiment. Thank Professors Yu Qiang (University of Alberta) and Derek Eamus (University of Technology Sydney) for their comments on earlier drafts of this manuscript.
猜你喜欢
南方农业·下旬(2022年4期)2022-05-24
农业工程学报(2022年3期)2022-04-16
山西林业(2021年2期)2021-07-21
生态学报(2021年6期)2021-04-25
农业工程学报(2021年3期)2021-04-15
节水灌溉(2020年9期)2020-09-16
中国水土保持科学(2019年6期)2019-04-26
现代园艺(2017年22期)2018-01-19
新课程·下旬(2017年7期)2017-08-14
西北林学院学报(2015年5期)2015-01-03