4.81%光电转换效率的全固态致密PbS量子点薄膜敏化TiO2纳米棒阵列太阳电池
2017-11-01 18:11陈军军史成武张正国肖冠南邵章朋李楠楠
物理化学学报 2017年10期
陈军军 史成武 张正国 肖冠南 邵章朋 李楠楠
(合肥工业大学化学与化工学院,合肥 230009)
4.81%光电转换效率的全固态致密PbS量子点薄膜敏化TiO2纳米棒阵列太阳电池
陈军军 史成武*张正国 肖冠南 邵章朋 李楠楠
(合肥工业大学化学与化工学院,合肥 230009)
利用TiO2纳米棒阵列和在旋涂辅助连续离子层吸附反应过程中使用乙二硫醇的策略,成功地在TiO2纳米棒阵列上获得了致密PbS量子点薄膜,组装了新颖结构的全固态致密PbS量子点薄膜敏化TiO2纳米棒阵列太阳电池。研究了TiO2纳米棒阵列长度对全固态致密PbS量子点薄膜敏化太阳电池光伏性能的影响,发现TiO2纳米棒阵列长度为290、540和1040 nm时,相应太阳电池的光电转换效率分别是2.02%、4.81%和 1.95%。对于组装全固态量子点敏化太阳电池,综合考虑空穴传输长度和量子点担载量的平衡是获得较高光电转换效率的关键所在。
致密PbS量子点薄膜;TiO2纳米棒阵列;乙二硫醇;连续离子层吸附反应;全固态量子点敏化太阳电池
1 Introduction
PbS quantum-dot (QD) sensitized TiO2thin film solar cells have received world-wide attention due to the properties of PbS QDs such as large exciton Bohr radius of 18 nm, multiple exciton's generation, tunable bandgaps and high absorption coefficient1−5. The microstructure of TiO2thin film, preparation of PbS QDs and the chemical composition of electrolytes have significant effects on the photovoltaic performance of PbS QD sensitized solar cells. Jiao et al.6fabricated PbS QD sensitized solar cells using 15 μm-thickness TiO2mesoporous thin films,oleic acid capped PbS QDs and polysulfide liquid electrolytes and the corresponding solar cells obtained the photoelectric conversion efficiency (PCE) of 7.19%. Im et al.7assembled PbS QD sensitized solar cells using 1 μm-thickness TiO2mesoporous thin films, oleic acid capped PbS QDs and all solid-state electrolytes (PEDOT:PSS, P3HT) and the corresponding solar cells reached the PCE of 2.9%. Tao et al.8prepared 4 μm-thickness TiO2nanotube arrays by the anodization of Ti sheets and the corresponding solar cells with oleic acid capped PbS QDs and I3−/I−liquid electrolytes gave the PCE of 3.41%. Han et al.9prepared the TiO2nanorod array with the length of 2 μm and the diameter of 130 nm by hydrothermal methods and fabricated the QD co-sensitized photoanode with the structure of ZnS/PbS(4)/CuInS2(6)/TiO2nanorod array using successive ionic layer absorption and reaction (SILAR) methods. And the corresponding solar cells with polysulfide liquid electrolytes obtained the PCE of 4.11%.To the best of our knowledge, the all solid-state PbS QD thin film sensitized TiO2nanorod array solar cells have not been reported.
In this work, the solar cells with the novel structure of FTO/compact PbS QD thin film sensitized TiO2nanorod arrays/spiro-OMeTAD/Au were assembled and the influence of TiO2nanorod array lengths on the photovoltaic performance of all solid-state compact PbS QD thin film sensitized solar cells was evaluated.
2 Experimental
2.1 Preparation of TiO2nanorod arrays with different lengths
All chemicals were of analytical grade and were used as received without further purification. TiO2nanorod arrays with different lengths were prepared by hydrothermal methods according to the reported procedure10,11. In brief, the hydrothermal synthesis was carried out in a stainless steel autoclave with the Teflon liner of 50 mL capacity. 20 mL of 37%hydrochloric acid was added in the 20 mL of deionized water and sonicated for 5 min. Subsequently, 450 μL of titanium isopropoxide was added and further sonicated for 5 min. The aqueous grown solution containing 0.038 mol∙L−1titanium isopropoxide and 6 mol∙L−1hydrochloric acid was obtained.Then two pieces of FTO (2.0 cm × 1.5 cm) with 60 nm-thickness TiO2compact layer12were positioned tilted inside the Teflon liner with the active layer facing the wall. The properly sealed autoclave was placed inside the oven preheated to 170 °C and the growth time was set to 75, 100 and 120 min.After the autoclave was naturally cooled to room temperature in air, the two pieces of FTO were taken out from the autoclave,rinsed thoroughly, and annealed at 450 °C for 30 min in air prior to use.
2.2 Preparation of the compact PbS QD thin film sensitized TiO2nanorod arrays
The compact PbS QD thin film sensitized TiO2nanorod arrays with different lengths were formed by the spin-coatingassisted SILAR method. Firstly, 50 mL of 0.005 mol∙L−1Pb(NO3)2solution in methanol/deionized water (95/5, volume ratio (φ)), 0.005 mol∙L−1Na2S·9H2O solution in methanol/deionized water (95/5, φ) and 1% 1,2-ethanedithiol (EDT)solution in ethanol (1/99, φ) were prepared. Subsequently, 100 μL of 0.005 mol·L−1Pb(NO3)2·solution was dropped onto TiO2nanorod arrays and spin-coated at 1500 r·min−1for 20 s, 100 μL of 0.005 mol∙L−1Na2S·9H2O solution was dropped onto the Pb2+-adsorbed TiO2nanorod arrays and spin-coated at 1500 r·min−1for 20 s, then 100 μL of 1% EDT solution was dropped and spin-coated at 1500 r·min−1for 20 s. The above three steps were denoted as one cycle and the cycle was repeated for 20 times. The compact PbS QD thin film sensitized TiO2nanorod arrays with different lengths were obtained by the spin-coatingassisted SILAR method using EDT.
2.3 Solar cell fabrication and characterization
The all solid-state QD sensitized solar cells with compact PbS QD thin films and the TiO2nanorod arrays were fabricated using spiro-OMeTAD as the hole transporting material. The chemical composition of the spiro-OMeTAD solution was as follows: 72.3 mg spiro-OMeTAD, 28.8 μL 4-tert-butylpyridine,17.5 μL bis(trifluoromethane) sulfonamide lithium salt(Li-TFSI) solution (520 mg∙mL−1in acetonitrile), 29 μL tris(2-(1H-pyrazol-1-y1)-4-tert-butylpyridine)cobalt(III)-bis(trifluoro-methylsulphonyl)imide (300 mg∙mL−1in acetonitrile)in 1 mL chlorobenzene. And 40 μL of the spiro-OMeTAD solution was dropped on the compact PbS QD thin film sensitized TiO2nanorod arrays and spin-coated at 4000 r·min−1for 30 s. The Au electrode was deposited by thermal evaporation under a pressure of 1 × 10⁻⁵Pa. The all solid-state QD sensitized solar cells with compact PbS QD thin films and the TiO2nanorod arrays were obtained.
The high-resolution XRD patterns of the compact PbS QD thin films were measured using Cu Kαradiation (λ = 0.15418 nm, 40 kV, 40 mA, Rigaku, Japan) in the 2θ range of 28°−32°at a scanning rate of 0.01 (°)·s−1. The surface and crosssectional morphology of the TiO2nanorod arrays and the compact PbS QD thin film sensitized TiO2nanorod arrays was observed by the field emission scanning electron microscope(FE-SEM, Gemini SEM 500, Zeiss) and (FE-SEM, Sirion 200,FEI). The microstructure of the compact PbS QD thin film sensitized TiO2nanorod arrays was observed by High-resolution transmission electron microscopy (HRTEM, JEMARM200F, JEOL). The measurement of XRD, UV-Vis and the photovoltaic performance were the same as our previous reports13,14. The active area of 0.09 cm2was defined by the black and opaque film with the square aperture (3 mm × 3 mm)adhered on FTO.
3 Results and Discussion
3.1 Morphology, crystal phase and absorption spectra of TiO2nanorod arrays
Fig.1 showed the surface and cross-sectional SEM images of TiO2nanorod arrays with the growth time of 75, 100 and 120 min. The length, diameter and areal density of the corresponding TiO2nanorod arrays were listed in Table 1. With the increase of the growth time from 75 to 100 and 120 min,the lengths and diameters of TiO2nanorod arrays increased from 290 and 15 nm to 540 and 20 nm, 1040 and 24 nm, and the areal densities of TiO2nanorod arrays decreased from 710 to 530 and 300 μm−2. The surface areas of the TiO2nanorod arrays with the lengths of 290, 540 and 1040 nm were about 10,18, 24 μm2on the FTO surface of 1 μm2. The increase of the TiO2nanorod array surface areas was benefit to increase the loading quantities of PbS QDs, while the increase of TiO2nanorod array lengths may restrain the hole transporting due to increasing the thickness of the spiro-OMeTAD layer.
Fig.2 displayed the XRD patterns of TiO2nanorod arrays with the lengths of 290, 540 and 1040 nm. From Fig.2, the diffraction peaks at 2θ = 36.1°, 62.8° were observed,corresponding to the spacing of (101) and (002) planes of TiO2with the tetragonal rutile phase10,11, and their intensity increased with the length increase of TiO2nanorod arrays.When the length of TiO2nanorod arrays was 290 nm, the diffraction peaks at 2θ = 36.1° and 62.8° were weak to be hardly observed.
Fig.3 displayed UV-Vis spectra of TiO2nanorod arrays with the lengths of 290, 540 and 1040 nm. From Fig.3, the absorption onset of the TiO2nanorod arrays with the length of 290, 540 and 1040 nm was 400, 440 and 470 nm, respectively.And an obvious red shift of the absorption onset was observed with the increase of the TiO2nanorod array length and diameter.The result should be because the increase of TiO2nanorod array lengths and diameters reduced the reflection and transmission15.

Table 1 Lengths, diameters and areal densities of the TiO2 nanorod arrays.
3.2 Morphology, crystal phase and absorption spectra of the compact PbS QD thin film sensitized TiO2nanorod arrays
Fig.4 showed the surface and cross-sectional SEM images of the compact PbS QD thin film sensitized TiO2nanorod arrays.Compared with Fig.1, it was found that the compact PbS QD thin films were firstly obtained on the surface of TiO2nanorod arrays by the combination of TiO2nanorod arrays and using EDT in the spin-assisted SILAR procedure. And the compact PbS QD thin film can improve the electron injection of the conduction band from compact PbS QD thin films to TiO2nanorod arrays and suppress the charge recombination with the electron of TiO2conduction band and the hole of spiro-OMeTAD, due to preventing the direct contact of TiO2nanorod arrays and spiro-OMeTAD layers. Because the interspace in TiO2nanorod arrays was not completely filled by PbS QDs, the fabricated solar cells should be assigned to a novel QD sensitized solar cell, the compact PbS QD thin film sensitized TiO2nanorod array solar cell. Moreover, the agglomeration phenomenon of PbS QDs on the top of TiO2nanorod arrays decreased with the increase of TiO2nanorod array lengths. This was because the areal densities of the corresponding TiO2nanorod arrays decreased from 710 to 530 and 300 μm−2and the interval between the neighbor TiO2nanorod increased.

Fig.1 Surface and cross-sectional SEM images of the TiO2 nanorod arrays.The growth time: (a, d) 75 min, (b, e) 100 min, (c, f) 120 min.
Fig.5 showed the XRD patterns of the compact PbS QD thin film sensitized TiO2nanorod arrays. From Fig.5, the diffraction peak at 2θ = 30.0° appeared, corresponding to the spacing of(200) plane of the cubic PbS (JCPDS: 78-1057), which was in accordance with the literatures9,16. The average crystal sizes of PbS QDs can be estimated using the Scherrer equation from the full width at half maximum (FWHM) of the (200) peak.Although the intensity of the diffraction peak at 2θ = 30.0°increased with the increase of TiO2nanorod array lengths, there was no obvious difference of the FWHM and the average crystal sizes of PbS QDs were all 7.8 nm. In other words, the intensity increase of the diffraction peak at 2θ = 30.0° should be related to the loading quantities of PbS QDs on TiO2nanorod arrays. Fig.6 showed the HRTEM image of the compact PbS QD thin film sensitized TiO2nanorod arrays with the length of 540 nm. Clearly distinguishable lattice fringes of PbS QDs can be observed and the distance between lattice fringes was 0.29 nm, corresponding to the spacing of (200)plane of the cubic PbS (JCPDS: 78-1057). The result of XRD and HRTEM demonstrated that PbS QDs were successfully obtained.
Fig.7 showed UV-Vis spectra of the compact PbS QD thin film sensitized TiO2nanorod arrays. From Fig.7, the absorbance of the compact PbS QD thin film sensitized TiO2nanorod arrays enhanced with the length and surface area increase of TiO2nanorod arrays. The result implied that the loading quantities of PbS QDs should be increased in TiO2nanorod arrays. Also, the red-shift of absorption onsets with the increase of loading quantities of PbS QDs was observed, which was similar with the UV-Vis spectra of TiO2nanorod arrays in Fig.315.

Fig.2 XRD patterns of the TiO2 nanorod arrays.
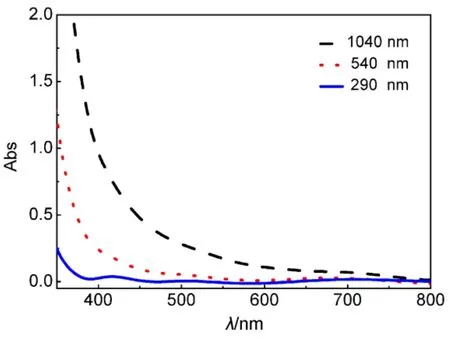
Fig.3 UV-Vis spectra of the TiO2 nanorod arrays.
3.3 The photovoltaic performance of all solid-state compact PbS QD thin film sensitized solar cells

Fig.4 Surface and cross-sectional SEM images of the compact PbS QD thin film sensitized TiO2 nanorod array.The TiO2 nanorod length: (a, d) 290 nm, (b, e) 540 nm, (c, f) 1040 nm.
Table 2 listed the photovoltaic performance parameters of the all-solid-state compact PbS QD thin film sensitized TiO2nanorod array solar cells and the corresponding photocurrent−photovoltage characteristics and the cross-sectional SEM images of the solar cell with the best PCE were shown in Fig.8.When the length of TiO2nanorod arrays increased from 290 nm to 540 nm, the short-circuit photocurrent density (Jsc)increased from 6.65 to 15.32 mA·cm−2. This result was in accordance with the absorbance of the compact PbS QD thin film sensitized TiO2nanorod arrays and the loading quantities of PbS QDs in TiO2nanorod arrays. When the length of TiO2nanorod arrays increased from 540 nm to 1040 nm, Jscdecreased from 15.32 to 6.94 mA∙cm−2. This result should be because the hole diffusion length cannot afford the carrier transporting in the composite structure of PbS QDs and spiro-OMeTAD, and the charge separation efficiency should be decreased in the interface of compact PbS QD thin film/spiro-OMeTAD layer. The fill factor (FF) with the TiO2nanorod array length of 290 nm was lower than that of 540 nm,and this may be related to the agglomeration of PbS QDs on the top of TiO2nanorod arrays. The FF with the TiO2nanorod array length of 540 nm was higher than that of 1040 nm, and this should be related to the hole diffusion length of spiro-OMeTAD. Therefore, the all solid-state compact PbS QD thin film sensitized TiO2nanorod array solar cell with the length of 540 nm achieved the PCE of 4.81%, along with Vocof 0.51 V, Jscof 15.32 mA·cm−2and FF of 61.24%. To achieve the high PCE of the all solid-state QD sensitized solar cells, it was very important to consider the balance of the hole diffusion length and the loading quantities of QDs. Moreover, the PCE of 4.81% with spiro-OMeTAD was higher than that of 1.13%without spiro-OMeTAD, and this result implied that the hole transporting material must be applied to fabricate the solar cell and the compact PbS QD thin film solar cell should be assigned to the QD sensitized solar cell.

Fig.5 XRD patterns (a) and high-resolution XRD patterns (b) of the compact PbS QD thin film sensitized TiO2 nanorod arrays.

Fig.6 HRTEM image of the compact PbS QD thin film sensitized TiO2 nanorod arrays.

Fig.7 UV-Vis absorption spectra of the compact PbS QD thin film sensitized TiO2 nanorod arrays.

Table 2 Photovoltaic performance parameters of all solid-state compact PbS QD thin film sensitized TiO2 nanorod array solar cells.

Fig.8 Photocurrent-photovoltage characteristics of all solid-state compact PbS QD thin film sensitized TiO2 nanorod array solar cells (a) and the cross-sectional SEM image of the solar cell with the best PCE (b).
4 Conclusions
The compact PbS QD thin film was successfully prepared by the combination of TiO2nanorod arrays and using EDT in the procedure of the spin-coating-assisted SILAR, and the solar cell with the novel structure of FTO/compact PbS QD thin film sensitized TiO2nanorod arrays/spiro-OMeTAD/Au was assembled. The all solid-state PbS QD thin film sensitized TiO2nanorod array solar cell with the length of 540 nm achieved the PCE of 4.81%, along with Vocof 0.51 V, Jscof 15.32 mA·cm−2and FF of 61.24%.
(1) Gonzá lez-Pedro, V.; Sima, C.; Marzari, G.; Boix, P. P.; Gimé nez, S.;Shen, Q.; Dittrich, T.; Mora-Seró, I. Phys. Chem. Chem. Phys. 2013,15, 13835. doi: 10.1039/c3cp51651b
(2) Zhang, X.; Justo, Y.; Maes, J.; Walravens, W.; Zhang, J.; Liu, J.; Hens,Z.; Johansson, E. M. J. J. Mater. Chem. A, 2015, 3, 20579.doi: 10.1039/c5ta07111a
(3) Jang J.; Shim H. C.; Ju Y.; Song J. H.; An H.; Yu J. S.; Kwak S. W.;Lee T. M.; Kim I.; Jeong S. Nanoscale 2015, 7, 8829.doi: 10.1039/c5nr01508a
(4) Gao, J.; Perkins, C. L.; Luther, J. M.; Hanna, M. C.; Chen, H. Y.;Semonin, O. E.; Nozik, A. J.; Elingson, R. J.; Beard M. C. Nano Lett.2011, 11, 3263. doi: org/10.1021/nl2015729
(5) Lan, X.; Voznyy, O.; Kiani, A.; Garcia de Arquer F. P.; Abbas, A. S.;Kim, G. H.; Liu M.; Yang, Z.; Walters, G.; Xu, J.; Yuan, M.; Ning, Z.;Fan, F.; Kanjanaboos, P.; Kramer, I.; Zhitomirsky, D.; Lee, P.;Perelgut, A.; Hoogland, S.; Sargent, E. H. Adv. Mater. 2016, 28, 299.doi: 10.1002/adma.201503657
(6) Jiao, S.; Wang, J.; Shen Q.; Li, Y.; Zhong, X. J. Mater. Chem. A 2016,4, 7214. doi: 10.1039/c6ta02465c
(7) Im, S. H.; Kim, H.; Kim, S. W.; Kim, S. W.; Seok, S. I. Energy Environ. Sci. 2011, 4, 4181 doi: 10.1039/c1ee01774h
(8) Tao, L.; Xiong, Y.; Liu, H.; Shen, W. Nanoscale 2014, 6, 931.doi: 10.1039/c3nr04461k
(9) Han, M.; Jia, J.; Yu, L.; Yi, G. RSC Adv. 2015, 5, 51493.doi: 10.1039/c5ra07409f
(10) Kim, H. S.; Lee, J. W.; Yantara, N.; Boix, P. P.; Kulkarni, S. A.;Mhaisalkar, S.; Grä tzel, M.; Park, N. G. Nano Lett. 2013, 13,2412. doi: org/10.1021/nl400286w
(11) Liu, B.; Aydil, E. S. J. Am. Chem. Soc. 2009, 131, 3985.doi: 10.1021/ja8078972
(12) Zhang, J.; Shi, C.; Chen, J.; Wang, Y.; Li, M. J. Solid State Chem. 2016, 238, 223. doi: 10.1016/j.jssc.2016.03.033
(13) Wu, N.; Shi, C.; Ying, C.; Zhang, J.; Wang, M. Appl. Surf. Sci.2015, 357, 2372. doi: 10.1039/c5nr03511b
(14) Wang, Y. Q.; Li, L. Nie, L. H.; Li, N. N.; Shi, C. W. Acta Phys. -Chim. Sin. 2016, 32, 2724. [王艳青, 李 龙, 聂林辉,李楠楠, 史成武. 物理化学学报, 2016, 32, 2724.]doi: 10.3866/PKU.WHXB201607272
(15) Jung, J. Y.; Zhou, K.; Um, H. D.; Guo, Z.; Jee, S. W.; Park, K.T.; Lee, J. H. Opt. Lett. 2011, 36, 2677. doi:10.1364/OL.36.002677
(16) Yu, L.; Jia, J.; Yi, G.; Han, M. RSC Adv. 2016, 6, 33279.doi: 10.1039/c6ra02543a
4.81%-Efficiency Solid-State Quantum-Dot Sensitized Solar Cells Based on Compact PbS Quantum-Dot Thin Films and TiO2Nanorod Arrays
CHEN Jun-Jun SHI Cheng-Wu* ZHANG Zheng-Guo XIAO Guan-Nan SHAO Zhang-Peng LI Nan-Nan
(School of Chemistry and Chemical Engineering, Hefei University of Technology, Hefei 230009, P. R. China)
A compact PbS quantum-dot thin film was prepared using the combination of TiO2nanorod arrays and 1,2-ethanedithiol following the spin-coating assisted successive ionic layer absorption and reaction procedure. Solar cells with the novel structure of FTO/compact PbS quantum-dot thin film sensitized TiO2nanorod arrays/spiro-OMeTAD/Au were assembled. Subsequently, the influence of the length of TiO2nanorod arrays on the photovoltaic performance of all-solid-state compact PbS quantum-dot thin film sensitized solar cells was evaluated. The corresponding solar cells having TiO2nanorod array lengths of 290, 540, and 1040 nm achieved photoelectric conversion efficiencies (PCE) of 2.02%, 4.81%, and 1.95%, respectively. These results reveal that in order to achieve high PCE values with the all-solid-state quantum dot sensitized solar cells, it is very important to balance the hole diffusion length with the loading amount of quantum-dots.
Compact PbS quantum-dot thin film; TiO2nanorod array; 1,2-Ethanedithiol;Successive ionic layer adsorption and reaction; Solid-state quantum-dot sensitized solar cell
February 20, 2017; Revised: April 24, 2017; Published online: May 12, 2017.
O649
10.3866/PKU.WHXB201705121 www.whxb.pku.edu.cn
*Corresponding author. Email: shicw506@foxmail.com; shicw506@hfut.edu.cn.
The project was supported by the National Natural Science Foundation of China (51272061, 51472071).
国家自然科学基金(51272061, 51472071)资助项目
© Editorial office of Acta Physico-Chimica Sinica
猜你喜欢
世界科学技术-中医药现代化(2022年2期)2022-05-25
世界科学技术-中医药现代化(2021年8期)2021-12-21
世界科学技术-中医药现代化(2021年7期)2021-11-04
合肥工业大学学报(社会科学版)(2020年2期)2020-05-14
合肥工业大学学报(自然科学版)(2020年1期)2020-02-24
陶瓷学报(2019年5期)2019-01-12
校园英语·中旬(2017年11期)2017-10-25
西部广播电视(2015年9期)2016-01-18
西部广播电视(2015年6期)2016-01-16
西部广播电视(2015年5期)2016-01-16