基于SVM和区域生长结合算法的南方主要蔬菜害虫分类识别
2018-05-13 17:46PanChunhuaXiaoDeqinLinTanyuWangChuntao
农业工程学报 2018年8期
Pan Chunhua, Xiao Deqin, Lin Tanyu, Wang Chuntao
(College of Mathematics and Informatics, South China Agricultural University, Guangzhou 510642)
0 Introduction
Vegetables in South China generally suffer from plenty of vegetable pests, especially striped flea beetle, whiteflies,diamondback moth, and thrips. To control pests and improve the vegetable yield, farmers would be likely to use a large amount of pesticides. As a result, vegetables would be generally sprayed with pesticides for more than 10 times in growth period, which in turn increases the production cost as well as severely polluting the production environment. To effectively control vegetable pests, reduce pesticide consumption, and protect the production environment, it is preferable to discover pests as early as possible and control them timely when pests occur within a limited scope.
In the literature of pest identification, there exist three kinds of technologies, namely, machine vision image processing, photoconduction and manual field recognition[1-2]. The former two methods are restricted by operating environment. The latter generally consumes much time and manpower, its accuracy is much affected by subjective factors from the operator, and it is also difficult to meet the requirement of modern plant protection. Till now, merely several works adopt the technologies of information and automatic recognition in agricultural pest identification,while few approaches focuses on the classification and recognition of multiple vegetable pest species. Among them,most pest recognition methods are only for a single pest specie, and most image segmentation methods are based on traditional segmentation approaches. As a result, the use of those methods is limited to specific conditions or to complete hardware systems specially designed to work together with the developed algorithm.
Fedor et al[3-4]recognized thrips using the neural network and morphological characteristics. Tokihiro Fukatsu[5]proposed an image analysis method to effectively count, via a remote manner, insects like rice blast fungus and rice bug in pheromone trap. Mundada and Gohokar[6]smoothened images leveraging the averaging filter and applied the Support Vector Machine (SVM) to recognize whiteflies or aphids. Faithpraise et al[7]proposed the pest system for pest identification and classification via the perspective distortion compensation algorithm. Jayme[8]quantified the whiteflies on soybean leaves by exploiting digital images. Xia et al[9]designed mobile devices or embedded devices to automatically recognize common greenhouse pests such as whiteflies, aphids, and thrips. Yang Xinting et al[10-13]have proposed an image recognition algorithm for whiteflies and thrips in the greenhouse with yellow background, which exploits the segmentation via Prewitt and Canny edge detector and SVM, the recognition rate for whiteflies and thrips are separately 96.0% and 91.0%. These methods identify pests mainly under the laboratory environment, or the number of pests detected by other methods is only one or two. Actually, few works focuses on the simultaneous classification and recognition of multiple pests such as striped flea beetles, whiteflies,diamondback moths and thrips under the actual farm environment. Thus, conventional approaches may not be effective for multi-target recognition.
To automatically identify a number of key vegetable pests including the striped flea beetle, whiteflies,diamondback moth, and thrips, in this paper we develop a classification and recognition algorithm for these 4 key pests in southern area, which integrates the machine learning method of SVM with the region-growing algorithm and takes the morphological and color characteristics as features.The SVM is such a method that involves classifier learning from small samples and classifies the linear and non-linear data via the learned support vector. It can achieve good statistical rule even when the number of statistical samples is small[14-15]. The region-growing approach is an image segmentation method, which aggregates similar pixels to form a region and consequently segments connected regions with the same characteristics to provide good boundary information and segmentation results[16-17].
This paper presented a classification and recognition algorithm for major vegetable pests in South China using the SVM and the region growing method. The research was done in real field environment in Nansha production base of Guangzhou Dongsheng farm co., ltd. and Kemulang base of Guangdong agricultural technology promotion general station. The experimental background is relatively closer to the actual situation and the situations are more complex.
1 Identification algorithm for major vegeta-ble pests in south china
Fig. 1 plots the flowchart of the proposed scheme for the identification of major vegetable pests in South China.First, select target pests and representative background regions from the sample image, and then compute their respective RGB averages to generate the color features for target pests and backgrounds. Next, apply the morphological method on the sample image to obtain the to-be-classified image and morphological parameters. These parameters and the color features are input to the trained SVM classifier to check whether the concerned target could be classified. If it could not, the region growing algorithm is further used to recognize the target, determine the species, and accumulate the pest number. If the region growing algorithm fails, then this type of pest should be re-added to the training sample set for classification training[1,16]. Below gives more detail.
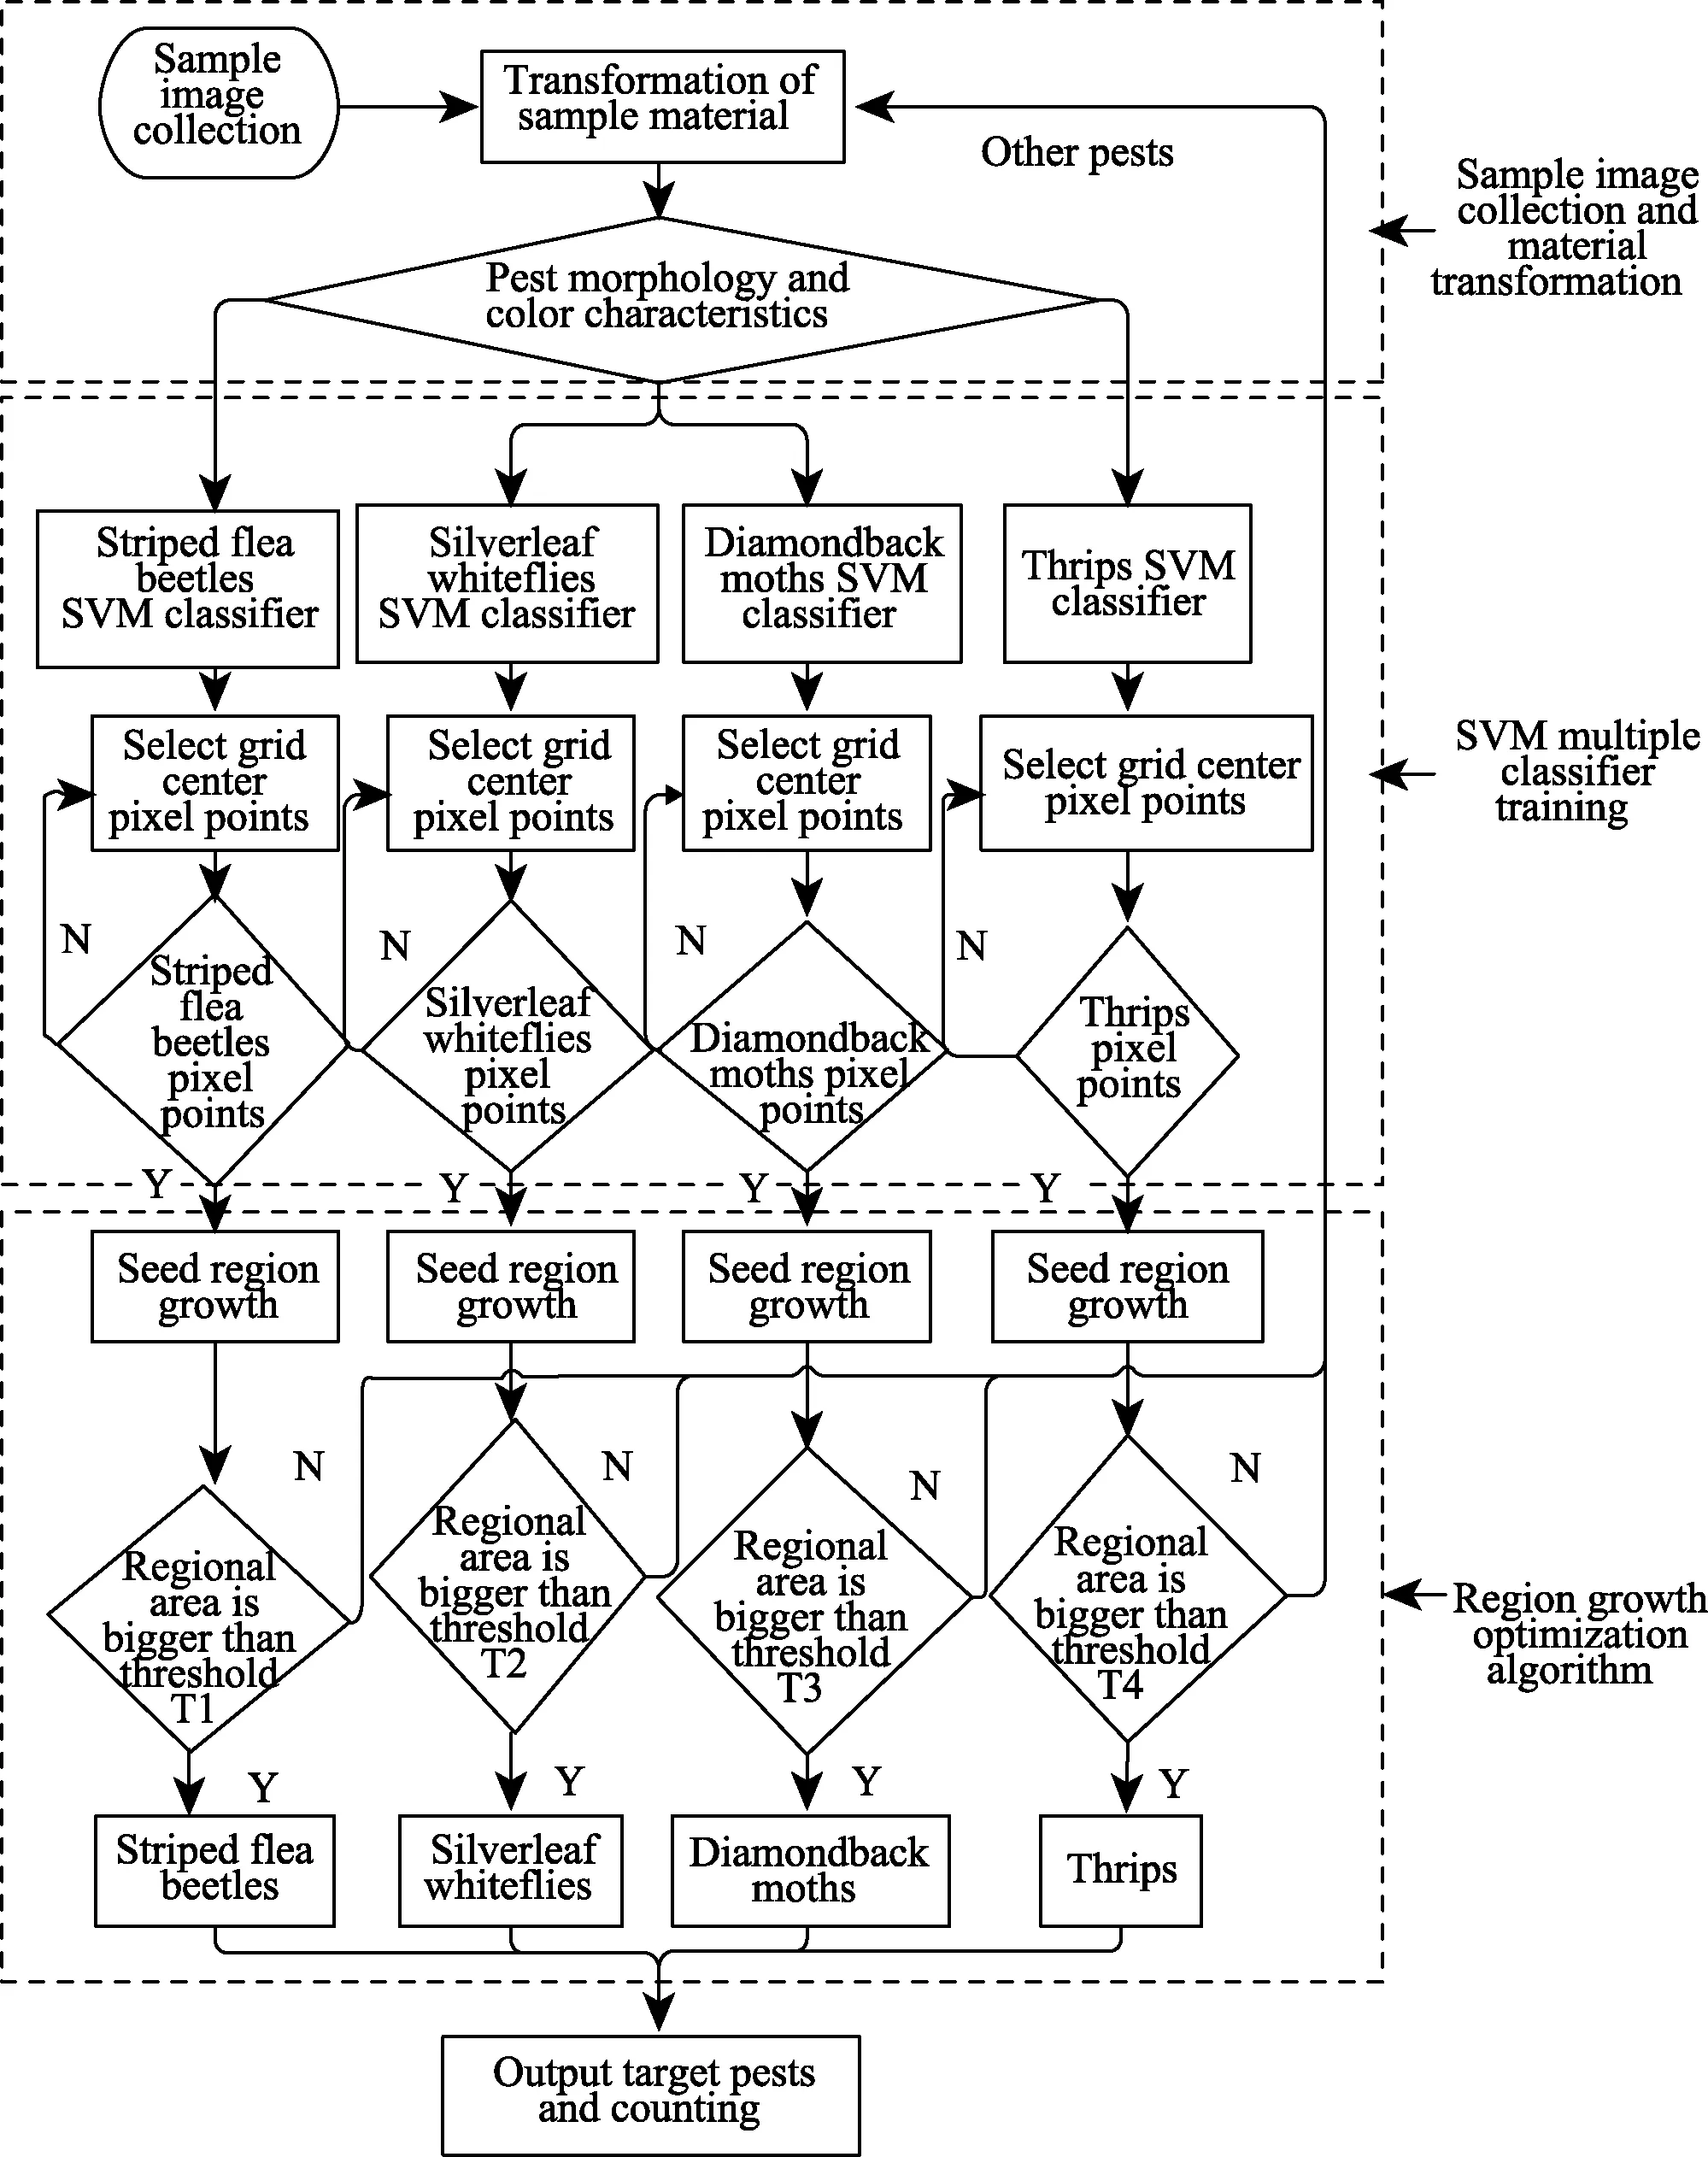
Fig.1 Classification detection algorithm architecture of 4 vegetable pests
1.1 S ample i mage c ollection and m aterial tr ansformation
Sample images studied in this paper were collected from the production base of Guangzhou Dongsheng Farm Co., Ltd. and the Guangdong Agricultural Technology Promotion General Station during the period from Sept.2015 to Oct.2016.These sample images contain 4 key vegetable pests in South China, says the striped flea beetle, whiteflies,diamondback moth, and thrips. They are captured using the industrial control microcomputer Fit-PC, CCD camera, and Canon 500D SLR camera. The microcomputer Fit-PC and CCD camera are fixed at the farm, which point at the surface of a single leaf of vegetables and is about 30cm apart from the leaf surface. The Cannon 500D SLR camera is manually operated under the macro mode, which focuses on the surface of a single leaf that is about 20cm away from the camera len. To clearly observe vegetable pests, we attempt to choose the adult vegetable pests with large and stable size for image collection. In this way, we totally collected 100 sample images for each pest species.
For each sample image, the method of edge segmentation is used to select regions containing target pests and representative backgrounds. These regions are then employed to compute the red green blue(RGB) average,which takes the block of 9×9 pixels for average and finally results in the color feature vector(R, G, B). Subsequently,tags 1 and -1 are assigned to the color feature vectors for the target pest and background, respectively, which thus yields the new feature vectors, i.e., (1, R, G, B) and (-1, R, G, B),respectively. These newly-formed feature vectors are taken as the features for the training and parameter optimization of the SVM[1,17].
1.2 Design of SVM classifier
The SVM is a machine learning method based on the statistical learning theory. It adopts the structural risk minimization as the optimization criterion. It exploits the thinking of kernel function, which takes advantage of the non-linear mapping to map the original data to the higher dimension and thus facilitates solving problems that cannot be handled in the linear space. In addition, the SVM does not need too many samples for classifier training, and it is thus helpful for addressing the scenario with small sample[18].
1) Linear classifier
The linear classifier mainly processes the linearly separable training samples. This kind of classifier can be represented by a quadratic function. The linear constraint conditions are used for target optimization and loss minimization. In essence, the linear classifier is a quadratic programming optimization problem, which is represented as follows
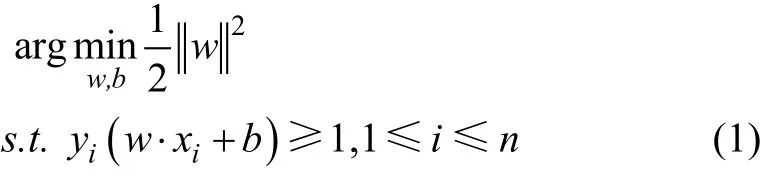
Where “y” represent categories, “x” denote data points, w and b represent a weight vector and intercept, “s.t.” represent“subject to”, respectively, and “i” represent dimension.
This problem can be solved by transforming it into a dual variable optimization problem through the Lagrangian method. By introducing the non-negative Lagrange multiplier, Eq. (1) turns to be
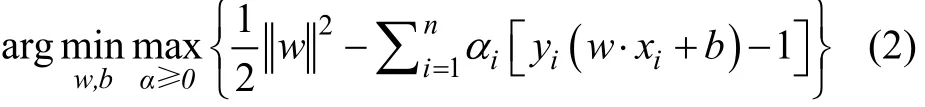
In Eq.(2), αirepresent Lagrange multiplier,all points satisfying yi(w · xi+b) −1>0,they are not related to target values as the function interval of the non-SVM is larger than 1 and αi≥ 0. To maximize Eq. (2), the αiwould be set as 0.When yi(w · xi+b) −1=0, the point corresponding to this situation contributes to classifier parameters, and thus the corresponding αiis set as 0. As Eq. (2) satisfies the Karush-Kuhn-Tucker (KKT) condition, it can be solved by setting the partial derivatives with respect to w and b as zeros, i.e.

By substituting the result from Eq. (3) into Eq. (2), we have
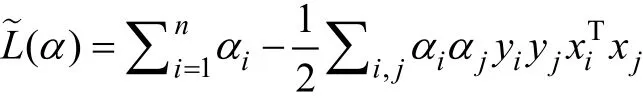

Solving Eq.(4) then gives rise to the linear classifier function, i.e., b*represent intercept.

2) Training of non-linear classifier
Some sample images in our work cannot be separated linearly. To tackle this issue,, the kernel function is required.Specifically, features are obtained in a low-dimensional space, and they are then mapped via the kernel function into a high-dimensional space. The optimal separation hyperplane in the high-dimensional space is finally constructed to separate the mapped non-linear feature.Figure 2 illustrates this process. As shown in Fig. 2, object A and object B cannot be separated in 2-D space, but they become linearly separable when the sample data are mapped to the 3-D space[19].
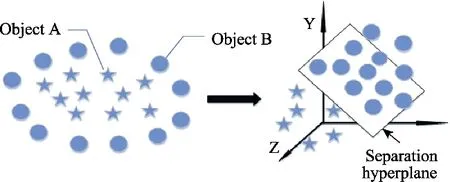
Fig. 2 Two-dimensional space to threedimensional mapping
As classification tags for training samples are marked manually, the accidentally incorrect tags would introduce noises for classification and thus lead to classification errors.To address this issue, we introduce a penalty cost C, and a slack variable ξi, in Eq. (1). Specifically, introducing the slack variable into the constraint condition gives rise to a new constraint, i.e.,

Where ξirepresent slack variable, ξidenotes the maximum function interval that point xideviates from the correct one.As an infinite ξiwould imply that any hyper-plane could meet the constraint, the sum of ξishould also be minimized.Therefore, the optimization objective becomes Eq. (7).
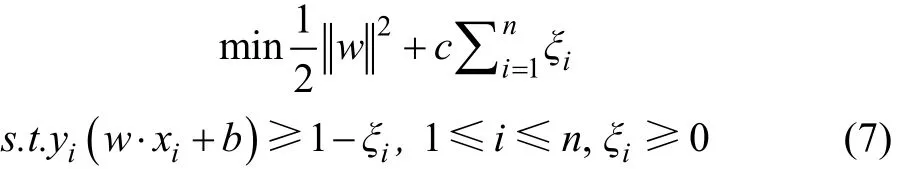
Where c is a penalty cost and its value is predefined by users.By solving Eq. (7), we can obtain the non-linear classifier function, i.e.

Where φ is a kernel function. Generally, the Gaussian function is selected as the kernel function, which is called the radial basis function (RBF).
3) Parameter setting of the SVM
The value of c would affect the classification accuracy.A large c would lead to over fitting, while a small c would result in many incorrectly classified points. There is no general rules for the setting of c, and a preferable c needs to be determined via experimental simulations.
The Gaussian kernel function is widely used in the SVM, which is defined as

Where “x” represent sample and “σ” represent width. If σ is large, the weight for the high-order feature would attenuate quickly, which is essentially equivalent to a low-dimension sub-space. On the other side, if σ is small, it would lead to over-fitting and consequently any data could be linearly separable[20]. As the Gaussian kernel function has no special requirement for the sample quantity, it is adopted in our work as the kernel function[21-22].
As desirable parameter setting might significantly improve the classification accuracy, in this paper we attempt to incorporate the grid method based on the region growing to seek the optimal parameter pair (c, σ).
4) Solution to multiple classifications problem
Two methods can be used to solve the problem of multiple classification. The first method is to adopt the strategy of one to others. That is, for N-type samples, N classifiers should be trained to determine which type the concerned sample belongs to. This method requires small storage space and test time, but it needs long time for classifier training because all training samples would be used in training.
The other method deploys the strategy of one to one.Specifically, if samples involve N types, N(N-1)/2 classifiers should be trained. This method requires large storage space and long test time, but the training time is short[23-24].
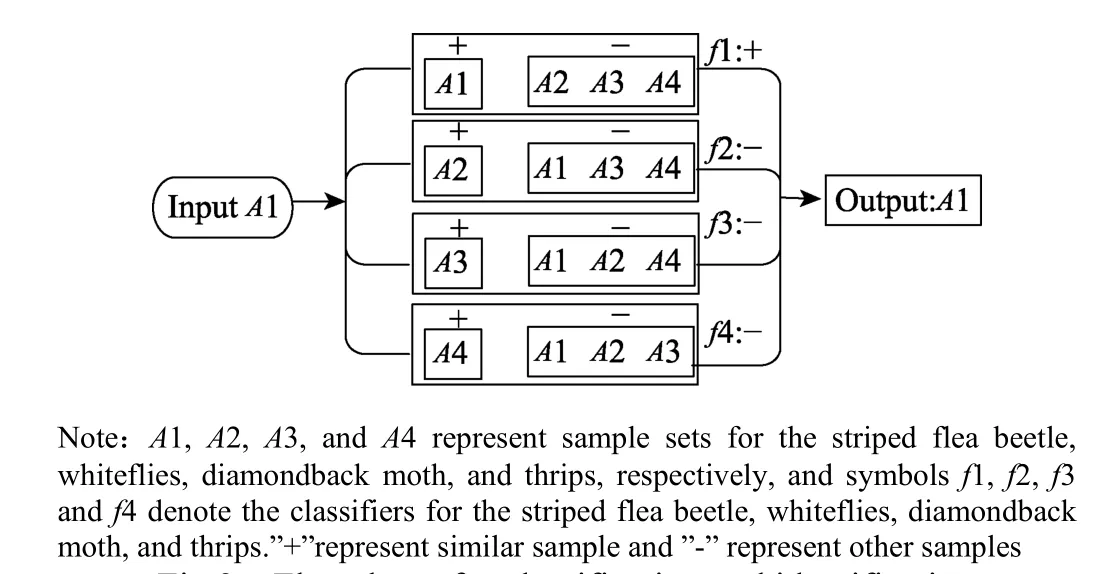
Although performance of the two methods may be related to the data distribution, they are roughly the same in practice. As the first method has less test time, which is preferable in practical applications, the first method is adopted in this paper. As test samples in our work involve four species, four classifiers are trained for recognition. Fig. 3 presents the flowchart for pest classification, where symbols A1, A2, A3, and A4 represent sample sets for the striped flea beetle, whiteflies, diamondback moth, and thrips,respectively, and symbols f1, f2, f3 and f4 denote the classifiers for the striped flea beetle, whiteflies,diamondback moth, and thrips, respectively. If fi (i=1,2,3,4)is positive, then it indicates that the test sample belongs to this class. Otherwise, the test sample cannot be classified as this class. In this way, the pest species can be determined according to the output of the classifier[25-26].
Through the SVM classifier, the obtained region is generally the target region. If an object other than the target object is discovered in the obtained region, it indicates that the early training samples are not selected reasonably, the selected background does not cover all background characteristics, or some background regions are confused with the target. In this situation, these background regions should be re-inserted in the training set for re-training.
Therefore, the training process of classifiers is an iterative process. Initial samples, which are selected subjectively,may not generate classifiers suitable for applications.Therefore, the training set should be adjusted according to the response of the classifier to practical test samples. Such process is iteratively executed until the desirable performance is achieved. This way can better improve classifier performance, increase prediction accuracy rate,and finally improve the classification accuracy[1,27-28].
F i g.3 F l o w c h a r t s f o r c l a s s i f i c a t i o n a n d i d e n t i f i c a t i o n u s i n g m u l t i p l e c l a s s c l a s s i f i e r s
1.3 Recognition of region growing algorithm based on SVM classification results
As the information contained in an image is highly correlated and redundant, conventional image processing approaches generally employ the traversal method to process the whole image. As the traversal method features lower processing efficiency, we turn to the region growing algorithm. Specifically, once the position of the target is determined, we perform the traversal region growing operation to avoid the low efficiency due to processing of the whole image. The region growing algorithm first segments the image into multiple small regions according to the characteristics of gray level, texture, and color. In more detail, small regions with similar average gray level, texture and color would be continuously merged to form regions with different characteristics. If the absolute difference between the seed pixel and its adjacent pixel is less than a given threshold, they are merged. Fig. 4 illustrates the region growing algorithm, where the threshold is set as 3 in an empirical manner[29-30].
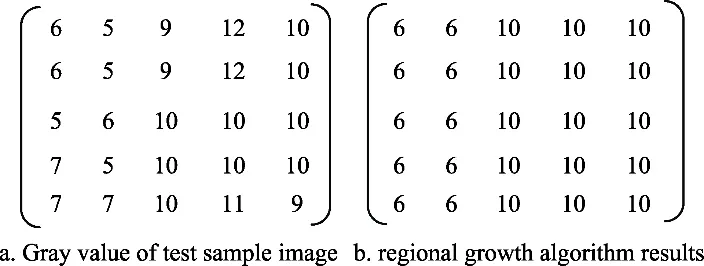
Fig.4 Region growing example
The grid in our work is empirically set as 64×64 pixels.Each pixel point at the grid center is input to the classifier to check whether this point could be determined as a target point. If it is true, this pixel point is added to the seed set;otherwise, the pixel point is neglected. As the grid merely checks the center point, noise points and falsely checked objects with small size would be missed except that they are exactly at the grid center[31-32].
2 Algorithm implementation
2.1 Algorithm implementation environmen t and test materials
In algorithm implementation, we used the program language of C++, the OpenCV of version 2.49, and the LibSVM of version 3.20. We collected 100 images for each vegetable pest. Among them, 60 sample images are used to train the SVM classifier, while the others are deployed to assess the recognition performance.
2.2 Cl assifier training
Without loss of generality, we take the whiteflies for example. Fig. 5 shows an original image for pest whiteflies.As shown in Fig. 5, heads (Fig.5b) and bodies ( Fig. 5c ) are cut as target regions for training, where each region is of size 9×9 pixels. The characteristic background regions ( Fig. 5d)are extracted as the background regions for training. After target and background regions are obtained, their average RGB values are computed accordingly, as listed in Table 1.Next, category tags are assigned to each average RGB values. If RGB values are calculated from the target region,they are marked as 1; otherwise, the tag of -1 is set. In this way, we totally generate 4 618 and 3 594 items for training and prediction, respectively. The training set contains 3 694 items from background regions and 924 items from target regions. The test set includes 2 875 items from background regions and 719 items from target regions.

Fig.5 Training sample collection

Table 1 Training sample feature set
In the implementation, we adopt the cross validation.Thus, the training set is divided into 5 sub-sets. Among them,4 sub-sets are used as the training set and 1 sub-set is taken as the test set. These 5 sub-sets are randomly combined to yield the training set and the test set for each training round.In the simulation, we totally perform 5 training and test round. The SVM parameter pair (c,σ) is determined via experimental search, which results in log2(c)=13 and log2(σ)=3. Experimetal simulations show that the classification accuracy rates for whiteflies, striped flea beetle, thrips,and diamondback moth are 93.2%, 96.4%, 98.2% and 95.4%,respectively, as shown in Table 2.

Table 2 Training sample data set
1) Segmentation experiment for whiteflies
Suppose that the SVM classifier has been trained. It is then used for the traversal detection of a sample image.Results are shown in Fig. 6b. It is observed that there exist many false regions and noise points. To address this issue,these false regions and those with noise points are added to the training set for re-training. The new classifier is used again to segment the original image. Fig. 6c presents the results, which shows that, compared to Fig. 6b, the segmentation performance for target pests has been improved significantly although there still exist a small number of noise points.
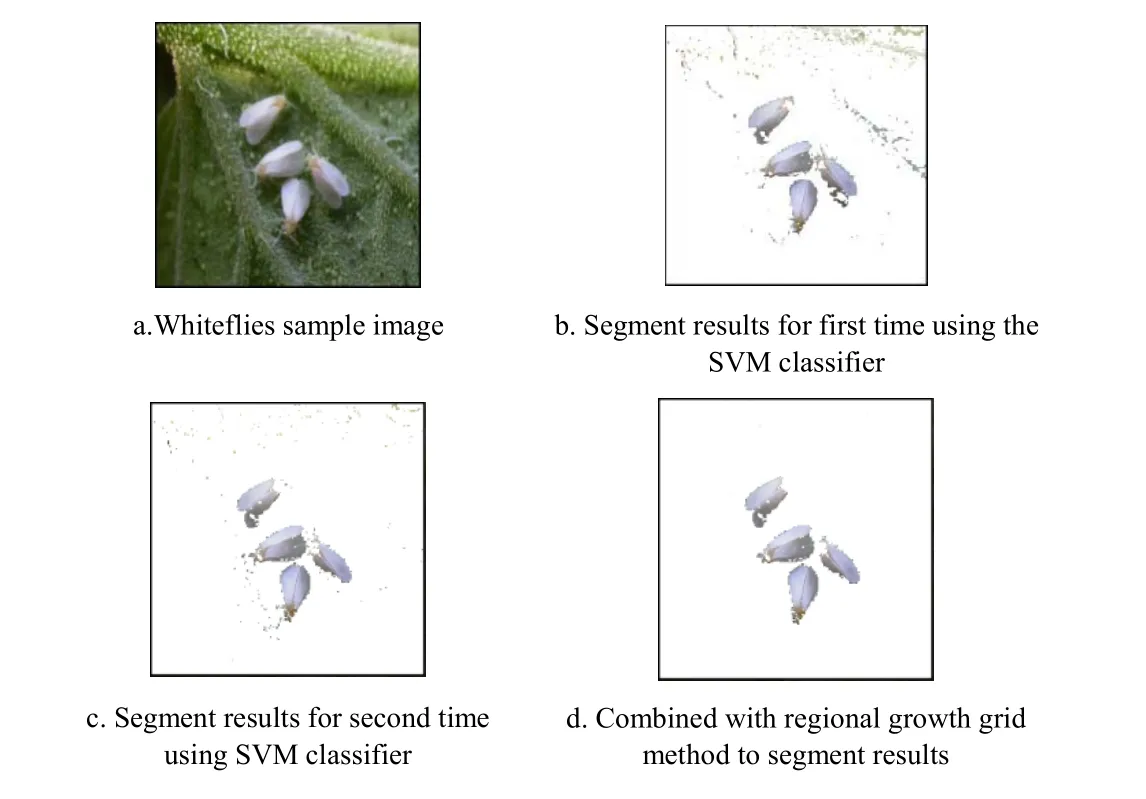
Fig.6 Division results of whiteflies
To further improve the segmentation, the region growing algorithm with adaptive grid size is used for segmentation. The image in Fig. 6c is first divided into 64×64 grids. Pixels at the grid center are then extracted to check whether it can be determined as a target point. If it is,the pixel is thus identified as a seed point; otherwise, the total grid is considered as the background. With the seed point as the initial position, the region growing algorithm is subsequently applied to obtain the insect target. The results are illustrated in Fig. 6d. Clearly, noises are almost eliminated completely and target pests are thus obtained desriably. Compared to Fig. 6a merely via the traversal detection, segmentation results in Fig. 6d are greatly improved.
40 sample images are used to test the classifier. Among them, 37 sample images can be successfully segmented, but 3 sample images fail in segmentation. Therefore, the success rate of target pest recognition is 93.2%. For an image of size 640×640 pixel.
2) Segmentation experiment for striped fleabeetle
The image segmentation experiment of striped flea beetles sample images is shown in Fig. 7. 60 sample images are used for classifier training. 40 sample images are used to test the classifier. The segmentation effect is obvious for 38 sample images. The target cannot be segmented for 2 sample images. The recognition rate of the target pests is 96.4%.
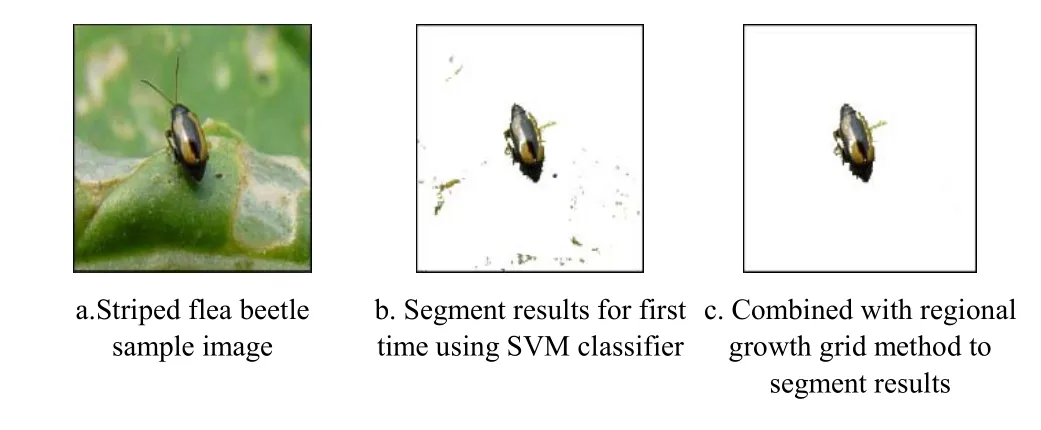
Fig.7 Division results of Striped flea beetle
3) Segmentation experiment of diamondback moths
The segmentation experiment results of diamondback moths are shown in Fig. 8. 60 sample images are used for classifier training. 40 sample images are used to detect the classifier. The segmentation effect is obvious for 37 sample images. The target cannot be segmented for 3 sample images.The recognition rate of the target pests is 95.4%.

Fig.8 Division results of diamondback moths
4) Segmentation experiment of thrips
Fig. 9 shows the segmentation of thrips.The background is similar, so the expected segmentation results can be achieved by using the classifier from the first training.
For the segmentation experimental results of thrips,refer to figure 9.60 sample images are used to train the classifier and 40 sample images are used to test the classifier.The segmentation effect is obvious for 38 sample images.The target cannot be segmented for 2 sample images. The recognition rate of the target pests is 98.2%.
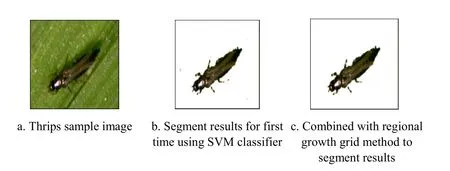
Fig.9 Division results of thrips
3 Conclusion
In this paper, the SVM machine learning method is used to recognize the major vegetable pests in the southern area. The region growing algorithm based on the adaptive grid search is employed to improve the search rate of target regions of sample images. Multiple classifiers are trained to recognize vegetable pests, in which the feedback training method is adopted to enhance the classifier. Test results show that the trained classifier can well segment target pests in sample images. The algorithm is region growing algorithm that is more popular based on SVM. Recognition rate for striped flea beetles, whiteflies, diamondback moths,and thrips by the proposed algorithm are 96.4%, 93.2%,95.4%, and 98.2% respectively.
Although the proposed scheme has achieved desirable classification and recognition results for major vegetable pests in South China, it could be further improved. For example, the proposed scheme only takes color characteristics and the region area as the feature, target and background regions for SVM training are selected manually,and there is only one species in each sample image.Therefore, more factors like the region information, texture,and contour could be considered in future work. Also,classification and recognition for multiple pests in complicated sample images deserves further research.
[References]
[1] Lin Tanyu, Xiao Deqin, Zeng Jiye, et al. Fast detection algorithm for golden crane fly based on region growing and SVM[J]. Guangdong Agricultural Sciences, 2016, 43(7):172-177.
[2] Mao Wenhua, Zheng Yongjun, Zhang Yinqiao, et al.Grasshopper detection method based on machine vision[J].Transactions of the Chinese Society of Agricultural Engineering (Transactions of the CSAE), 2008, 24(11): 155-158. (in Chinese with English abstract)
[3] Fedor P, Malenovsky I, Vanhara J, et al. Thrips(Thysanoptera) identification using artificialneural networks[J]. Bull. Entomol. Res., 2008, 98(5): 437-447.
[4] Fedor P, Vanhara J, Havel J, et al. Artificial intelligence in pest insect monitoring[J]. Syst.Entomol., 2009, 34(2): 398-400.
[5] Tokihiro Fukatsu , Tomonari Watanabe, Haoming Hu, et al.Field monitoring support system for the occurrence of Leptocorisa chinensis Dallas (Hemiptera: Alydidae) using synthetic attractants, Field Servers, and image analysis[J].Computers and Electronics in Agriculture, 2012, 80(1): 8-16.
[6] Mundada R, Gohokar V. Detection and classification of pests in greenhouse using image processing[J]. IOSR J. Electr.Commun. Eng, 2013, 5(1): 57-63.
[7] Faithpraise F, Birch P, Young R, et al. Automatic plant pest detection and recognition using k-means clustering algorithm and correspondence filters[J]. Int. J. Adv. Biotechnol. Res.2013, 4(2):189-199.
[8] JGA Barbedo. Using digital image processing for counting whiteflies on soybean leaves[J]. Journal of Asia-Pacific Entomology, 2014, 17(4): 685-694.
[9] Xia C, Chon T S, Ren Z, et al. Automatic identification and counting of small size pests in greenhouse conditions with low computational cost[J]. Ecological Informatics, 2015,29(1) :139-146.
[10] Yang Xinting, Liu Mengmeng, Xu Jianping, et al. Image segmentation and recognition algorithm of greenhouse whiteflies and thrips adults for automatic monitoring device[J]. Transactions of the Chinese Society of Agricultural Engineering (Transactions of the CSAE), 2018, 34(1): 164-170. (in Chinese with English abstract)
[11] Tian Ran, Chen Meixiang, Dong Daming, et al. Identification and counting method of orchard pests based on fusion method of infrared sensor and machine vision[J].Transactions of the Chinese Society of Agricultural Engineering (Transactions of the CSAE), 2016, 32(20): 195-201. (in Chinese with English abstract)
[12] Tao Liu, Wen Chen, Wei Wu, et al. Detection of aphids in wheat fields using a computer vision technique[J].Biosystems Engineering, 2016, 141(1): 82-93.
[13] Xiao Deqin, Fu Junqian, Deng Xiaohui, et al. Design and test of remote monitoring equipment for bactrocera dorsalis trapping based on internet of things[J]. Transactions of the Chinese Society of Agricultural Engineering (Transactions of the CSAE), 2015, 31(7): 166-172. (in Chinese with English abstract)
[14] Chen Meixiang, Yang Xinting, Shi Baocai, et al. On-line identification and counting sex-pheromones lured orchard pest based on machine vision[J].Journal of Environmental Entomology, 2015, 37(1): 176-183. (in Chinese with English abstract)
[15] Wen Tao, Hong Tiansheng, Li Zhen et al. Statistics and tracking of Bactrocera Dorsalis based on machine vision[J].Transactions of the Chinese Society of Agricultural Engineering (Transactions of the CSAE), 2011, 27(10): 137-141. (in Chinese with English abstract)
[16] Watson A T, O'Neill M A, Kitching I J. Automated identification of live moths (macrolepidoptera) using Digital Automated Identification System (DAISY)[J]. Syst. Bio,2004, 1(3): 287-300.
[17] Xie Chengjun, Zhang Jie, Li Rui, et al. Automatic classification for field crop insects via multiple-task sparse representation and multiple-kernel learning[J]. Computers and Electronics in Agriculture, 2015, 119(1): 123-132.
[18] Han Antai, Guo Xiaohua, Liao Zhong, et al. Classification ofagricultural pests based on compressed sensing theory[J].Transactions of the Chinese Society of Agricultural Engineering (Transactions of the CSAE), 2011, 37(6): 203-207. (in Chinese with English abstract)
[19] Han Ruizhen, He Yong. Remote automatic identification system of field pests based on computer vision[J].Transactions of the Chinese Society of Agricultural Engineering (Transactions of the CSAE), 2013, 29(23): 156-162. (in Chinese with English abstract)
[20] Ma Y, Huang M, Yang B, et al. Automatic threshold method and optimal wavelength selection for insect-damaged vegetable soybean detection using hyperspectral images[J].Computers and Electronics in Agriculture, 2014, 106(2): 102-110.
[21] Do M T, Harp J M, Norris K C. A test of a pattern recognition system for identification of spiders[J]. Bull.Entomol. Res., 1999, 89(3): 217-224.
[22] Xie Chengjun, Li Rui, Dong Wei, et al. Recognition for insects via spatial pyramid model using sparse coding[J].Transactions of the Chinese Society of Agricultural Engineering (Transactions of the CSAE), 2016, 32(17): 144-151. (in Chinese with English abstract)
[23] Espinoza K, Valera D L, Torres J A, et al. Combination of image processing and artificial neural networks as a novel approach for the identification of Bemisia tabaci and Frankliniella occidentalis on sticky traps in greenhouse agriculture[J]. Computers & Electronics in Agriculture, 2016,127(3): 495-505.
[24] Otoniel López, Miguel Martinez Rach, Hector Migallon, et al.Monitoring pest insect traps by means of low-power image sensor technologies [J]. Sensors 2012, 12(11): 15801-15819.
[25] Li Wenyong, Li Ming, Chen Meixiang, et al. Feature extraction and classification method of multi-pose pests using machine vision[J]. Transactions of the Chinese Society of Agricultural Engineering (Transactions of the CSAE), 2014,30(14): 154-162. (in Chinese with English abstract)
[26] Wen C, Guyer D. Image-based orchard insect automated identification and classification method[J]. Computers &Electronics in Agriculture, 2012, 89(3): 110-115.
[27] Xia C, Lee J M, Li Y, et al. In situ detection of small-size insect pests sampled on traps using multifractal analysis [J].Optical Engineering, 2012, 52(2): 27001-27012.
[28] Ebrahimi M A, Khoshtaghaza M H, Minaei S, et al.Vision-based pest detection based on SVM classification method[J]. Computers and Electronics in Agriculture, 2017,137(3): 52-58.
[29] Wang Zhibin, Wang Kaiyi, Zhang Shuifa, et al. Whiteflies counting with K-means clustering and ellipse fitting[J].Transactions of the Chinese Society of Agricultural Engineering (Transactions of the CSAE), 2014, 30 (1): 105-112. (in Chinese with English abstract)
[30] Yang Xinting, Sun Wenjuan, Li Ming, et al. Water droplets fluorescence image segmentation of cucumber leaves based on K-means clustering with opening and closing alternately filtering[J]. Transactions of the Chinese Society of Agricultural Engineering (Transactions of the CSAE), 2016,32 (17): 136-143. (in Chinese with English abstract)
[31] Hu Yahui, Gao Lingwang. An automatic counting system for surveying density of Bemisia tabaci adults[J]. Chinese Journal of Applied Entomology, 2011, 48 (1): 84-87. (in Chinese with English abstract)
[32] Yan Z Z. Improved FCM algorithm based on K-Means and granular computing: Journal of Intelligent Systems[J].Journal of Intelligent Systems, 2015, 24(2): 215-222.
猜你喜欢
发明与创新(2021年39期)2021-11-05
好孩子画报(2021年9期)2021-09-26
小学生优秀作文(低年级)(2021年5期)2021-07-21
数学小灵通(1-2年级)(2021年4期)2021-06-09
今日农业(2020年23期)2020-12-15
小太阳画报(2020年3期)2020-04-24
中学生数理化·七年级数学人教版(2019年4期)2019-05-20
初中生世界·七年级(2017年9期)2017-10-13
少儿科学周刊·儿童版(2017年3期)2017-06-29
营销界(2015年23期)2015-02-28