
Differences in major ions as well as hydrogen and oxygen isotopes of sediment pore water and lake water
2018-08-17 09:51ZhuoZhangHuamingGuoZhenWang
Water Science and Engineering 2018年2期
Zhuo Zhang,Hua-ming Guo,*,Zhen Wang
aState Key Laboratory of Biogeology and Environmental Geology,China University of Geosciences,Beijing 100083,China
bMOE Key Laboratory of Groundwater Circulation&Environment Evolution,China University of Geosciences,Beijing 100083,China
cSchool of Water Resources and Environment,China University of Geosciences,Beijing 100083,China
Abstract Isotopic and chemical compositions of pore water(PW)are highly relevant to environmental and forensic study.Five lake water(LW)samples and five sediment samples were collected to investigate the effects of pore sizes of sediments on PW chemistry and stable isotopes and determine mechanisms controlling their variations.Six pore water fractions were extracted from different-sized pores in each sediment sample at six sequential centrifugal speeds for chemical and isotopic analysis.The sediments consisted mainly of quartz,feldspar,and clay minerals.The hydrogen and oxygen isotopic compositions of PW are mainly controlled by the overlying LW,although the lag effect of exchange between overlying LW and PW results in isotopic differences when recharge of LW is quicker than isotopic exchange in PW.Identical isotopic compositions of PW from sediments with different pore sizes indicate that isotopic exchange of water molecules with different pore sizes is a quick process.The ratio of average total dissolved solid(TDS)concentration of PW to TDS concentration of LW shows a strong relationship with adsorption capacity of sediments,demonstrating that remobilization of ions bound to sediments mainly causes a chemical shift from LW to PW.Concentrations of Ca2+,Mg2+,and Cl-in PW remain unchanged,while concentrations of Na+,K+,and slightly increase with decreasing pore size.Chemical differences of PW from sediments with different pore sizes are governed by ion adsorption properties and surface characteristics of different-sized particles.
Keywords:Pore size;Centrifugal extraction;Hydrogen and oxygen isotopes;Major ions;Remobilization
1.Introduction
The total volume of pore water(PW)occupying the pore spaces of sediments is around one- fifth of all the earth’s water resources(Horn,1964).PW is formed by in filtration and eventual trapping during sedimentation,where remobilization,mineral dissolution,degradation,diffusion,and the exchange of PW with the overlying water column jointly determine chemical and isotopic compositions of PW,which play an important role in sediment-water exchange processes in aquatic ecosystems(Zhu et al.,2014)and also have the potential to yield important information on sediment quality(Vardy et al.,2015;Cleveland et al.,2017).Thus,the extraction and investigation of PW are particularly significant.
Currently,the most important extraction techniques used for PW extraction from sediment samples include centrifugation(Bath and Edmunds,1981;Arnarson and Keil,2000;Figueroa-Johnson et al.,2007;Delongchamp et al.,2010;Hong et al.,2011),pressure squeezing(B¨ottcher et al.,1997;Cyr et al.,2008;Kwong et al.,2015),dialysis(Mayer,1976;Xu et al.,2012),and vacuum filtration(Concas et al.,2015;Sprenger et al.,2015).Of these techniques,centrifugation is most widely used for PW extraction due to its accuracy(Winger et al.,1998;Orlowski et al.,2016;Cleveland et al.,2017).Most studies have investigated chemical and isotopic characteristics of extracted PW.Watson et al.(1985)observed differences in PW chemistry upstream and downstream in the Tamar Estuary,and showed that these differences were controlled by re-oxidation of sul fide,denitrification,and waste dumping.Chemical variations of sediment PW from different depths were also investigated by Yang et al.(2003),illustrating that the local interaction of PW and fracture water plays a more important role in the evolution process of PW than diffusion or advection.Moreover,Kwong et al.(2015)studied stable isotopes of sediment PW from different depths in Cangzhou,on the North China Plain,and suggested that evaporation had been significant in the study area.In some other studies,seasonal variations in stable isotope and chemistry of sediment PW have been evaluated,showing seasonal differences to be governed by meteorological conditions such as temperature and precipitation (Karathanasis, 1991;Robertson and Gazis,2006;Wildemeersch et al.,2015).
Other studies have investigated chemical compositions in PW from sediments with different pore sizes,but their results have been inconsistent.Chemical differences were observed in salinity,sodium,potassium,and calcium in PW from chalk by Edmunds and Bath(1976),but no chemical differences were observed by Kinniburgh and Miles(1983).Although Sch¨on et al.(2016)showed isotopic differences in PW from sediments with three pore size gradients,the squeezing method used,which didnotmaintainconstant temperature,might result in isotope fractionation during extraction.Therefore,studies on isotopic and chemical characteristics of PW from sediments with different pore sizes are necessary to expand our understanding of the evolution of PW along pore size gradients in sediments.To fill these knowledge gaps,this study intended to determine the impact of pore structure of sediments on stable isotopic and chemical compositions of PW.
The objectives of this study were to(1)identify the differences in chemical and isotopic compositions of LW and corresponding sediment PW,(2)characterize the effects of pore sizes(pore diameters)of sediments on chemical and isotopic compositions of PW,and(3)determine mechanisms controlling chemical and isotopic variations in LW from largesize pores to small-size pores during water-rock interaction.
2.Materials and methods
2.1.Materials

Fig.1.Location of sampling sites of lake water,sediment,and rainwater in Beijing.
Five lake water samples and five sediment samples were collected from the Olympic Green(site O),the Summer Palace(site S),the Imperial Garden(site Y),Chaoyang Park(site C),and Yanqi Lake(site Q)in Beijing in November 2015(Fig.1).The four lakes at sites O,S,Y,and C had areas of 0.17,1.9,0.29,and 0.68 km2,respectively,and the maximum average water depth of 1.5 m was observed at site S(Zhang and Li,2003).The lake area at site Q reached 2.3 km2,with a maximum water depth of 25 m.In addition,the annual average temperature of lake water at site Q was about 10°C,while at the other four sites it was around 13°C.At sites O and Y,the lakes are recharged by the Qinghe River,and the lake at site C is recharged by the Liangma River.The lake at site S is mainly recharged by local precipitation and adjacent springs in the monsoon season and by Miyun diversion water in the dry season,and the lake at site Q is mainly recharged by mountain rivers and local precipitation(Zhang and Li,2003;Liu et al.,2013;Lan et al.,2016).All the water samples were filtered through 0.45-μm membrane filters in the field for analysis in the laboratory.Water samples for major cation analyses were acidified to pH<2 by the addition of 6 mol/L of ultra-pure HNO3.A subsample was left unacidified for anion determination.An aliquot of a sample was taken in an amber glass without headspace for oxygen and hydrogen isotope analysis.
Sediment samples were sealed in valve bags,and transported to the laboratory at 4°C.They were stored at-20°C in the laboratory for PW extraction within one week.In addition,three rainwater samples were collected for oxygen and hydrogen isotope analysis.
2.2.Methods
Predictions of the equilibrium partition model showed that the centrifuge method for PW extraction is the most accurate and precise for chemicals(Buf flap and Allen,1995;Orlowski et al.,2016;Cleveland et al.,2017).Therefore,a high-speed refrigerated centrifuge(GL21M,Kaida)was used to extract PW in this study.The physics of water removal from porous materials by centrifugation are well understood,although the precise force distribution developed during the process is difficult to determine.Considering a column of watersaturated sediment under centrifugation,the applied tension Taat a point within the column is given by Eq.(1)(Richards and Weaver,1944):

where Taisthetension(cmH2O),ωistheradialvelocity(rad/s),g is the acceleration due to gravity(cm/s2),r1is the distance fromthe baseofthecolumntothecenterofrotation(cm),andr2is the distance from any point in the column to the center of rotation(cm).
Therefore,the applied tension is a function of the distance from the rotor and the centrifugal speed,which is independent of the nature of the materials.The capillary pressure in a pore is given by Eq.(2)(Washburn,1921):

where Tcis the tension due to capillary action(N/m2),σ is the surface tension(N/m),θ is the contact angle between the porous solid and the liquid(°),ρ is the water density(kg/m3),and d is the pore diameter(m).
When the tension (Ta)during centrifugation is equal to the capillary pressure in a pore (Tc),pore water will be extracted from the sediment with a pore diameter of d.At the critical point for pore water extraction,the relationship between Taand Tccan be constructed as

Thus,the pore diameter can be worked out using Eqs.(1)through(3)

where n is the centrifugal speed.σ and θ are given by Edmunds and Bath(1976),g and ρ are fixed,and r1and r2are calculated based on the parameters of the centrifuge and the special centrifuge tube(Table 1).Eq.(4)indicates that the pore diameter(d)is a function of the centrifugal speed(n).
According to Eq.(4),the relationship between the centrifugal speed and the diameter of sediment pores is illustrated in Fig.2 with θ=0°,σ =0.07 N/m,and ρ =1.0 × 10³kg/m3.In other words,the PW in a pore can be extracted when the centrifugal speed exceeds the corresponding value in the solid curve of Fig.2.
Special Te flon centrifuge tubes(Fig.3)were made to extract PW by centrifuge at several different centrifugal speeds(including 1500,3000,6000,10000,15000,and 20000 rpm).Specifically,around 25 g of sediment was put in the tube and centrifuged at 1500 rpm for one hour at 5°C,which led to the extraction of PW from the sediment pores with sizes larger than6.87 μm(Table 2).After that,the used sediment was centrifuged at 3000 rpm for one hour at 5°C,which led to the extraction of PW from the sediment pores with sizes between 1.72 and 6.87 μm.The same procedure was repeated for other centrifugal speeds.PWin pores with sizes of 0.039 μm was extracted at the centrifugal speed of 20000 rpm(Fig.2).With this method,six PW samples were obtained from each sediment sample.In total,30 PW samples were collected in this study.

Table 1 Parameters related to extraction of sediment PW.

Fig.2.Relationships between centrifugal speed and centrifugal force andporediameterwithθ=0°,σ=0.07N/m,andρ=1.0×103kg/m3.
2.3.Sediment analysis

Fig.3.Special Te flon centrifuge tube.

Table 2 Centrifugal speeds applied in this study and corresponding ranges of pore sizes.
The moisture content of sediments was determined through the oven-drying method.The moisture contents offive sediment samples were measured in triplicate and the average values were obtained.The grain size distribution of sediment samples was measured using a laser-diffraction particle-size analyzer(Mastersizer 2000,Malvern)after freeze-drying.Hydraulic conductivities of the sediment samples were estimated with the Beyer formula based on the grain size distribution(Beyer,1966):

where Kfisthehydraulicconductivity(m/s);Cisthecoefficient(60×10-4<C<120×10-4),dependent on U,which is the degreeofuniformity,andU=,withd10representingthe particle size corresponding to the value of 10%in the cumulative particle size distribution curve(mm),and d60representing the particle size corresponding to the value of 60%in the cumulative particle size distribution curve(mm).
After being freeze-dried,disaggregated,and milled,major mineral phases for samples were analyzed through X-ray diffraction(D/max-rA,Rigaku).A spectrocolorimeter(CM-700d,Konica Minolta)was used to measure the difference in diffuse spectral re flectance between 530 nm and 520 nm,which is indicative of the color of freshly collected sediments(R530-520)(Horneman et al.,2004).
In addition,the total organic carbon(TOC)analyzer multi N/C 2100s was used to determine the solid organic carbon(SOC)content in sediment.Prior to analysis,sediments were treated with 0.5 mol/L of HCl to remove inorganic carbon.Cation exchange capacity (Cc)is linked to the clay content,organic matter,and oxide or hydroxide content(Appelo and Postma,2005),which is calculated with following empirical formula(Breeuwsma et al.,1986):

where Pcis the percentage of clay(< 2 μm),and Pois the percentage of organic carbon in the sediment.
2.4.Water sample analysis
Inductively coupled plasma atomic emission spectroscopy(ICP-AES,iCAP 6300,Thermo)was used to determine concentrations of major cations.Ion chromatography,which was undertakenusinginstrumentmodelDX-120(Dionex),wasused to analyze major anions in unacidified aliquots,with detection limits of 0.1 mg/L.For most samples,ion charge imbalances were less than 5%.Stable isotopes of oxygen and hydrogen(δ18O and δD)were measured using the Picarro L2120-I instrument.Analytical precisions for δ18O and δD were ±0.1‰and ±1‰,respectively.The δ18O and δD values are expressed relative to the standard mean ocean water(SMOW).
3.Results
3.1.Sediment geochemistry
The investigated sediments were mainly composed of quartz and feldspar.Minor minerals,including anhydrite and muscovite,were found to occur in sediments O,S,C,and Q.Montronite was observed in sediment Q.Anhydrite was detected with a proportion of around 1.0%in sediments O,S,Y,and C.Sediment Y was dominated by fine and coarse sand fractions,whereas other sediments were dominated by silty sand and clay fractions(Fig.4).The estimated hydraulic conductivities of sediments based on the grain size distribution are presented in Fig.5,showing higher hydraulic conductivities in sediments with higher contents offine and coarse sands.Sediment Y,with greater than 90% fine and coarse sands,has a hydraulic conductivity of around 1.0 m/d.However,in sediment C,with around 60% fine and coarse sands,a hydraulic conductivity of 0.005 m/d is observed.Additionally,the yield efficiency,which is the ratio of PW extracted from sediment pores to sediment moisture content,is higher in the sediment with higher hydraulic conductivity(Fig.5).
Accordingly,sediment Y has a relatively lower moisture content(27.2%)than others(33.1%for sediment O,81.8%for sediment S,34%for sediment C,and 32.7%for sediment Q)(Fig.4).Of the investigated sediment samples,sediment S has the highest moisture content and the highest SOC content.The SOC content is negatively correlated with R530-520(r=-0.69)(Sedgwick,2012)(Fig.6).The sediment color is mainly controlled by the SOC content and the Fe(II)/Fe(III)ratio.With the higher content of SOC and the higher ratio of Fe(II)to Fe(III),sediments have lower values of R530-520,showing a gray color(van Geen et al.,2013).Thus,the negative correlation may imply that the presence of organic matter accelerates the reduction of Fe(III)to Fe(II)(Royer et al.,2002),resulting in a deep sediment color(Giosan et al.,2002).

Fig.4.Grain size distribution and moisture content of sediments.

Fig.5.Yield efficiency and hydraulic conductivity of sediments.

Fig.6.Correlation between R530-520and SOC content in sediments.
The cation exchange capacity largely depends on the SOC content.Sediment S has the strongest cation exchange capacity(137meq/kg)becauseithasthehighestSOCcontent.Crucially,the cation exchange capacity has a strong relationship with the TDSratio(theratiooftheaverageTDSconcentrationofsixPW samples to the TDS concentration of LW)(r=0.68)(Fig.7),indicating its in fluence on the salinity of PW.
3.2.Stable hydrogen and oxygen isotopes
The range of δ18O is between-11.7‰ and-7.3‰ and the range of δD is between-76.2‰ and-44.3‰ in rainwater.The rainwater samples fall on the local meteoric water line(LMWL)established by Wei et al.(1982),which has a slope of 7.3(Fig.8),while the global meteoric water line(GMWL)has a slope of 8.1(Rozanski et al.,1993).LW has δ18O values ranging from-6.6‰ to-2.9‰ and δD values ranging from-51.1‰ to-35.2‰,while PW has δ18O values ranging from-6.9‰ to-4.0‰ and δD values ranging from-51.8‰ to-40.4‰.A slope of 4.2 for the evaporation line(EL)determined by LW indicates that recharging lakes undergo evaporation(Pang et al.,2017).Values of stable isotopes of LW and PW are similar at sites O,Y,and Q,but at sites S and C large differences are observed(Fig.9).At site S,both the δD and δ18O of LW are higher than the average values of six PW samples,while at site C δD and δ18O are lower(Fig.9).

Fig.7.Relationship between cation exchange capacity and TDS ratio.

Fig.8.Variations in δD and δ18O of LW and PW extracted from sediments at different sites.
PW samples lie close to the EL,showing that PW is mainly recharged from in filtration of LW(Fig.8).LW samples at sites O,S,Y,and C have much higher δD and δ18O values than those at site Q(Fig.9)due to high evaporation intensity and the recharge of the urban reclaimed water enriched with heavier isotopes(Yi et al.,2011;Wang et al.,2017).Comparison of the isotopic compositions of PW from sediment with different pore sizes shows that there are no large variations in isotopic compositions of PW in each sediment(Fig.9),which may be due to quick exchange of water molecules between the different-sized pores(Sch¨on et al.,2016).

Fig.9.Variations in δD and δ18O of LW and PW with pore size in different sediments.
3.3.Chemical compositions
As presented in the piper diagram(Fig.10),the LW is of the Na-Ca-HCO3-Cl type at sites O,Y,and C,and the Ca-HCO3-SO4type at sites S and Q.It can be seen from Fig.11 and Fig.12 that LW samples have relatively lower TDS concentrations,ranging from 169 to 494 mg/L.The highest TDS concentrations are observed in LW at site Y,while the LW at site S has the lowest TDS concentration.
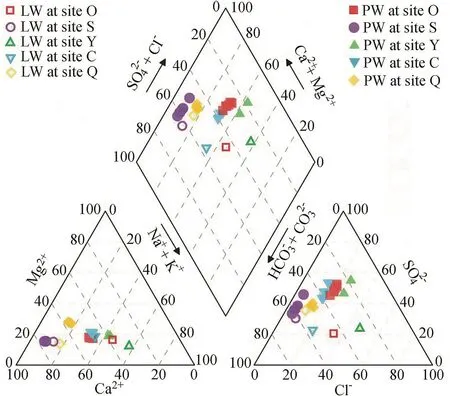
Fig.10.Piper plots of LW and PW.
The PWis of the Ca-Na-SO4-HCO3type at sites O,Y,and C,and the Ca-HCO3-SO4type at sites S and Q(Fig.10).The TDS concentration of all PW samples ranges from 303 to 1020 mg/L,whichishigherthanthoseofthecorrespondingLW(Fig.12).The average TDS concentration of six PW samples is highest at site Y(1070 mg/L),followed by sites O(979 mg/L),C(672 mg/L),S(457 mg/L),and Q(311 mg/L).PW samples extracted from sediment Y at centrifugal speeds of 6000,10000,15000,and 20000 rpm and from sediment Q at a centrifugal speed of 1500 rpm are not sufficient for major ion analysis and not shown in Fig.12.Distinct differences in chemical compositions are observed between the LW and the PW.The water type changes from the Na-Ca-HCO3-Cl type in LW to the Ca-Na-SO4-HCO3type in PWat sites O,Y,and C(Fig.10).The TDS ratio is 2.7 at site S,which is higher than that at site Q(around 1.4).The TDS ratiosatothersites(O,Y,andC)areabout2.0(Fig.11).Theratios of the average Mg2+(or Ca2+)concentration of six PW samples toMg2+(orCa2+)concentrationofLWatsitesO,S,andCarethe same as the TDS ratios.The ratio of the averageconcentrationofsixPWsamples toconcentrationofLWishigher than the TDS ratio,whereas the ratios of the average Na+,Cl-,andconcentrations of six PW samples to those of LWare lower than the TDS ratio(Fig.11).In particular,in comparison withLW,concentrationsofNofPWinsedimentsO,S,andC are lower andconcentrations are higher,which may be related to denitrification in the PWof those sediments.
Major ions show no large distinctions among PW from pores of different sizes in each sediment sample.Slightly increasing concentrations of Na+,K+,andwith decreasing pore sizes are observed in PW of sediments O,S,C,and Q(Fig.12).However,the TDS concentration of PW is nearly unaffected by the pore size of sediment.

Fig.11.Ratios of average concentrations of TDS and major ions of PW from different-sized pores to corresponding concentration of TDS and major ions of LW.

Fig.12.Variations of TDS and major ions concentrations of PW with pore size in five sediments.
4.Discussion
4.1.StableisotopiccompositionsofLWandPWfromporesof different sizes
Precipitation,as the major source of LW,controls its isotopic compositions,but LW is usually more enriched in heavy stable isotopes than precipitation due to evaporation(Fig.8).The PW trapped in sediments comes mainly from overlying LW.Thus,isotopic compositions of PW are governed by three physical or geochemical processes:exchange between LW and PW,evaporation,and isotope equilibrium fractionation between PW and minerals in sediment(Gat,1996).
Although isotope equilibrium fractionation between water and minerals can affect isotopic compositions of PW,higher temperature and longer time periods(>0.5 Ma)are required(O'Neil and Taylor,1969;M´eheut et al.,2010;Boschetti,2013).In this study,the PW is hosted at ambient temperature for less than 300 years(Zhang and Li,2003),so the influence of isotope equilibrium fractionation on the isotopic compositions of PW can be neglected.In addition,the isotopic compositions of PW are hardly in fluenced by evaporation because sediment is at the bottom of LW and always remains saturated.
Therefore,the exchange between LW and PW mainly controls the isotopic compositions of PW,and the rate of water exchange determines the isotopic differences between LW and PW.The similar isotopic compositions of LW and PW at sites O,Y,and Q are due to the rapid exchange of water between LW and PW.Large differences are observed at sites S and C.The δD and δ18O values of LW tend to have larger values than those of PW at site S,but the opposite occurs at site C.At site S,the lake is mainly recharged by local precipitation and adjacent springs enriched in lighter isotopes in the monsoon season,and by the Miyun diversion channel water,enriched in heavier isotopes,in the dry season(Zhang and Li,2003).The Miyun diversion channel runs throughout the lake from north to south and largely recharges the lake in the dry season.The recharge from the Miyun diversion channel directly changes water isotopes in LW,and subsequently affects water isotopes of PW,resulting in isotopic differences between LWand PWat site S.However,at site C,the Liangma River,as a major supply source of the lake,is enriched in heavier isotopes because it is mainly recharged by urban reclaimed water(Wang et al.,2016,2017).In the early dry season,the upstream rivers enriched in lighter isotopes recharge the Liangma River,which dilutes the LW,but the PW is still enriched with heavier isotopes.The differences in Cl-concentrations between LW and PW at sites S and C also contribute to this lag effect(Fig.11),which is consistent with observation by Aseltyne et al.(2006).
However,no large differences in isotopic compositions of PW from pores of different sizes are observed for the sediment samples(Fig.9),suggesting that isotopic compositions of PW are not affected by the size of the pore.This may be due to the balance of exchange among water molecules from pores of different sizes.Therefore,the residence time of PW is long enough for water molecule exchange with pores of different sizes,which is shown to be an almost instantaneous process(Sch¨on et al.,2016).
4.2.Chemical compositions of LWand PW from pores of different sizes
In comparison with LW,the TDS concentrations of PW are higher(Fig.11).This shift is mainly ascribed to remobilization of ions bound to clay or organics by desorption(Berg et al.,2001;Sch¨on et al.,2016)and the dissolution of solid phases such as anhydrite(McManus et al.,2016).
The cation exchange capacity has a positive correlation with the ratio ofthe average TDSconcentrationof six PW samples to TDS concentration in LW(Fig.7),indicating that the remobilization of ions bound to clay or organics by desorption plays a key role in higher TDS concentrations of PW.Saini and MacLean(1965)found that the organic matter content showed a significant relationship with anion exchange capacity(AEC).Compared to other ions,concentrations of Ca2+,Mg2+,andsignificantly increase(Fig.11).They are easily adsorbed on clay or organics and mostly remobilized after interaction between PW and sediments.In addition,higher TDS concentrationsinPWresultfrommineraldissolution.AhighTDSratio with low cation exchange capacity is observed at site Y,suggesting that TDS enrichment is accompanied by dissolution of solid phases,especially anhydrite.

Concentrations of K+,Na+,andof PW from different-sized pores show fewer differences,and concentrations of Ca2+,Mg2+,and Cl-,which are in general agreement with previous studies(Kinniburgh and Miles,1983;Winger et al.,1998),almost remain unchanged(Fig.12).Solid phases with a large specific surface area usually adsorb more ions(Appelo and Postma,2005).Thus,the smaller-sized pores have stronger adsorption capacities than the larger-sized pores.Therefore,during evolution of PW,the K+,Na+,andof small pores are remobilized more often than those of large pores due to the moderate adsorption capacity(Sacchi et al.,2001;Li et al.,2009,2015),while for Ca2+and Mg2+the remaining fraction cannot be remobilized because of stronger adsorption capacity.Since Cl-has the weakest adsorption capacity,it can basically be completely desorbed during evolution of PW.These phenomena are not as apparent in the PW of sediment Y due to its low adsorption capacity.
5.Conclusions
Similar isotopic compositions in LWand PWare observedat sites O,Y,and Q,while distinct isotopic compositions are observed at sites S and C.The reason for the difference is that isotope exchange between LW and PW has a lag effect when LWis recharged rapidly.However,the isotopic compositions in PW from pores of different sizes remains unchanged because isotopic exchange of water molecules in different-sized pores is a quick process.Significant differences in chemical compositions between LW and PW are observed at the five sites.Remobilization of ions bound to clay and organics and concomitant dissolution of soluble solid phases lead to higher TDS concentrations in PW than in LW.In addition,denitri ficationcontributestovariationofPWchemistrywhensediments contain a large amount of organic matter.Concentrations of Ca2+,Mg2+,and Cl-remain unchanged,while concentrations of Na+,K+,andin PW slightly increase with decreasing pore size,due to their moderate adsorption capacity and the difference in adsorption characteristics between different grain sizes.Therefore,complicated geochemical processes including remobilization,dissolution,anddenitrificationgovernchemical variations in LW through large-sized pores to small-sized pores during water-rock interaction.These findings are important for environmental and forensic study of PW,especially since LW and PW from different-sized pores are not as isolated as was formerlyassumed.Inaddition,thispaperdescribesasimpleand relatively accurate method of extracting PW samples directly from sediments,especially clay,for paleoenvironmental study of aquifer systems.
 Water Science and Engineering2018年2期
- Water Science and Engineering的其它文章
- Impacts of prior parameter distributions on Bayesian evaluation of groundwater model complexity
- Lagrangian simulation of multi-step and rate-limited chemical reactions in multi-dimensional porous media
- Simulation of denitrification in groundwater from Chaohu Lake Catchment,China
- Estimating submarine groundwater discharge and associated nutrient inputs into Daya Bay during spring using radium isotopes
- A new shear rheological model for a soft interlayer with varying water content
- Deep soil water recharge response to precipitation in Mu Us Sandy Land of China