
Application of a hybrid multiscalar indicator in drought identification in Beijing and Guangzhou,China
2018-11-15 03:40MingweiMaWenhuanWangFeiYuanLiliangRenXinjunTuHongfeiZang
Water Science and Engineering 2018年3期
Ming-wei Ma,Wen-huan Wang*,Fei Yuan,Li-liang Ren,Xin-jun Tu,Hong-fei Zang
aSchool of Water Conservancy,North China University of Water Resources and Electric Power,Zhengzhou 450046,China
bCollaborative Innovation Center of Water Resources Efficient Utilization and Protection Engineering of Henan Province,Zhengzhou 450046,China
cState Key Laboratory of Hydrology-Water Resources and Hydraulic Engineering,Hohai University,Nanjing 210098,China
dDepartment of Water Resources and Environment,Sun Yat-sen University,Guangzhou 510275,China
Abstract The Palmer drought severity index(PDSI)is physically based with multivariate concepts,but requires complicated calibration and cannot easily be used for multiscale comparison.Standardized drought indices(SDIs),such as the standardized precipitation index(SPI)and standardized precipitation evapotranspiration index(SPEI),are multiscalar and convenient for spatiotemporal comparison,but they are still challenged by their lack of physical basis.In this study,a hybrid multiscalar indicator,the standardized Palmer drought index(SPDI),was used to examine drought properties of two meteorological stations(the Beijing and Guangzhou stations)in China,which have completely different drought climatologies.The results of our case study show that the SPDI is correlated with the well-established drought indices(SPI,SPEI,and PDSI)and presents generally consistent drought/wetness conditions against multiple indicators and literature records.Relative to the PDSI,the SPDI demonstrates invariable statistical characteristics and better comparable drought/wetness frequencies over time and space.Moreover,characteristics of major drought events(drought class,and onset and end times)indicated by the SPDI are generally comparable to those detected by the PDSI.As a physically-based standardized multiscalar drought indicator,the SPDI can be regarded as an effective development of the Palmer drought indices,providing additional choices and tools for practical drought monitoring and assessment.
©2018 Hohai University.Production and hosting by Elsevier B.V.This is an open access article under the CC BY-NC-ND license(http://creativecommons.org/licenses/by-nc-nd/4.0/).
Keywords:Drought;PDSI;Multiscalar index;SPDI;Multifaceted comparison
1.Introduction
Quantitative indices are crucial to drought monitoring and assessment,and their objective numerical expressions tend to satisfy multiple demands of measurement,spatiotemporal comparison,and synthetization in drought analysis(Zhang et al.,2016;Ma et al.,2016).The Palmer drought severity index(PDSI)and standardized precipitation index(SPI)both have milestone significance in the development of numerous drought indices(Palmer,1965;McKee et al.,1993;Heim,2002),and are most frequently used to monitor and assess drought conditions(Cook et al.,1999;Dai et al.,2004;Guttman,1999;Hayes et al.,1999;Lloyd-Hughes and Saunders,2002).
Specifically,SPI uses a skewed distribution(e.g.,Gamma distribution)to fit precipitation series,and then transforms the fitted skewed distribution to a standard normal distribution based on the principle of equal probabilities(McKee et al.,1993).In doing so,the derived quantiles of standard normal distribution,namely the SPI values,are regarded as indicator values to represent the deficiency of precipitation and corresponding drought status.This process of standardization with precipitation causes the SPI values at different times and locations to have invariable probabilistic properties with preferable spatiotemporal consistency and comparability(Guttman,1999;Shukla and Wood,2008).However,the limitations of the SPI are also easily observed,including its consideration only of the role of precipitation,its ignorance of actual water cycling processes,and a lack of physical mechanisms,making it unable to take into account the contribution of multiple factors in drought evolution(Kao and Govindaraju,2010;Hao and AghaKouchak,2013).As a supplement and improvement to the SPI,Vicente-Serrano et al.(2010a)adopted a three-parameter log-logistic distribution to fit the difference between precipitation and potential evapotranspiration,and created the standardized precipitation evapotranspiration index (SPEI),which is capable of considering the influence of two main elements in water income(precipitation)and consumption(evapotranspiration)at the same time.
In general,standardized drought indices(SDIs)such as the SPI and SPEI show particular strengths in simple computation,clear probabilistic interpretation,and flexible multi-temporal scale analysis(Vicente-Serrano et al.,2010b;Beguería et al.,2010,2014;Zhang et al.,2017).On the other hand,the PDSI is physically based through a two-stage soil-water balance bucket model and able to integrate multiple hydrometeorological variablesor factors(precipitation,runoff,evapotranspiration,and soil moisture)that are critical to water anomaly conditions(e.g.,drought)(Palmer,1965).The PDSI also suffers from complaints,however,because of undesirable spatiotemporal comparability,which largely arises from its construction and calibration on the basis of input data with limited locations(Alley,1984).In view of this,Wells et al.(2004)introduced the self-calibrating PDSI(SC-PDSI),which attempts to obtain location-dependent climatic parameters according to historical observation of a single station,instead of the conventional practice of obtaining a group of spatially universal parameters using meteorological observation at selected stations.Even so,the problems of the PDSI/SC-PDSI,including an internally fixed temporal scale and long-lasting memorability,remain to be addressed(Heddinghaus and Sabol,1991;Guttman,1998).Also,the subjectivity and arbitrariness of drought/wetness classification leading to mismatches in derived drought and wetness frequency also obstruct the use of the PDSI/SC-PDSI(Liu et al.,2016).Concerned with this issue,Ma et al.(2014),Zhang et al.(2015),Zhang and He(2016),and Liu et al.(2017)all provided additional solutions and developed the standardized Palmer drought index(SPDI),the standardized moisture anomaly index(SZI),and the multiscalar Palmer drought severity index(SC-PDSIx),respectively,to facilitate use of hybrid designs that combine the PDSI's physical mechanism and the SDI's multiscalar feature.
Since the World Meteorological Organization(WMO)stations used to develop the SPDI(Ma et al.,2014)are all outside China,this study aimed to further explore the applicability and feasibility of the SPDI at two Chinese meteorological stations(the Beijing and Guangzhou stations)through multifaceted comparisons with well-established drought indices(the SPI,SPEI,and PDSI)as well as drought records.To be specific,the targets of this study included(1)relationship analysis of multiple drought indices,such as correlation,similarity,and difference;and(2)comprehensive comparison between the SPDI and PDSI,in terms of statistical characteristics,drought/wetness frequency,characteristics of major drought events(drought class,onset time,and end time),multi-time scale drought time series,and records of historical drought/wetness conditions.
2.Methodology
2.1.Principle of PDSI
For drought measurement and assessment,Palmer(1965)suggested using the moisture departure between actual/observed precipitation and the amount of precipitation that is climatically appropriate for existing conditions,called CAFEC precipitation,to describe the potential water anomaly conditions(drought or wetness)of a place at a certain time.With purposeful restrictions to and sophisticated mathematical treatments of the moisture departure defined above,a set of objective Palmer indicators is ultimately obtained to measure and assess drought severity,of which the PDSI is the most important one(Alley,1985).In short,the soil water balance adopted by the PDSI is computed as follows:

where P and~P are the observed precipitation and CAFEC precipitation of an analyzed month,respectively;PET,PR,PRO,and PL are potential evapotranspiration,potential soil water recharge,potential runoff,and potential soil water loss,respectively;and d denotes the defined moisture departure of that month.The estimation of the CAFEC precipitation refers to several hydro-meteorological processes and variables,i.e.,

where αj, βj, γj,and δjare weight factors or water balance coefficients of each month j(j=1,2,…,12),and the terms with a subscript j and an overline are means of relevant variables of corresponding month j.The hydrological components,including evapotranspiration(ET),soil water recharge(R),runoff(RO),soil water loss(L),PET,PR,PRO,and PL,are generally calculated through hydrological accounting(Palmer,1965),while some studies also attempt to obtain simulations of these variables using well-established hydrological models(Mo,2008).
Once time series of moisture departure between observed and CAFEC precipitation are obtained,indicators of water anomaly conditions can be further calculated for determining the criteria and times of drought and wet periods as well as for estimating relevant drought severity.Details of calculation and usage of the PDSI can be found in Palmer(1965)and Wells et al.(2004).Moreover,formulation of the PDSI has much to do with regional climatic characteristics and duration factors that have to be empirically derived in the scheme of the original PDSI.Since the climatic characteristics and duration factors are determined by historical climatic observations of selected positions from a certain area,a series of re-calibration practices of PDSI have been conducted in China and other regions in consideration of differences in location and climate(An and Xing,1986;Liu et al.,2004).However,for the SCPDSI,site-dependent climatic characteristics and duration factors are automatically calculated based upon historical climatic data from a particular location with a proposed self calibrating algorithm(Wells et al.,2004).The classification and empirical frequency of drought/wetness for the PDSI/SCPDSI and the SPI/SPEI/SPDI are presented in Table 1.
2.2.Procedure of establishing SPDI
2.2.1.Moving accumulation of moisture departure
The monthly moisture departure d is first accumulated in a moving manner for different time windows(e.g.,three months)to derive time series of accumulated moisture departure at relevant time scales.Specifically,denotes accumulated moisture departure in the jth month of the ith year,whose value depends on the choice of time window k in months and can be obtained as follows:

where di-1,land di,ldenote monthly moisture departure of the lth month in the(i-1)th year and in the ith year,respectively.

Table 1 Drought/wetness classification and empirical frequency using different indices.
2.2.2.Division of time series considering seasonality
The influence of seasonality on water supply and dem and should be appropriately considered when using the accumulated moisture departureabove to describe relevant water anomaly conditions over different durations.In other words,an equal amount of water surplus or deficit can cause varying dry or wet effects for different periods or seasons(e.g.,summer vs.winter).To this end,the time series ofis further divided into 12 seasonal sub-series according to different ending months(January to December),namely X1={,,…},X2= {,,…}, …,and X12={+11,,…}.Thus,the derived seasonal sub-series X1,X2,…,X12are all moisture departures accumulated over an individual time span,which can effectively reduce the seasonality existing in original series of accumulated moisture departure.
2.2.3.Probabilistic fitting using skewed distribution
The generalized extreme value(GEV)distribution is used to probabilistically fit the seasonal sub-series of accumulated moisture departure(i.e.,X1,X2,…,X12)mentioned above.The cumulative distribution function of the GEV distribution can be expressed as follows(Kotz and Nadarajah,2000):
where x is the independent variable and F(x)is the corresponding cumulative probability;and μ, α,and κ are the location,scale,and shape parameters of the GEV distribution,respectively,which can be estimated through the maximum likelihood method.In order to fit all the seasonal sub-series X1,X2,…,X12,12 cases of the GEV distribution with different combinations of parameters μ, α,and κ are separately constructed.
2.2.4.Standardization for quantiles as drought indicator
The quantiles of standard normal distribution,as drought indicators of defined SPDI values(VSPDI),can finally be calculated using the following formula(Abramowitz and Stegun,1965):

where a0=2.515517,a1=0.802853,a2=0.010328,b1=1.432788,b2=0.189269,and b3=0.001308.If F(x)>0.5,thenand s=1;if F(x)≤ 0.5,thenand s=-1.
In fact,the standardization processes described above are also separately conducted with 12 seasonal sub-series of accumulated moisture departure.Then,the derived index values of standardized normal variables corresponding to each seasonal sub-series are re-combined and ordered in accordance with a natural time sequence as one temporally consecutive series,which forms the final time series of the SPDI as a monthly drought indicator.
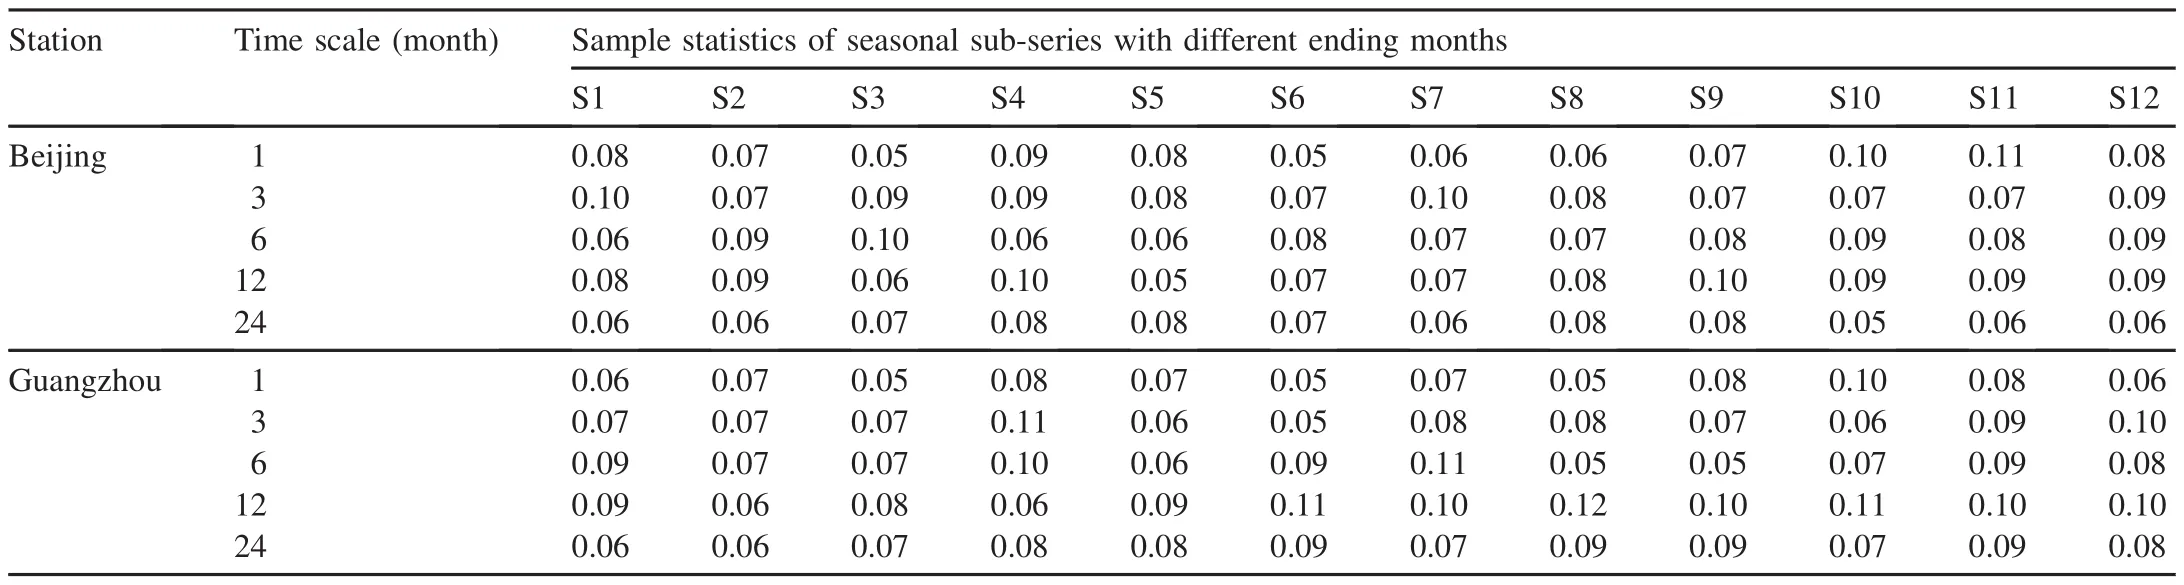
Table 2 Sample statistics of K-S tests of GEV distribution for fitting seasonal sub-series of moisture departure.
3.Case study
3.1.Sites and data
Two typical meteorological stations,the Beijing station(39°48N,116°28E)in northern China and the Guangzhou station(23°10N,113°20E)in southern China,were selected to conduct a case study.Beijing is located in the northern part of the North China Plain and mainly influenced by a temperate continental monsoon climate.Although it is classified as a semi-humid area,its precipitation is largely composed of heavy rains in summer.During the rest of the year,water deficit is quite common and drought dominates months to years.In contrast,lying at the estuary of the Pearl River Delta,Guangzhou is dominated by a tropical oceanic monsoon climate.As a humid area,Guangzhou has generally sufficient precipitation during different seasons and water shortage only occurs with flash droughts.The significant differences between these two meteorological stations in geography and climate may result in completely different drought climatology.The SPDI models of the two stations were constructed with corresponding historical drought indices computed according to the methodology above,so as to partially investigate the feasibility and reliability of the SPDI across different regions and/or climates in China.The main meteorological data used here included historical observations of monthly total precipitation and monthly mean air temperature of Beijing(1951-2012)and Guangzhou(1952-2012).Meanwhile,available water-holding capacity of soil layers in Beijing and Guangzhou were set at 240 mm and 290 mm,respectively,as recommended by Liu et al.(2004).In addition,potential evapotranspiration of each month for the two stations was estimated using the Thornthwaite method based on monthly mean air temperature and geographic latitude(Thornthwaite,1948).
3.2.Goodness-of-fit of GEV distribution
The Kolmogorov-Smirnov(K-S)test was adopted to examine goodness-of-fit of GEV distribution for fitting seasonal sub-series of moisture departure at the Beijing and Guangzhou stations.Results of the K-S tests for five time scales(i.e.,1-month,3-month,6-month,12-month,and 24-month)are presented in Tables 2 and 3,where the 12 data samples indicated as S1,S2,and so forth up to S12 are,respectively,the seasonal sub-series of moisture departure with ending months of December,January,and so forth up to November.The sample statistics of K-S tests for 12 seasonal sub-series of moisture departure at five time scales are all smaller than the corresponding critical statistics(0.17)at the significance level of 0.05,while all the p-values(where p is the probability)of relevant K-S tests are far greater than 0.05.In other words,the GEV distribution has passed the goodness-off it tests with excellent performance and can be accepted as atheoretical probability distribution of relevant seasonal subseries of moisture departure at the Beijing and Guangzhou stations.The results of fitting seasonal sub-series of moisture departure at a 12-month time scale using the GEV distribution for the Beijing station are provided in Fig.1.It can be seen that probabilistic properties of seasonal sub-series of moisture departure at the Beijing station are satisfactorily represented by the GEV distribution,with agreement between all empirical points and theoretical curves.Similar results are found for the Guangzhou station.
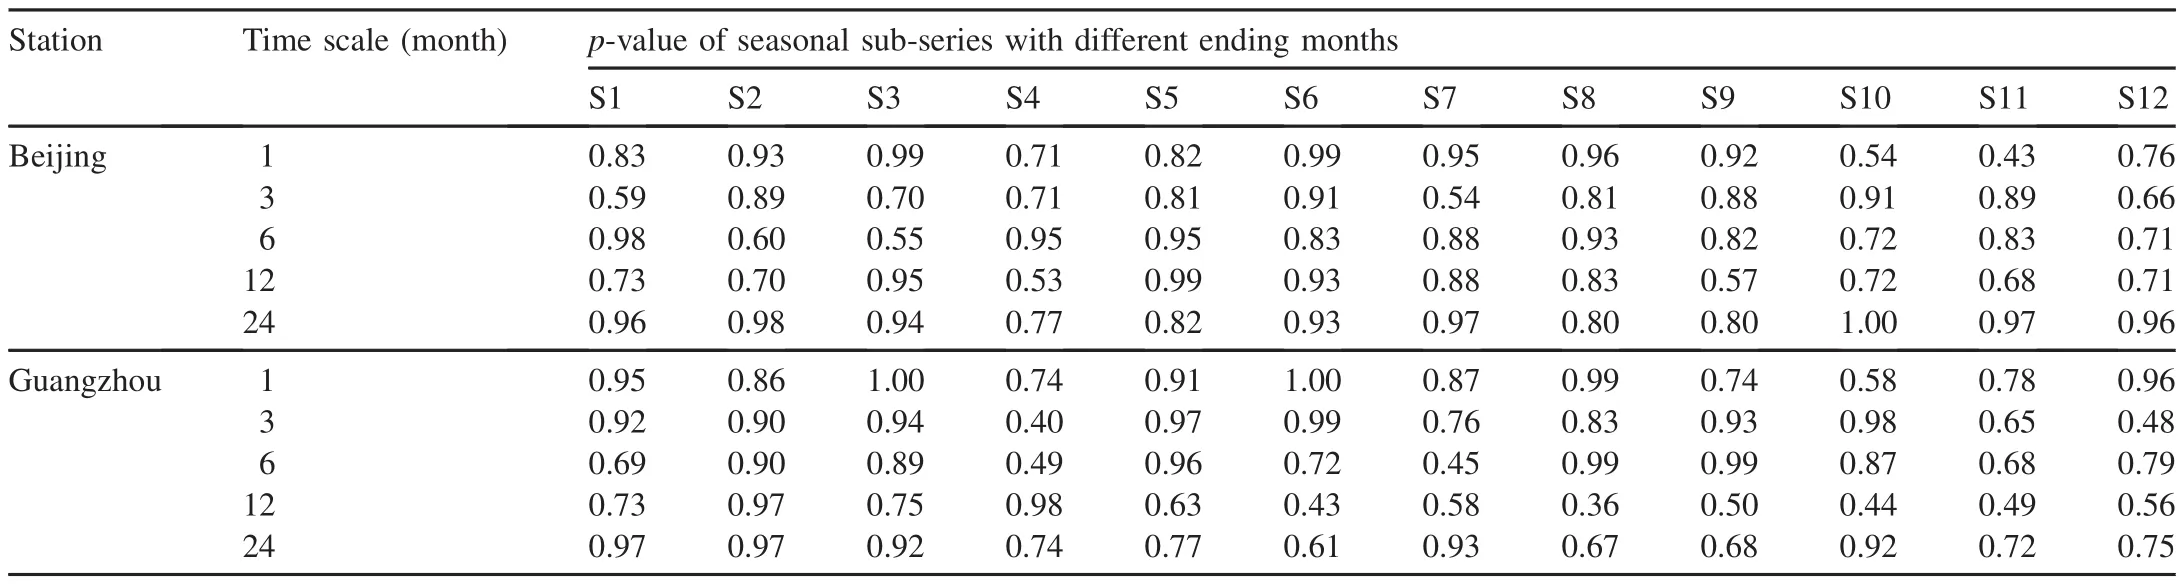
Table 3 p-values of K-S tests of GEV distribution for fitting seasonal sub-series of moisture departure.
With acceptance of the GEV distribution as the theoretical probability distribution of moisture departure,cumulative probabilities of seasonal sub-series of moisture departure were readily calculated with Eq.(4).Processes for standardization from the skewed GEV distribution into the standard normal distribution presented by Eq.(5)were then conducted to obtain probabilistic quantiles and subsequent monthly time series of the SPDI for drought analysis.Like the SPI and SPEI,thresholds of the SPDI for classification of drought/wetness depend on the curve and quantile features of standard normal distribution(see Table 1).
3.3.Relationship analysis of multiple drought indices

Fig.1.Fitting seasonal sub-series of moisture departure at 12-month time scale using GEV distribution for Beijing station.

Fig.2.Correlations between SPDI and SPI/SPEI/SC-PDSI at Beijing and Guangzhou stations.
The reliability of the proposed SPDI model and results of relevant drought indicator values were first examined through a comparison of multiple drought indices.For this purpose,monthly time series of the SPI,SPEI,and PDSI at the Beijing and Guangzhou stations,with the same input data of historical hydro-meteorological observations,were constructed.It should be noted that the PDSI hereafter refers to the SC-PDSI,as suggested by Wells et al.(2004).Fig.2 shows the results of Pearson's correlation coefficient(CC)between the SPDI and the SPI/SPEI/SC-PDSI.It is seen that for all time scales the SPDI values are significantly correlated to the SPI/SPEI at the Beijing station,with all CC values greater than 0.8,and the correlations are higher for longer time scales.Nevertheless,the correlation between the SPDI and the SPEI is overall higher than that between the SPDI and the SPI,the main reason being that both the SPDI and SPEI are based on water balances containing precipitation and potential evapotranspiration,whereas the SPI only considers the anomalies of precipitation.The computed SPDI and SC-PDSI are also apparently correlated with each other and the maximum CC value is close to 0.9 at the 12-month time scale,indicating an inherent time scale of about 12 months in monthly time series of the SC-PDSI at the Beijing station.On the other hand,very strong correlations between the SPDI and both the SPI and the SPEI are reported at the Guangzhou station,with little difference among various time scales and all CC values greater than 0.95.This means that the SPEI and the SPDI(considering multiple variables)tend to hardly alter the drought sequences in comparison to the SPI(only emphasizing precipitation)for a humid area with a rainy climate like Guangzhou.In other words,with water anomaly conditions the direct influence of precipitation variation at the Guangzhou station highly overtops the effects of other factors,such as temperature and evapotranspiration.Although correlations between the SPDI and the SC-PDSI are a little weaker for the Guangzhou station,the CC values still reach 0.71 and 0.68 at 6-month and 12-month time scales,respectively.This also shed light on the applicability of the Palmer drought model at the Guangzhou station.To be specific,the PDSI/SC-PDSI,mainly designed for arid and semiarid climates,might not be completely adaptable to humid regions of southern China,and the same would be true of the SPDI.
Fig.3 compares historical drought indices of 12-month SPI,SPEI,and SPDI values as well as the SC-PDSI at the Beijing and Guangzhou stations.The evolutions of the SPI-12,SPEI-12,SPDI-12,and SC-PDSI are quite similar as a whole.For instance,the Beijing station was dominated by wet periods with potential flooding in the 1950s.However,droughts of different levels were reported in the 1960s,1970s,and 1980s,while the 1960s and the first half of the 1980s witnessed the most severe drought conditions.This area experienced a slight wetness condition from the mid-1980s until the end of the 1990s,with only a few mild drought spans.A latent drought starting at the end of the 1990s became prolonged after the year 2000 and lasted for more than a decade before temporarily coming to an end in 2011.Though alternations of drought and wetness indicated by the SPI,SPEI,SPDI,and SC-PDSI showed agreement,the extremes of the SPDI tended to slightly contract in comparison to the SPI and SPEI in most cases,since the SPDI further took into account the effects of runoff and soil moisture in addition to precipitation and evapotranspiration examined by the SPI and SPEI.Also,differences between the SPI and SPEI/SPDI became more evident for the persistent drought period after 2000 as a result of the dramatic effects of global warming in recent decades.The rate of temperature rise at the Beijing station was about 0.4°C per ten years,but the SPI could not consider potential increases in water demand for evapotranspiration caused by rising temperatures and thereby underestimated drought magnitude relative to the SPEI and SPDI.On the other hand,intensive fluctuations are presented in the evolution of multiple drought indices at the Guangzhou station,indicating more frequent alternations between drought and wetness.Serious droughts were mainly reported in the late 1960s and early 1990s,whereas drought and wetness conditions appeared alternately for other periods on the whole.Some continuous wet periods occurred mainly in the 1970s,mid-1990s,and the first few years of the 21st century.These alternations of drought and wetness indicated by the SPI,SPEI,SPDI,and SC-PDSI coincide at the Guangzhou station,showing no significant difference.
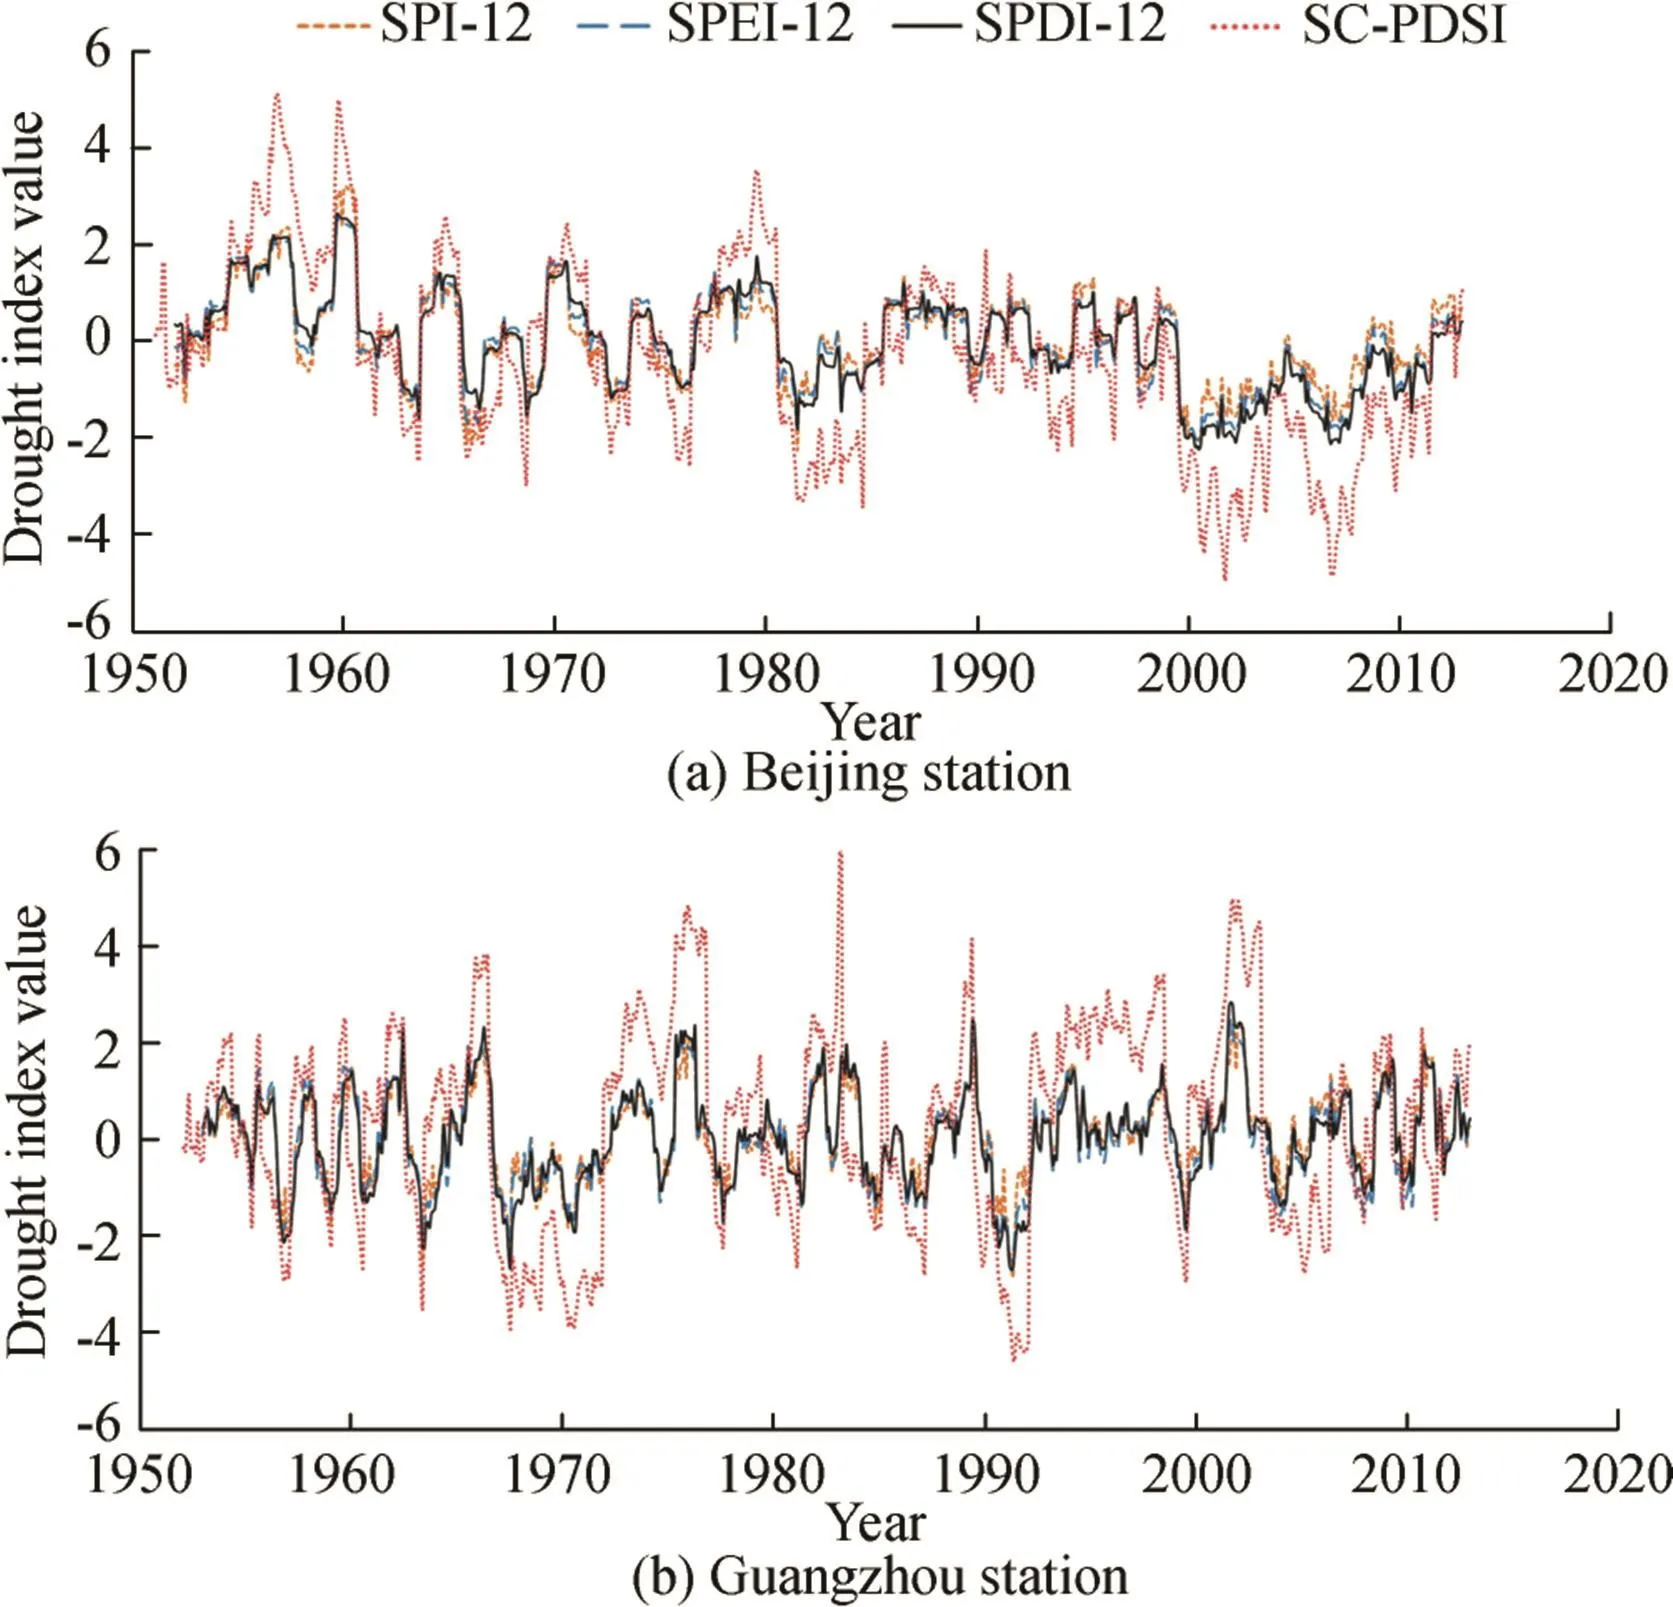
Fig.3.Comparison of historical drought indices at Beijing and Guangzhou stations.
3.4.Comprehensive comparison between SPDI and SC-PDSI
Statistical characteristics(mean and variance)of the SPDI and the SC-PDSI are calculated and compared in Table 4.The mean and variance of the SPDI for the Beijing and Guangzhou stations are similar,with the mean being close to 0 and the variance being close to 1,demonstrating that it is a standard normally-distributed variable.In contrast,mean values of the SC-PDSI for the two stations are distinguished with opposite signs(-0.3548 and 0.2764),while corresponding variances are larger and also differ a lot in value(3.5901 and 4.3697).Fig.4 shows results of the frequencies of different categories of drought and wetness at the Beijing and Guangzhou stations.It can be seen that the frequencies of moderate-or-above drought/wetness measured by the SPDI are(1)overall comparable for the same class of drought and wetness at a specific site,and(2)basically invariable for different classes of drought and wetness at different locations with frequencies of moderate,severe,and extreme drought/wetness being about 15%-17%,6%-8%,and 2%-3%,respectively.Nevertheless,frequencies of the same class of drought and wetness detected by the SC-PDSI show significant differences at a given location and are also significantly different for various classes of drought and wetness at different locations.For instance,SCPDSI based frequencies of all classes of drought are apparently lower than those of wetness at the Beijing station,whereas opposite results are found at the Guangzhou station.These findings suggest that the strategy of standardization of the SPDI upon Palmer's moisture departure can allow for consistent statistical characteristics and invariable probabilistic properties in derived drought indicator values for different time scales and locations,implying better spatialtemporal comparability.As the predecessor of the SPDI,the PDSI/SC-PDSI suffers from its regional calibration with limited sites of input data and its subjectivity and arbitrariness in drought/wetness classification,leading to varying representativeness and insufficient comparability for drought and wetness conditions at different spatial-temporal scales.
The characteristics of major drought events,including drought class,onset time,and end time derived from the SPDI are also compared to those indicated by the SC-PDSI.Results of the SPDI-12 for the Beijing station and the SPDI-6/SPDI-12for the Guangzhou station are used since they have the highest correlation to the relevant SC-PDSI(see Fig.2).Here the major drought events are defined as drought processes indicated by either the SPDI or SC-PDSI with(1)a duration of three months or longer and(2)a moderate-or-above severity peak.In terms of this definition,nine major drought events are detected by the SPDI-12 in the history of Beijing,while the SPDI-6 and SPDI-12,respectively,indicate 17 and 15 major drought events for Guangzhou.Results of major drought event identification using the SPDI against the SC-PDSI as a baseline are shown in Table 5.It is seen that one would expect less than a 50%chance of finding exactly the same drought class,onset time,and end time indicated by the SPDI-12 as one would expect with the SC-PDSI at the Beijing station.However,biases in derived drought class for the SPDI-12 and the SC-PDSI are all within one level,while relevant biases in drought onset time and end time are generally within two months(seven out of nine).That is to say,characteristics of major drought events presented by the SPDI-12 and SC-PDSI show acceptable agreement at the Beijing station.Similar results are also found for comparison of major drought event characteristics between the SPDI-6/SPDI-12 and the SC-PDSI at the Guangzhou station.However,more significant differences in end times of defined major drought events using the SPDI-6 and the SPDI-12 versus the SC-PDSI are reported and their biases within two months have less than a 50%chance of agreement.In summary,relative to the Guangzhou station,more accordant characteristics of major drought events based on the SPDI and the SC-PDSI are found for the Beijing station,since these two Palmer-based drought indices might be more adaptable to an arid and semi-arid area such as Beijing.
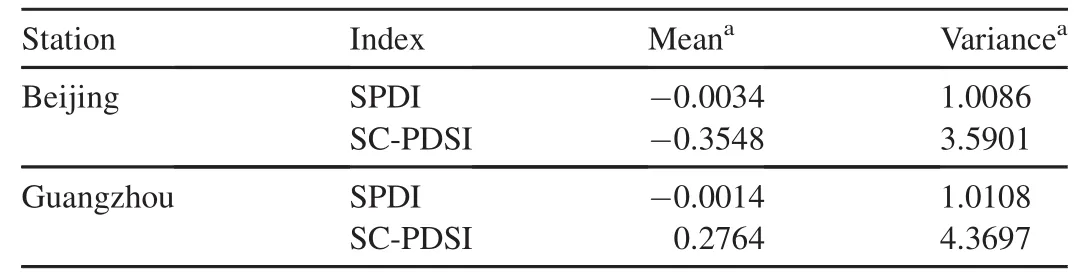
Table 4 Mean and variance of SPDI and SC-PDSI for Beijing and Guangzhou stations.

Fig.4.Comparison of drought/wetness frequency based on SPDI and SC-PDSI(Averages of frequencies of moderate,severe,and extreme drought/wetness based on SPDI-1,SPDI-3,SPDI-6,SPDI-12,and SPDI-24 are presented here).
Records of historical drought and wetness conditions at the Beijing station were collected(Liu et al.,2004;Wen and Xie,2005;Zhang et al.,2008)and finally used to investigate the reliability of the SPDI versus the SC-PDSI(see Table 6).Evolutions of the SPDI at different time scales(the SPDI-1,SPDI-3,SPDI-6,and SPDI-12)and the SC-PDSI for theBeijing station are shown in Fig.5.As shown in Table 6,Beijing was dominated by frequent drought and wetness periods from 1951 to 2012.The drought durations varied from months to years while the worst drought conditions lasted for more than ten years from 1999 to 2011.The wetness conditions generally meant floods caused by heavy rains,particularly in summer(e.g.,July).Relevant descriptions of historical drought and wetness conditions in the literature confirm the validity of the calculated SPDI and SC-PDSI in Fig.5.In other words,the recorded drought and wetness periods are all identified by the SC-PDSI and multi-temporal SPDI to certain degrees.However,from the comparison of the multi-time scale SPDI and fixed-time scale SC-PDSI,it is also found that long-term drought indices(the SPDI-12 and SC-PDSI)tend to present only a few prolonged wet and dry spells.In contrast,short-term SPDIs(especially the SPDI-1 and SPDI-3)are more sensitive to water anomaly conditions and generally show significant fluctuations,indicating more potential drought events with different durations and severity.Also,relative to the SC-PDSI,the multiscalar SPDI can provide more useful information and details for drought monitoring and management.To be specific,some drought(wetness)episodes during long continuous wetness(drought)processes can be properly identified and assessed through a combination of long-term and short-term SPDIs.These characteristics of droughts at multiple time windows are highly significant to drought analyses for different purposes.Since the PDSI/SCPDSI can only monitor drought at a fixed time scale,one would conclude that the SPDI has the strength of a multi-time scale and is more flexible for multi-objective drought monitoring and assessment.For instance,short time scales(e.g.,SPDI-1)are important to agricultural concerns such as drought,whereas long time scales(e.g.,the SPDI-6 and SPDI-12)are of more significance to hydrological inquiries.In addition,a short-term SPDI(e.g.,the SPDI-1)is also useful for monitoring flash floods that may cause casualties and property losses,such as the Beijing “7·21”catastrophic natural disaster of July 2012.
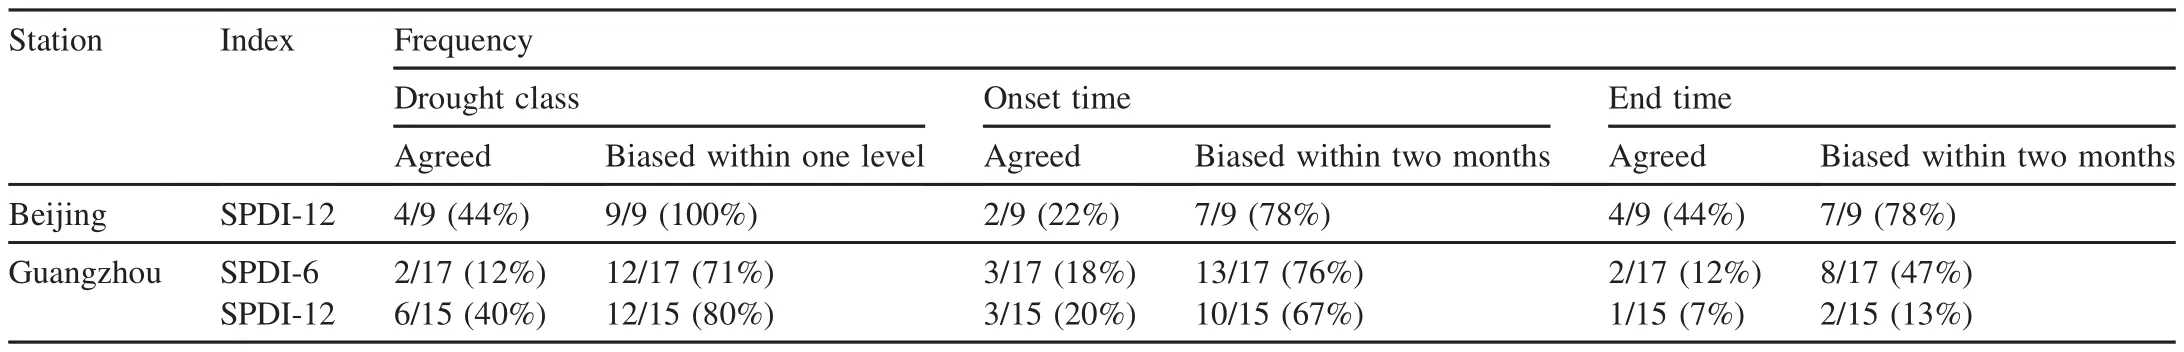
Table 5 Characteristics of major drought events detected by SPDI against SC-PDSI.

Table 6 Records of historical drought and wetness conditions in Beijing from 1951 to 2012.

Fig.5.Comparison of multi-time scale SPDIs and fixed-time scale SC-PDSI at Beijing station.
4.Conclusions
The SPDI is physically based and includes a multiscalar feature that is similar to the SZI and SC-PDSIx.As shown by the results reported in previous studies(Zhang et al.,2015;Zhang and He,2016;Liu et al.,2017)and the present study,these kinds of hybrid drought indicators tend to provide better performance than the SC-PDSI and SPI/SPEI in drought characterization.The superiority of the SPDI(as well as the SZI and SC-PDSIx)may arise from two characteristics.First,the multiscalar design of the SPDI allows improvement on the PDSI's drawbacks of its fixed time scale and strong calibration influence.Second,the concept of water supply and demand(defined by the PDSI)adopted by the SPDI provides more physically-based and more comprehensive estimates of land surface moisture anomalies as compared to the SPI/SPEI.
As a hybrid design of the SDI and the PDSI,the SPDI is not only flexible for multi-temporal analysis(like the SDI)but also has a necessary physically-based drought mechanism(the same as the PDSI).In other words,the SPDI can be regarded as a combination of the SDI and the PDSI,possessing merits of the two.Based on probabilistic properties of Palmer's moisture departure,the SPDI makes it possible to avoid complicated calibration of the PDSI/SC-PDSI and to obtain a more robust and reliable drought assessment benefiting from its invariable statistical characteristics and better comparable drought/wetness frequencies.
This case study shows that the SPDI is apparently correlated to the SPI/SPEI/SC-PDSI and indicates generally coincident drought/wetness conditions against multiple indicators and literature records.When considering potential effects of temperature rise on drought trends,the SPDI can provide more informative indications than the SPI.For the Beijing and Guangzhou stations,characteristics of major drought events(drought class,onset time,and end time)detected by the SPDI are generally comparable to those indicated by the SC-PDSI,supporting the fact that the SPDI is a supplement to the PDSI/SC-PDSI.However,these two Palmer drought modelbased indicators seem less applicable in humid regions than in semi-humid/semi-arid regions,an issue that should also be investigated further.
 Water Science and Engineering2018年3期
- Water Science and Engineering的其它文章
- On relationship between curve numbers and phi indices
- Analysis of influence of observation operator on sequential data assimilation through soil temperature simulation with common land model
- Common effluent treatment plant(CETP):Reliability analysis and performance evaluation
- Disinfection of dairy wastewater effluent through solar photocatalysis processes
- Numerical study of hydrodynamic mechanism of dynamic tidal power
- Evaluation of numerical wave model for typhoon wave simulation in South China Sea