水分亏缺程度对变量灌溉水分传感器埋设位置预判的影响
2018-11-24 01:37李秀梅赵伟霞李久生栗岩峰
农业工程学报 2018年23期
李秀梅,赵伟霞,李久生,栗岩峰
水分亏缺程度对变量灌溉水分传感器埋设位置预判的影响
李秀梅,赵伟霞,李久生※,栗岩峰
(中国水利水电科学研究院 流域水循环模拟与调控国家重点实验室,北京 100048)
基于土壤黏粒含量遴选可代表平均土壤含水率的点位,是确定变量灌溉系统土壤水分传感器网络埋设位置的重要方法。为了评估水分亏缺程度对传感器埋设位置的影响,该研究通过在不同土壤可利用水量管理区内设置不同的水分亏缺灌溉处理,基于土壤含水率时间稳定性原理,分析了水分亏缺程度和土壤性质对冬小麦主要根系层内土壤含水率空间分布结构相似性和直接代表平均土壤含水率点位的影响。结果表明,受土壤性质和水分亏缺程度的影响,在土壤砂粒含量随土层深度增加而增大的1区,土壤含水率空间分布结构相似性仅在2016年的雨养处理达到了显著水平(0.05),而在土壤剖面质地均匀的2区,2016年的雨养和高、中、低水分亏缺处理和2017年的中、低水分亏缺处理均达到了显著水平(0.05)。在冬小麦主要根系层内,不同土壤性质管理区直接代表平均土壤含水率点位占总测点数的比例基本相等。受水分亏缺程度的影响,1区直接代表平均土壤含水率的测点比例随水分亏缺程度减小而增加,2区则呈先减小后略有增加趋势。除2016年高水分亏缺处理外,0~0.2、>0.2~0.4、>0.4~0.6 m土层代表平均土壤含水率点位的黏粒含量与该土层平均黏粒含量之间均存在显著的线性关系(0.05),2 a拟合系数变化范围为0.66~1.03,且2017年拟合系数随土壤水分亏缺程度增加呈增大趋势。因此,在砂壤土地块变量灌溉管理区内,基于管理区平均土壤黏粒含量进行土壤水分传感器埋设位置遴选时,需根据拟采用的水分亏缺管理模式对拟合系数进行修正。
土壤;水分;传感器;网络;时间稳定性;埋设位置;冬小麦;变量灌溉
0 引 言
变量灌溉处方图的生成依赖于各种传感器网络实时监测和反馈不同管理区内土壤水分、作物生长和气象条件等信息[1-2]。土壤水分传感器用于监测土壤水分对作物的满足程度,是生成变量灌溉处方图常用的工具之一[3-5]。因为每种类型的土壤水分传感器均有一定的测量范围,因此确保土壤水分传感器埋设位置处所测定的土壤含水率对田块内平均值的代表性是变量灌溉技术应用时面临的主要任务[4]。
自1985年Vachaud等[6]介绍了土壤含水率时间稳定性概念后,国内外学者先后应用土壤含水率时间稳定性原理在不同土壤物理性质[7-10]、海拔[11-12]、研究尺 度[13-14]和植被覆盖[15]条件下开展了直接代表平均土壤含水率(以下简称为“代表含水率”)的样点位置研究。2017年,Zhao等[16]在变量灌溉管理中开展了基于时间稳定性原理的土壤水分传感器埋设位置研究,通过在不同土壤可利用水量管理区设置相同的灌水下限,以均一灌溉管理为对照,研究了变量灌溉管理下主要根系层的土壤含水率空间结构相似性和时间稳定性,证明了当作物耗水主要来源于灌溉时,变量灌溉管理虽会改变农田内土壤水分空间格局的整体相似性,但每个管理区内的土壤含水率时间稳定性依然存在。研究还发现,每个管理区内代表含水率点位的黏粒含量与对应管理区的平均黏粒含量之间存在的线性关系,可用于土壤性质变异较大的农田中土壤水分传感器埋设位置的预判。
因为湿润土壤中具有时间稳定性的测点在土壤干燥过程中,其稳定性可能消失[17-18],因此在不同的土壤水分状态下,代表平均土壤含水率的点位并不完全相同[19]。Zhang等[20]也发现不同土壤水分条件下的土壤含水率大小在空间上的排序并不相同。因此,寻找不同水分亏缺程度下平均土壤含水率点位的“平均属性”对确定平均土壤含水率点位更具指导意义[21]。
为了充分发挥变量灌溉技术在干旱半干旱地区的节水潜力,将非充分灌溉原理与变量灌溉技术相结合是发展干旱半干旱条件下作物变量灌溉管理的关键[3-4, 22],因此本文基于不同水分亏缺灌溉管理条件下的土壤含水率时间稳定性分析,研究不同湿润程度下土壤含水率空间分布格局的相似性,分析土壤性质和土壤水分亏缺程度对遴选代表含水率点位的影响,并验证非充分灌溉制度下,以管理区内平均土壤黏粒含量作为代表含水率点位的预判方法的可行性,研究结果将为非充分变量灌溉管理条件下土壤水分传感器网络布设方法的制定提供依据。
1 材料与方法
1.1 试验地概况
试验在河北省涿州市东城坊镇进行(39°27¢N,115°51¢E,海拔42 m)。该试验场位于河北省中部,坐落于太行山山洪冲积扇平原上,属暖温带半湿润季风区。多年平均降水量563.3 mm,年平均温度11.6 ℃。土壤质地以壤土和砂壤土为主。
试验区为圆形喷灌机变量灌溉系统[23]控制区域的1/4,面积1.64 hm2。基于土壤可利用水量(available soil water holding capacity, AWC)将试验区划分为4个管理区,1~4区0~0.6 m田间持水量分别为0.21、0.22、0.23和0.25 cm3/cm3;0~1.0 m深度AWC变化范围依次为152~161、>161~171、>171~185、>185~205 mm[24]。因为4区0.4 m以下土层主要为南水北调管道工程回填的砂砾石,本文分析未包含4区。在1~3区,土壤性质沿垂直剖面表现出不同的分层特征,1区0~0.2、>0.2~0.4、>0.4~0.6 m土层土壤砂粒体积分数随深度增加呈明显增加趋势(57.8%~89.5%);2区土壤砂粒和黏粒体积分数随深度变化较小,分别为59.8%~65.8%和4.6%~5.7%;3区>0.2~0.4 m土层存在明显的黏土夹层,该土层砂粒和黏粒体积分数分别为47.9%和8.6%[25]。
1.2 试验设计
3个管理区内,分别按照面积相等的原则设置灌水处理。1区和3区分别划分为4个子区,2区划分为5个子区,每个子区为1个灌水处理。2015—2016年冬小麦生育期内(以下简称2016年冬小麦),设置为雨养和不同灌水下限(为田间持水量百分比)的处理(表1),灌水定额为20 mm。因为每个子区内到达灌水下限的时间不同,所以采用部分喷头开启式变量灌溉方法进行每个子区的灌溉管理[23]。试验结果表明,由于黏土夹层对入渗水流的阻水作用[26],3区0.2~0.4 m土层土壤含水率较低,灌溉次数较多,难以实现基于灌水下限的水分亏缺管理。因此,2016—2017年冬小麦生育期内(以下简称2017年冬小麦),除雨养处理外,各灌水处理灌水量设置为不同灌水定额(为设定灌水定额的百分比)(表1),采用脉冲式变量灌溉方法通过调节电磁阀占空比[23]进行每个子区的灌溉管理。所有子区均采用相同的灌水时间,灌水下限值设计为AWC最小的1区田间持水量的70%。扬花期之前灌水定额设定为20 mm,之后为30 mm。2 a雨养处理除了苗期灌水(20 mm)和施肥期间灌水(20 mm)外,其他时间均不灌溉。
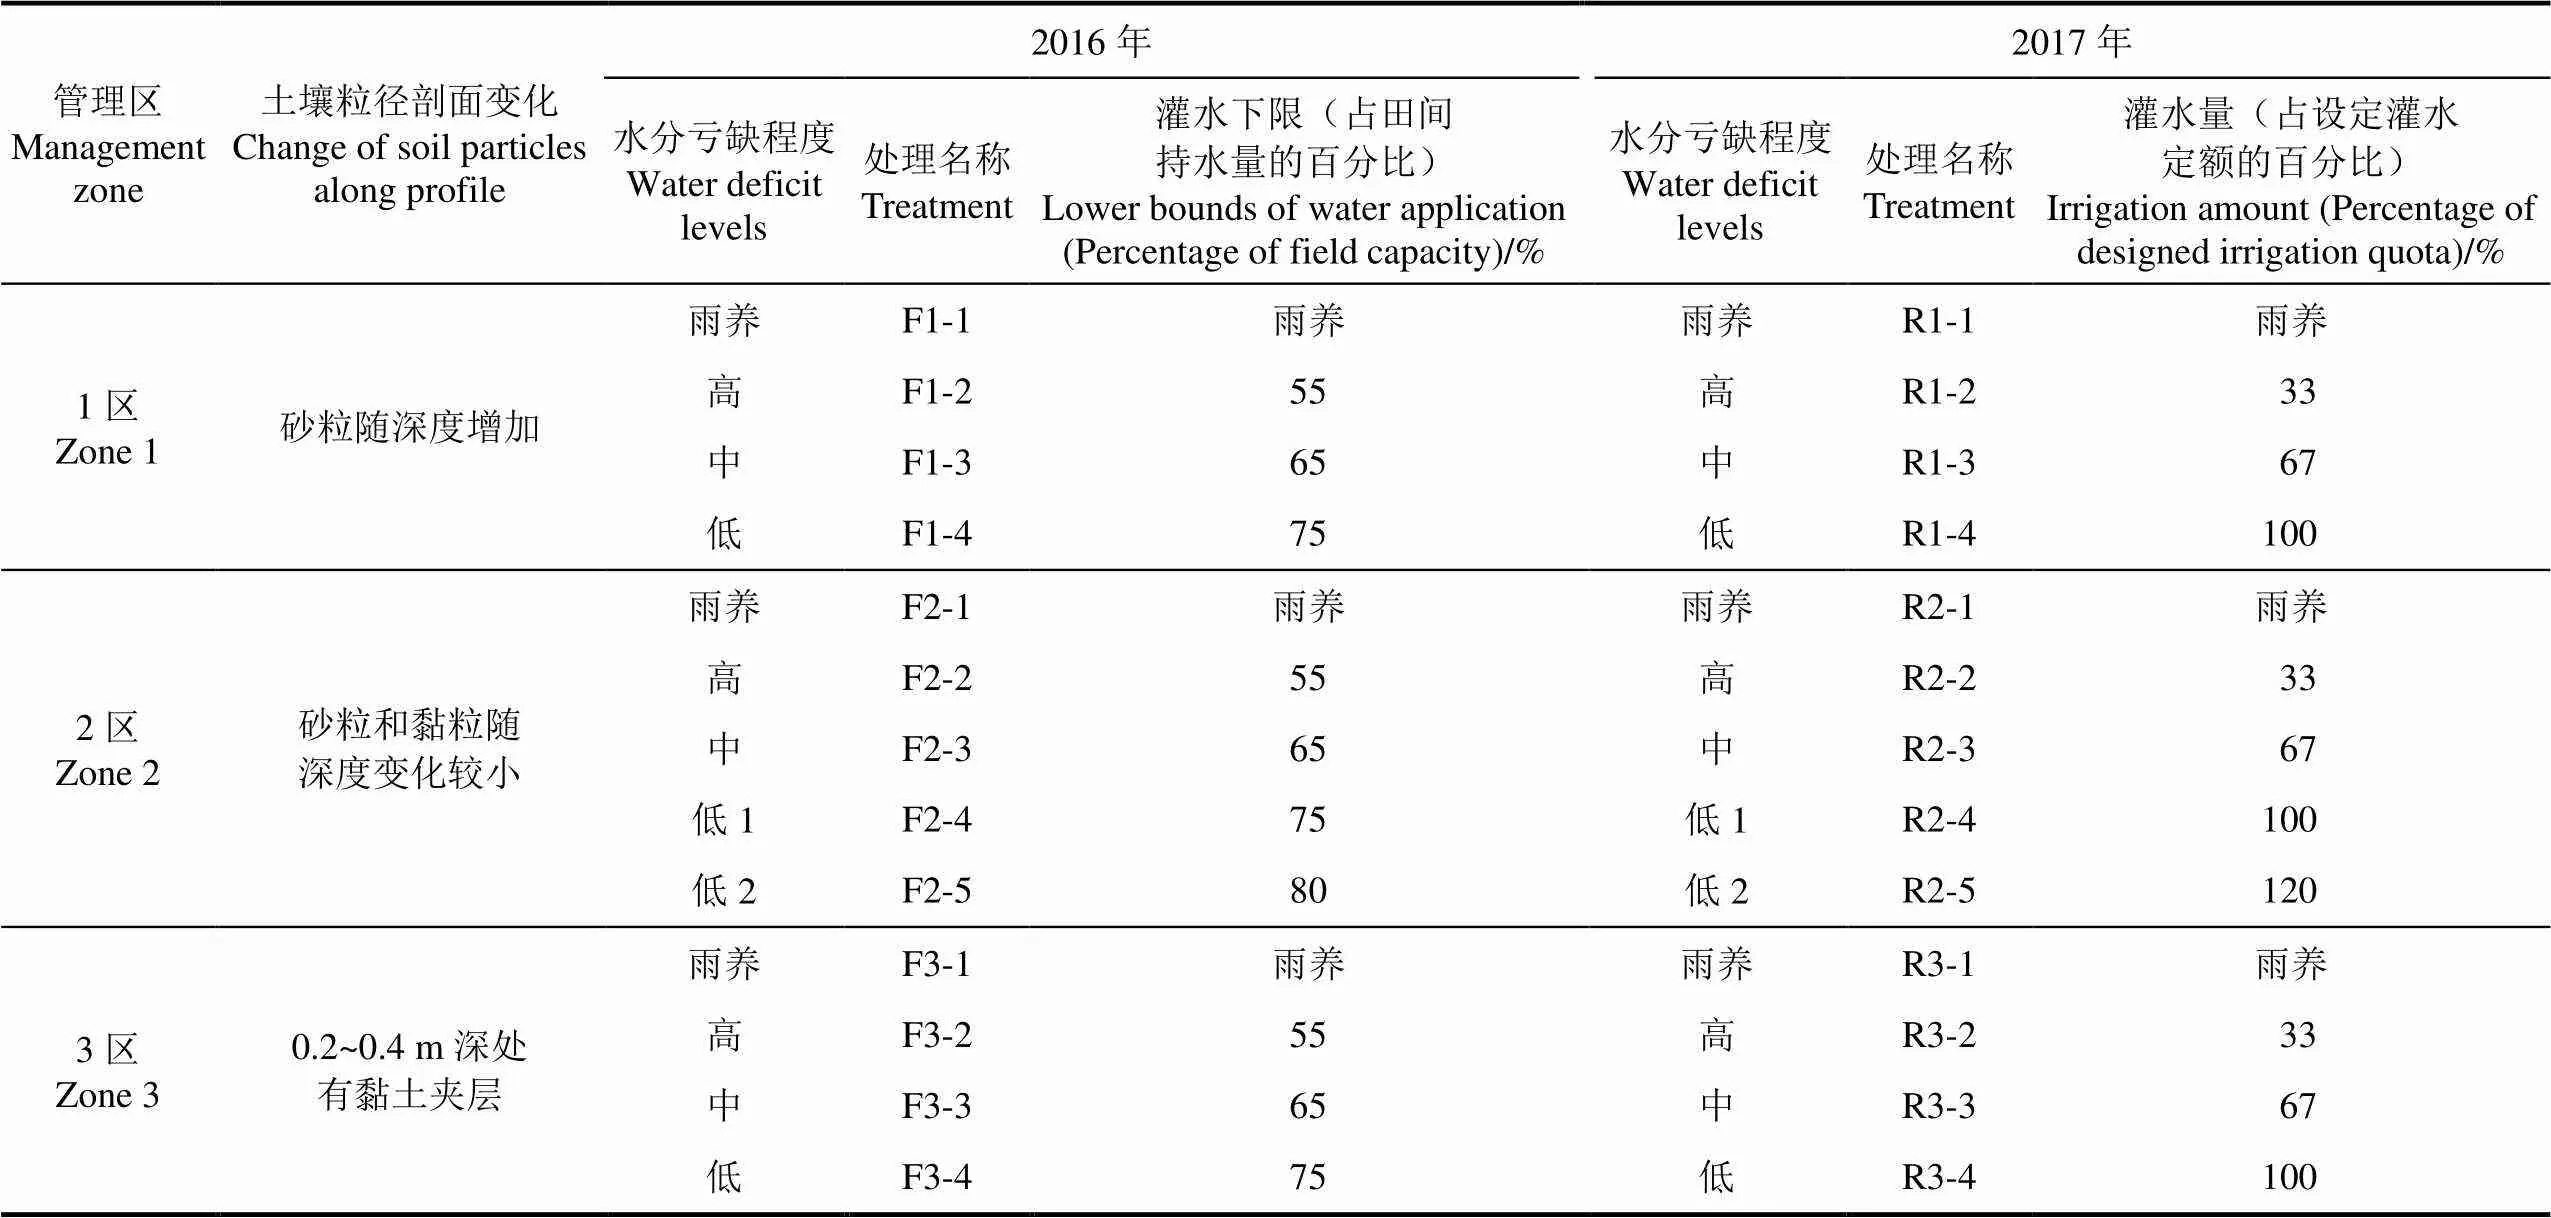
表1 田间试验处理设置
注:水分亏缺程度设置为雨养、高、中和低4个水平。雨养处理仅在苗期和施肥期时进行灌水,其他时间均不灌溉;2区低水分亏缺设置了2个处理,分别记为低1和低2。
Note: A total of 4 water deficit levels include rain-fed, severe, medium, and low deficit levels in each management zone. There is no additional irrigation except for seedling emergence and fertilization stages in rain-fed treatments. In zone 2, 2 low deficit levels (Low 1 and Low 2) are included.
将整个田块划分成12 m×12 m的网格,Trime-T3管式土壤水分探管(IMKO,德国)埋设在每个网格的中心,1区、2区和3区的每个灌水处理内分别布置6个、10个和3个探管,共86个。判断灌水时间时,2016年每日测量所有灌水处理0.2~0.4 m土层的土壤含水率,2017年每日测量R1-4处理0~0.4 m土层的平均土壤含水率,当土壤含水率下降到设定下限时进行灌水。为评估土壤含水率时间稳定性,每7~10 d分层测量1次所有处理的土壤含水率,每0.2 m 1层,测量至1.2 m深度。2016年和2017年冬小麦生育期内分别测量了10次和13次,共23次。因为3区每个子区内布置的测量点数较少(3个),因此在土壤含水率时间稳定性分析时未考虑3区。
1.3 数据分析
根据Spearman秩相关系数(r)原理[6]评价土壤含水率在不同时间的空间分布格局相似性:
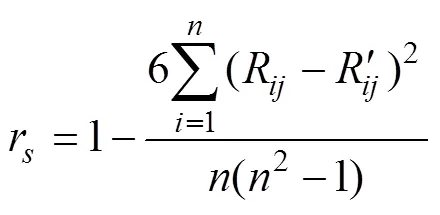
式中R是任一测点在第次观测时土壤含水率测量值的秩,R'为测量值在相同测点、不同观测次数时的秩。r越趋于1表示土壤含水率在2个测量时间下空间分布格局相似性越强。为测点数,1区4个子区测点数量均为6个,2区5个子区测点数量均为10个。
计算每个测点的相对差分值[6],以判断特定测点土壤含水率在时间尺度的稳定性:
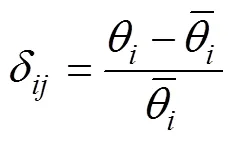

式中为土壤含水率观测次数。2016年和2017年冬小麦生育期内分别监测10次和13次。
为了准确捕捉不同采样时间的土壤含水率均值,并有效地减少系统偏差,应综合考虑均值和方差,因此利用均方根误差(root mean square error,RMSE)确定最佳的测点位置。
RMSEi值最趋于0的测点可设置直接代表平均土壤含水率的传感器。
2 结果与分析
2.1 不同灌溉制度下土壤含水率的空间结构相似性
2 a冬小麦生育期内,不同灌水处理的累积灌水量和降水量如图1所示。2016年和2017年总降水量分别为80.1和80.3 mm,远小于华北地区冬小麦400 mm的平均需水量[27]。由于初始土壤含水率的空间变异性和管理区之间不同的土壤分层特征,2016年不同灌水处理累积灌水量并不总是随灌水下限降低而减少,1区最大累积灌水量(380 mm)发生在F1-3处理,分别比雨养、F1-2和F1-4处理多334、80和40 mm;2区最大累积灌水量发生在F2-5处理(416 mm),分别比雨养、F2-3、F2-2和F2-4处理多370、190、110和60 mm。3区最大累积灌水量发生在F3-3处理(396 mm),分别比雨养、F3-1、F3-2处理多350、16和16 mm。与1区相比,2区(不包括F2-5)累积灌水量减少132 mm。2017年,1区、2区和3区相同处理的累积灌水量相同,雨养处理和3个灌水处理的累积灌水量分别为40、153、263和370 mm;R2-5处理累积灌水量为436 mm。
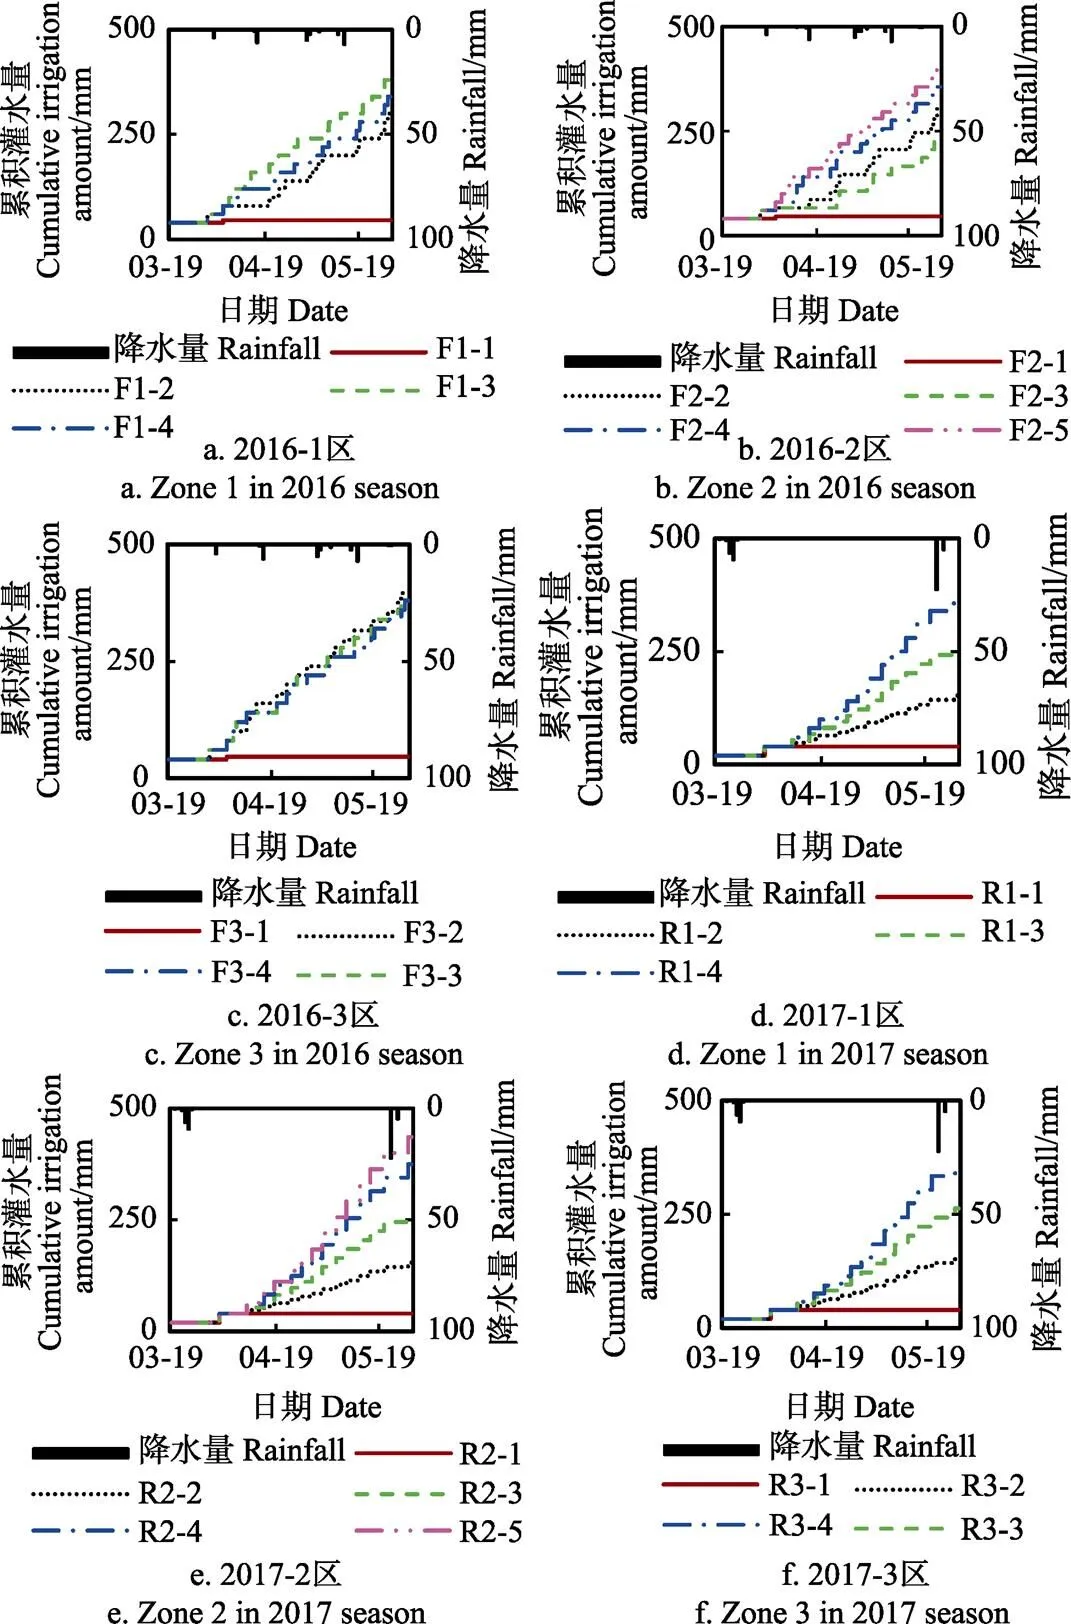
图1 冬小麦生育期内各区灌水量和降水量

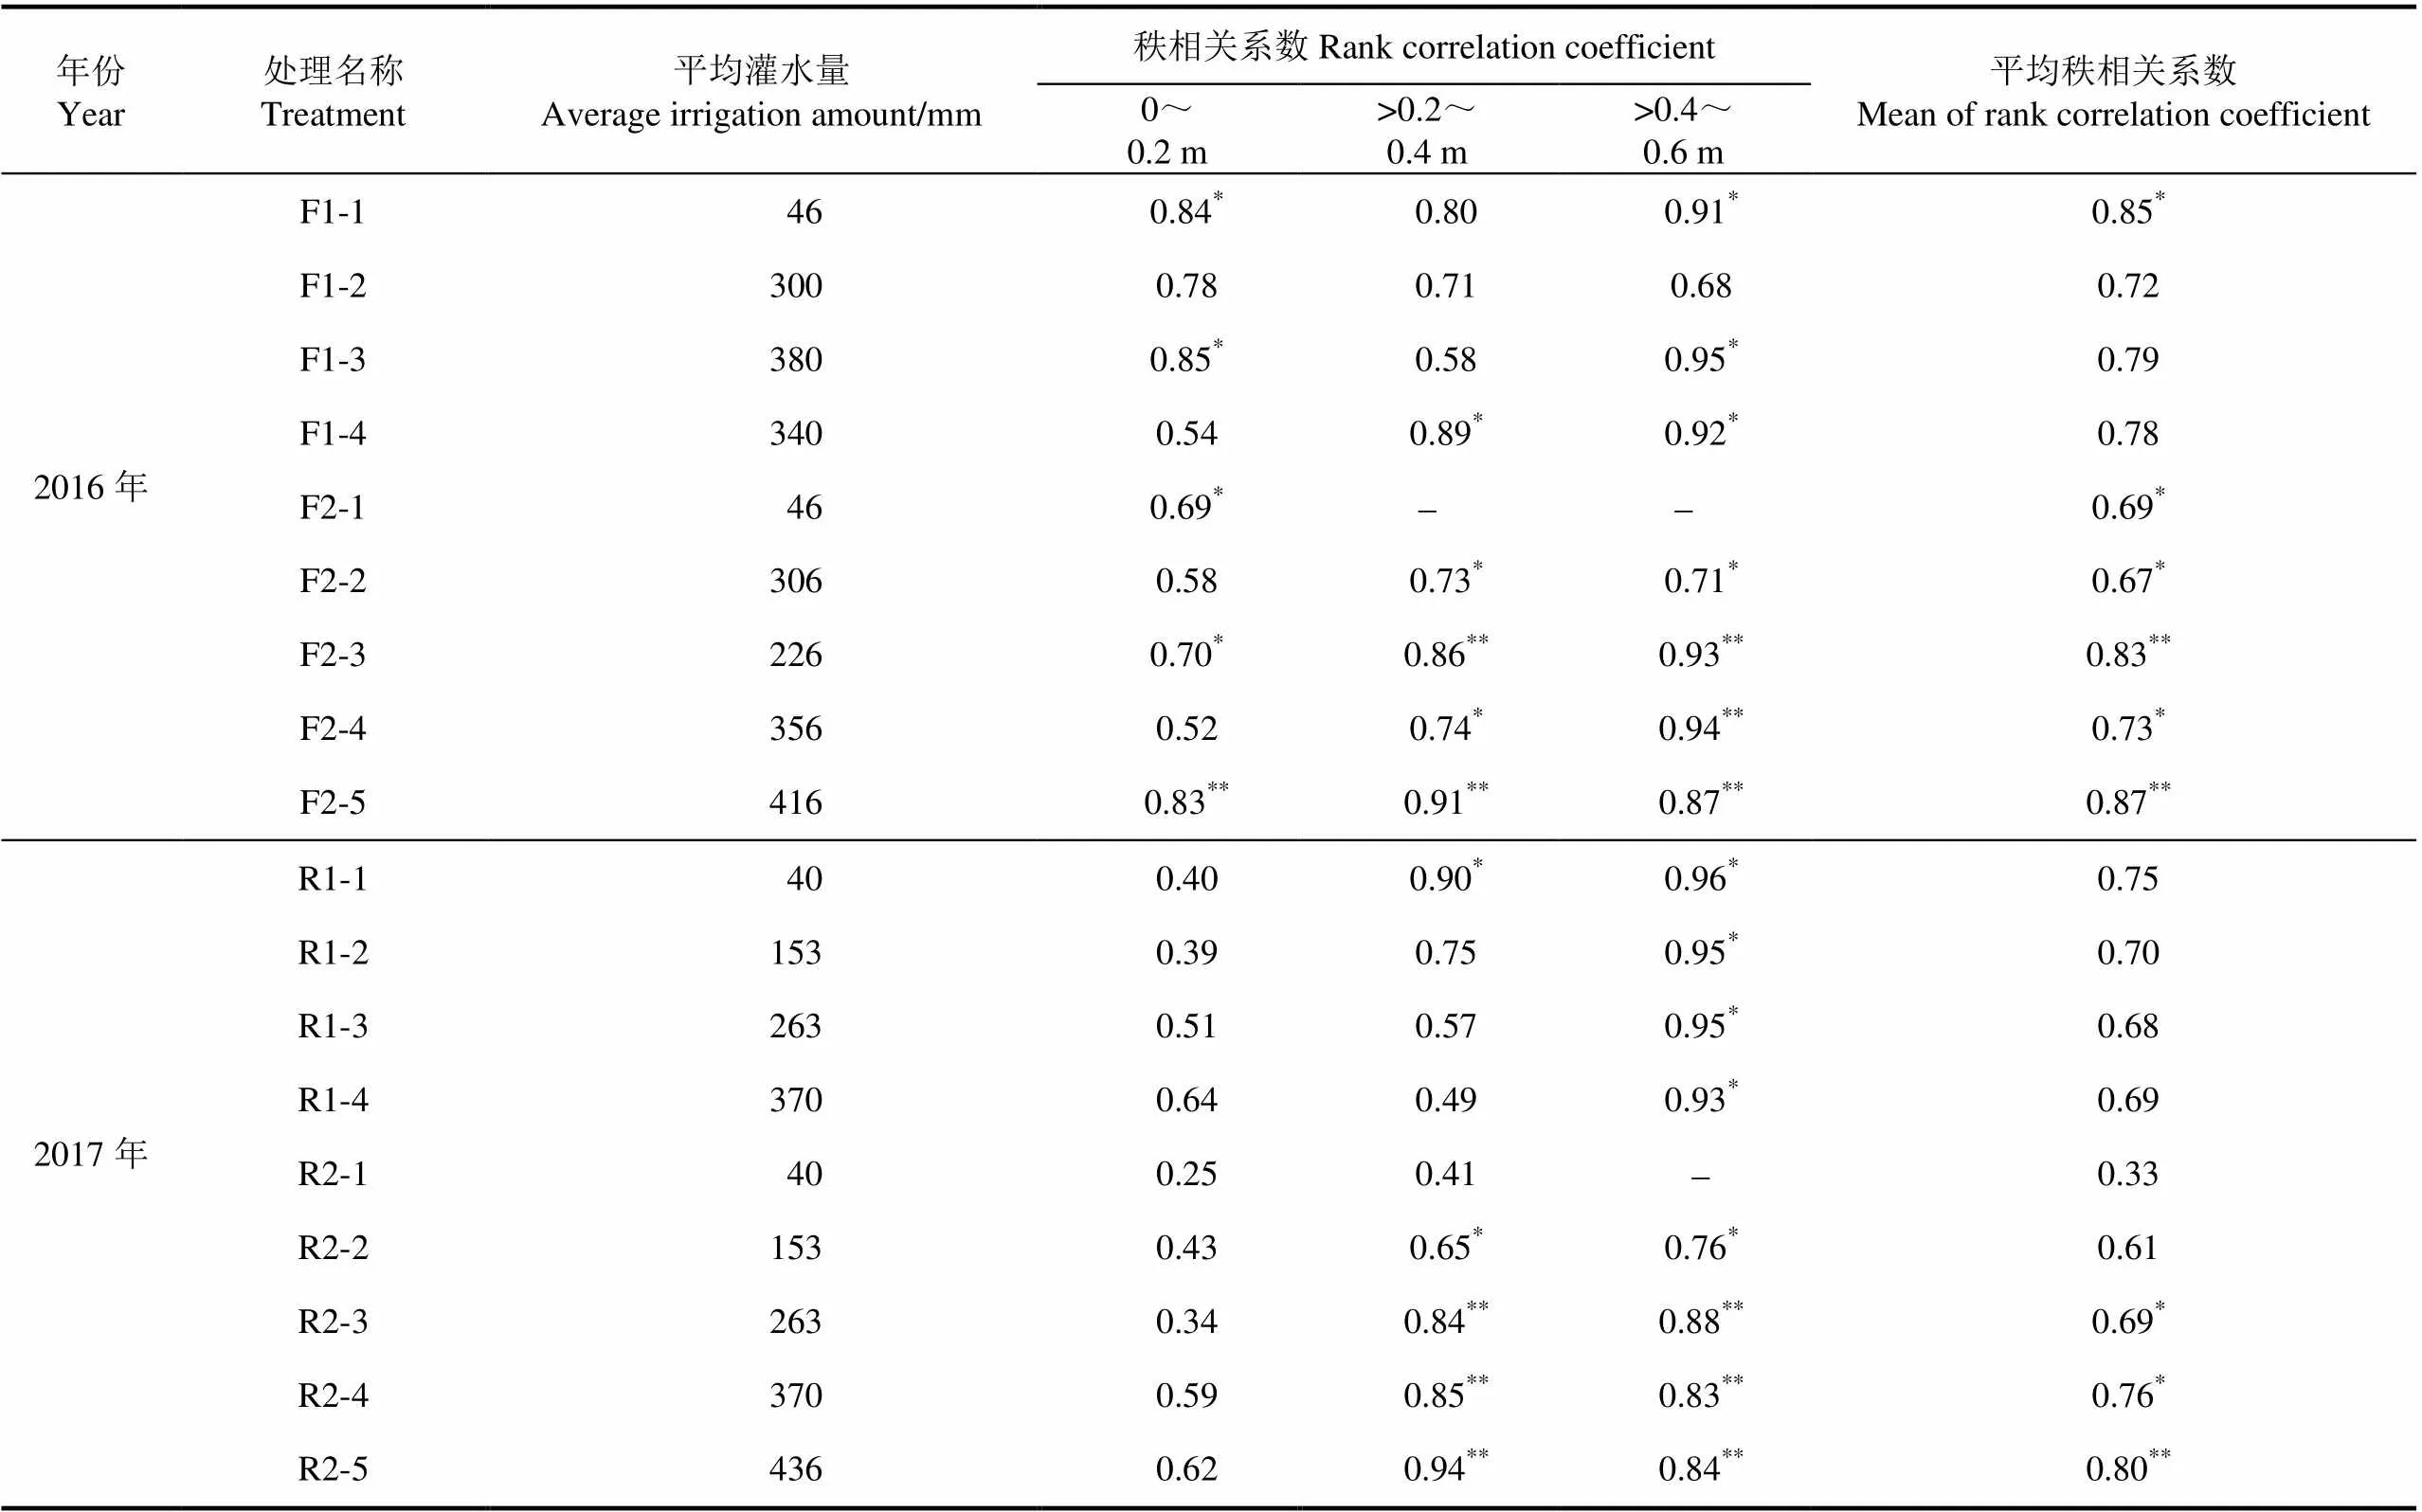
表2 不同水分亏缺处理土壤含水率秩相关系数
注:*和**分别表示在0.05和0.01水平上显著。下同。
Note: Symobol*and**mean significance at probability levels of 0.05 and 0.01, respectively. Same as below.
2.2 不同测点土壤含水率的时间稳定性
每个测点的δ在时间尺度上的标准差σ如图2所示。根据Starks等[29]的划分标准,当σ<0.05时,测点具有时间稳定性。2016年1区所有处理0~0.2、>0.2~0.4和>0.4~0.6 m土层σ<0.05的测点数量占总测点的比例分别为83%,91%和65%;2区所有处理相应土层该比例分别为85%,92%和80%。2017年1区相应土层该比例分别为91%、91%和95%;2区分别为96%、100%和93%。这说明大部分测点都具有较强的时间稳定性,尤其是0~0.4 m土层,且除了2017年的>0.4~0.6 m土层外,2区任一土层具有时间稳定性的测点数量均高于1区。
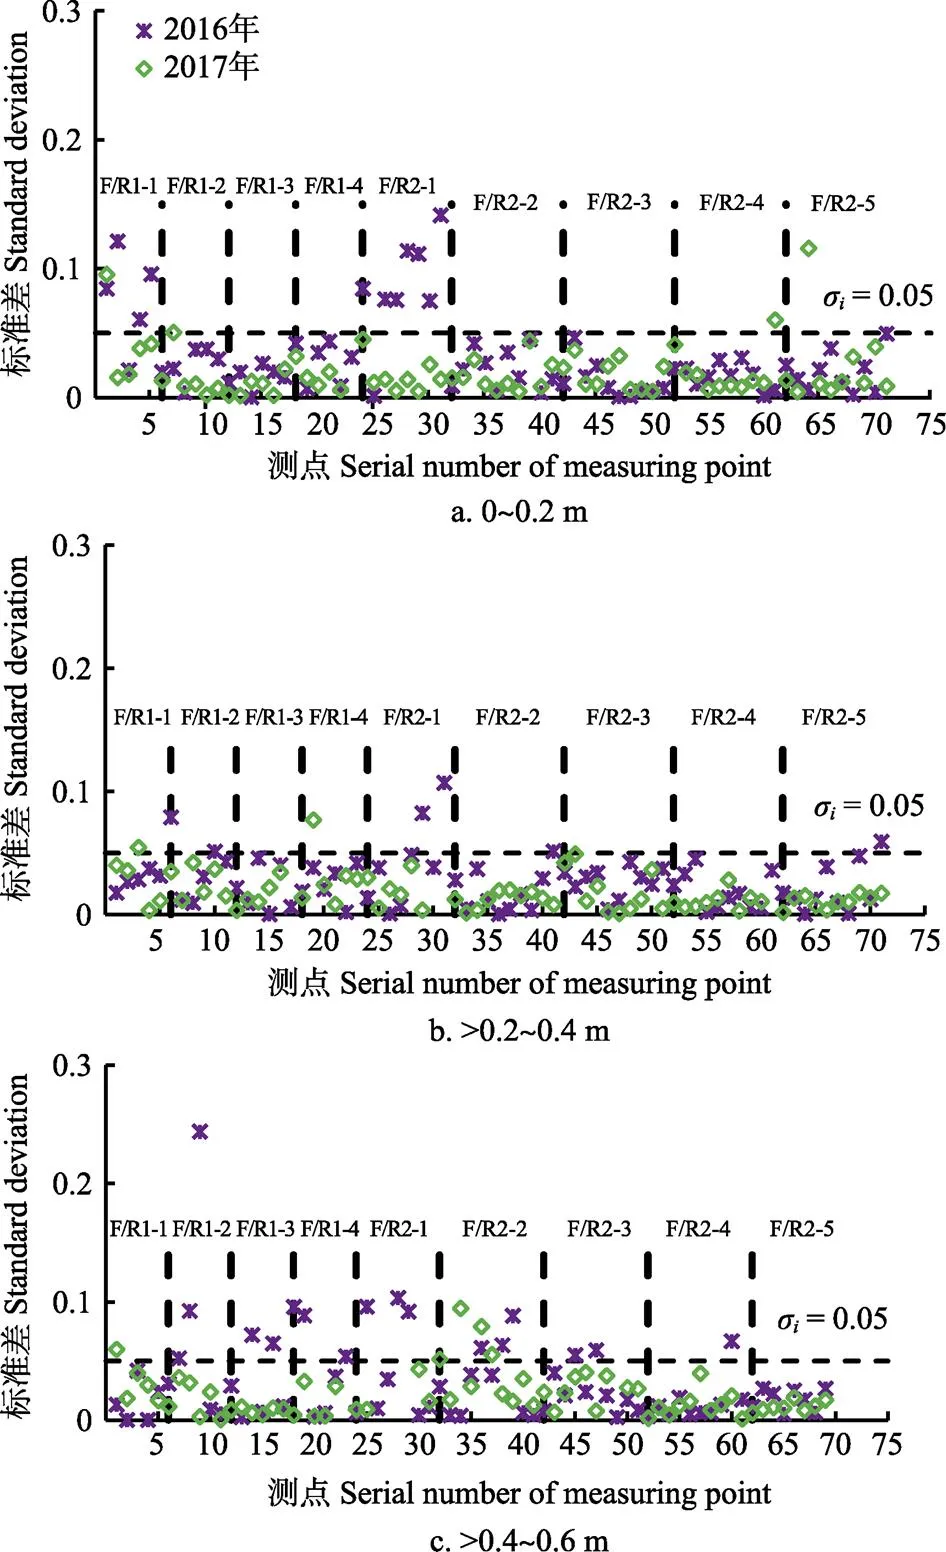
图2 各测点不同土层土壤含水率标准差
每个测点均方根误差RMSE值如图3所示。在任一土层,所有测点的RMSE均在不同土层深度表现出明显的波动,且>0.4~0.6 m土层RMSE波动幅度最大,这表明各测点在剖面方向偏离平均土壤含水率的程度与深度有关,代表平均土壤含水率的测点和深度具有不一致性。2 a同一测点的RMSE值不完全相等,2016年RMSE值整体上大于2017年,但各测点的变化趋势基本保持一致,说明各测点与平均土壤含水率的相对偏离程度具有年际间的时间稳定性。
将RMSE<0.1[30]的点作为代表含水率的点位,代表含水率的测点个数占总测点数的比例如表3所示。代表含水率的测点个数占总测点个数的比例与水分亏缺程度密切相关。2016年1区雨养和高、中、低水分亏缺处理0~0.6 m土层代表含水率的测点数量占总测点数量的比例分别为17%、22%、28%和33%;2区雨养和高、中、低水分亏缺处理0~0.6 m土层代表含水率的测点数量占总测点数量的比例分别为31%、33%、13%和38%(F2-4和F2-5处理均值)。2017年1区相应水分亏缺处理该比例分别为39%、34%、44%和53%;2区则分别为52%、43%、43%和49%(R2-4和R2-5处理均值)。2 a试验,除中水分亏缺处理外,2区任一水分亏缺处理代表含水率的测点比例均高于1区。2016年1区0~0.2、>0.2~0.4和>0.4~0.6 m土层代表含水率的测点比例分别为25%、46%和4%;2区0~0.2、>0.2~0.4和>0.4~0.6 m土层代表含水率的测点比例分别为36%、40%和17%。2017年1区和2区相应土层代表含水率的测点分别为57%、44%、27%和72%、48%、22%,除1区>0.2~0.4 m土层外,该比例明显高于2016年。这与2 a水分管理方法一致时,代表含水率的测点个数占总测点个数的比例在年际间变化较小[23]的规律不同。另外,2 a试验1区和2区0~0.2、>0.2~0.4、>0.4~0.6 m土层代表含水率的测点比例平均值分别为41%、45%、16%和54%、44%、19%,具有不同土壤剖面特征的管理区同一土层代表含水率的测点比例差别较小的结果表明,代表含水率的测点个数占总测点个数的比例受土壤剖面的分层特征影响相对较小。
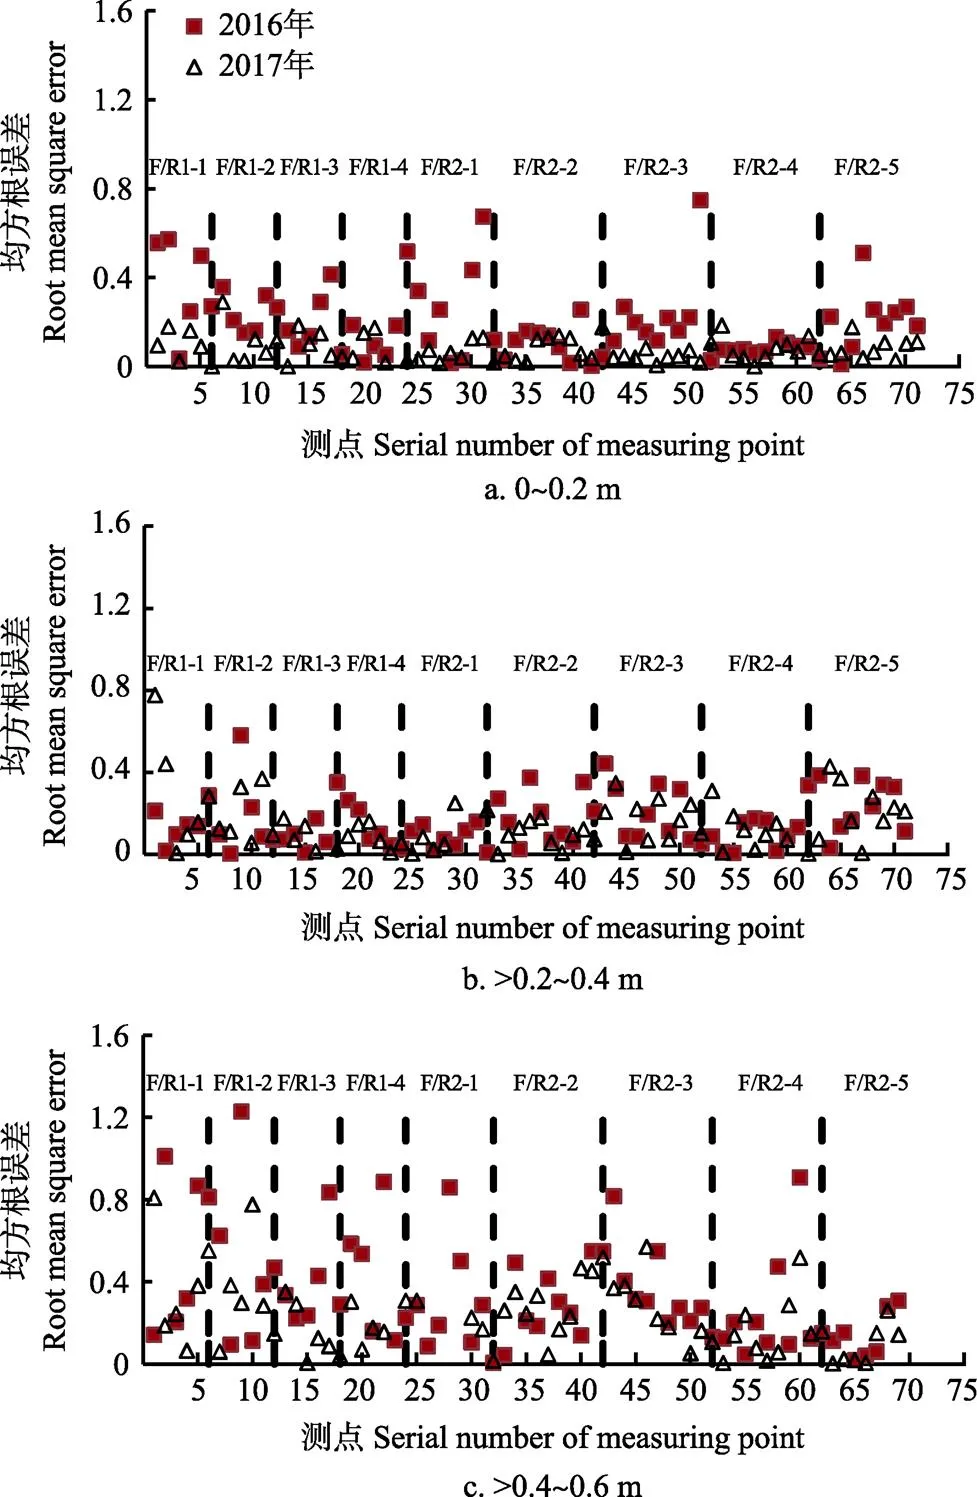
图3 各测点土壤含水率均方根误差
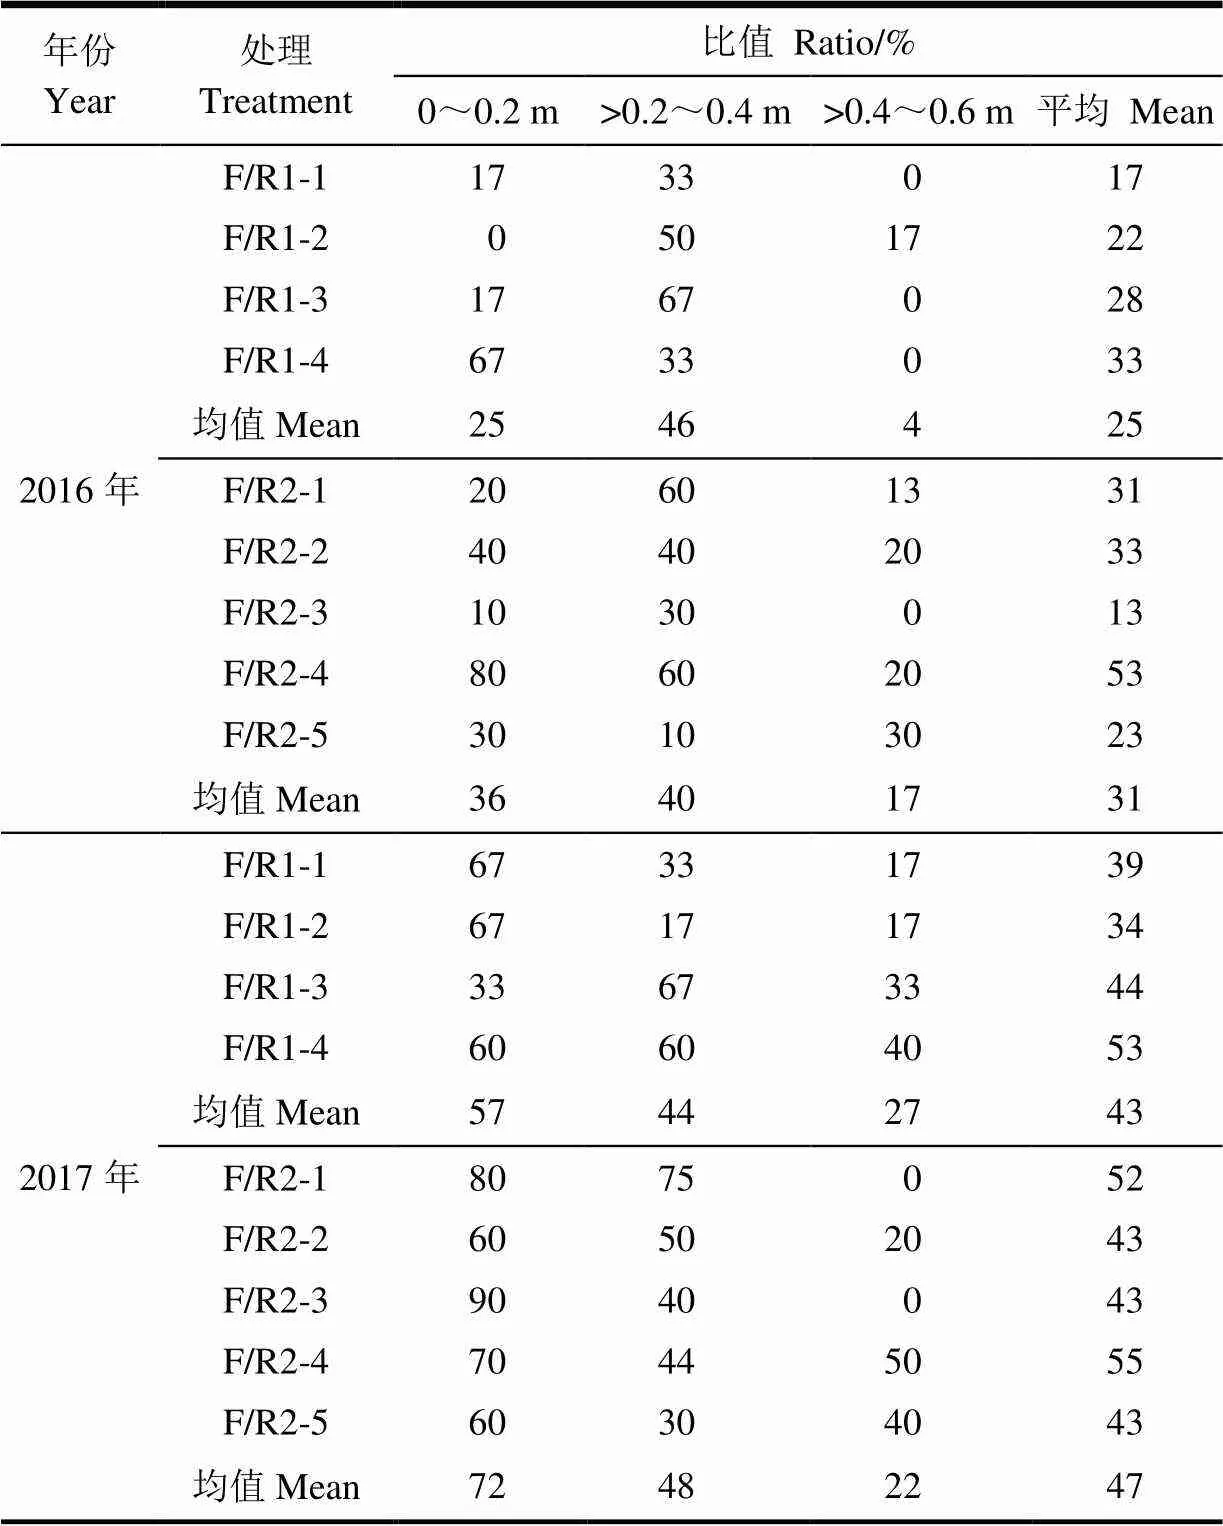
表3 不同土层代表含水率的测点与总测点数的比值
2.3 代表平均土壤含水率点位的确定方法
为研究土壤水分亏缺程度对代表含水率点位“平均属性”的影响,分别将所有管理区雨养和高、中、低水分亏缺处理内不同土层RMSE<0.1的测量点的平均黏粒含量作为自变量,将对应土层内代表含水率点位的黏粒含量当作因变量,对二者进行线性拟合(=,为拟合系数),结果如表4所示。
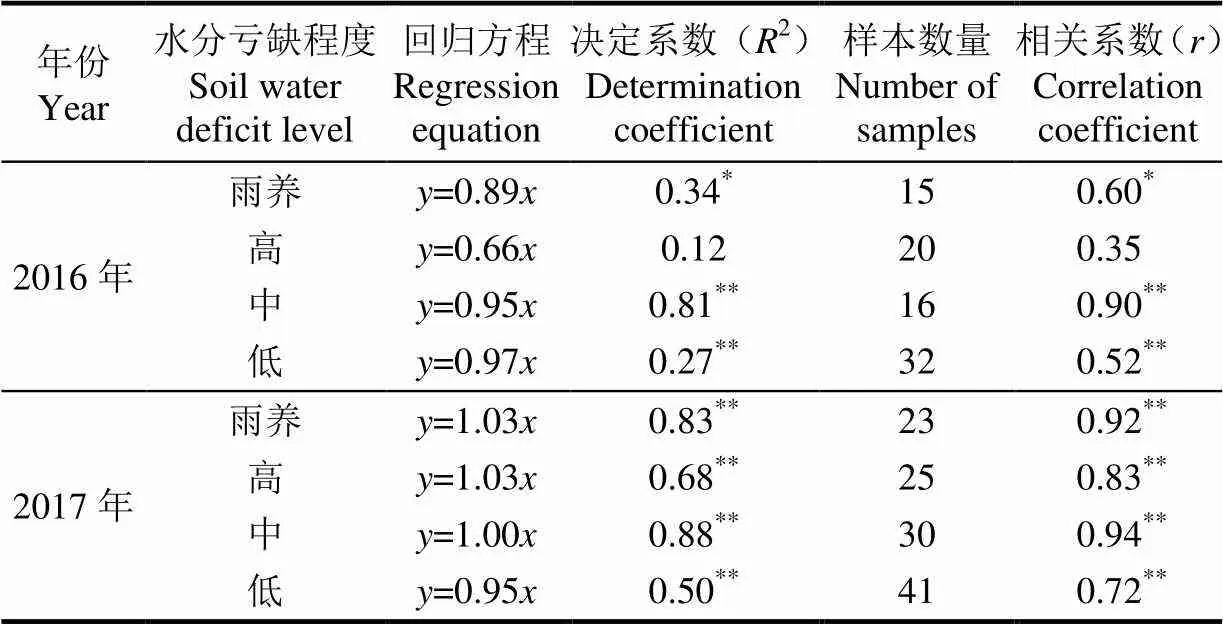
表4 0~0.6 m土层含水率代表测点的黏粒体积分数(y)与管理区平均黏粒体积分数(x)的拟合关系
注 Note:*,<0.05;**,<0.01。
2016年雨养、中、低水分亏缺处理和2017年所有水分亏缺处理和之间均呈显著的线性关系,2016年雨养和高水分亏缺处理值低于中、低水分亏缺处理,2017年值随土壤水分亏缺程度增加呈增大趋势。值随水分亏缺程度的变化趋势在年际间存在差异,这主要是因为土壤分层特征的影响使得2016年各处理灌水量并未随灌水下限的降低而减少(图1)。2 a拟合系数的变化范围为0.66~1.03,小于前期在该地块不同管理区灌水下限均设置为0.45 AWC时得出的值(1.15)[11],这再次表明代表含水率的点位主要受土壤黏粒含量的影响,但与土壤黏粒含量的值在2017年随土壤水分亏缺程度增加呈增大趋势。
3 结 论
在华北平原土壤可利用水量变异较大的地块,分别基于雨养和3种非充分灌溉制度开展了为期2 a的冬小麦变量灌溉试验,利用冬小麦生育期内布设的86个测点,共23次观测值,分析了水分亏缺程度和土壤质地对土壤含水率空间分布时间稳定性的影响。主要结论如下:
1)受水分亏缺程度和土壤剖面分层特征的影响,在砂粒含量随土层深度增加的1区,0~0.6 m土层的平均土壤含水率空间分布格局相似性随土壤水分亏缺程度减小呈先减小后增加趋势,且相似性仅在2016年的雨养处理达到了显著水平。在沿垂直剖面方向砂粒含量分布均匀的2区,0~0.6 m土层平均土壤含水率空间分布格局相似性虽然随水分亏缺程度减小呈增加趋势,但2016年所有处理和2017年中、低水分亏缺处理相似性均达到了显著水平。
2)受水分亏缺程度的影响,2 a试验不同土层代表含水率的测点数量占总测点的比例差异较大。但受土壤剖面分层特征的影响较小,1区和2区同一土层代表含水率的测点比例平均值并无明显差别,0~0.2、>0.2~0.4、>0.4~0.6 m土层该值分别为41%、45%、16%和54%、44%、19%。
3)2 a试验中,除2016年高水分亏缺处理外,其他所有处理0~0.2、>0.2~0.4、>0.4~0.6 m土层所有测量点的平均黏粒含量与对应土层内代表含水率点位的黏粒含量之间均存在显著的线性关系(<0.05),线性方程拟合系数为0.66~1.03,且2017年随土壤水分亏缺程度增加呈增大趋势。
[1] Howell T A, Evett S R, O'Shaughnessy S A, et al. Advanced irrigation engineering: Precision and precise[J]. Journal of Agricultural Science and Technology, 2012, 29(1): 1-9.
[2] O’Shaughnessy S A, Evett S R, Colaizzi P D. Dynamic prescription maps for site-specific variable rate irrigation of cotton[J]. Agricultural Water Management, 2015, 159: 123-138.
[3] O'Shaughness S A, Rush C. Encyclopedia of Agriculture and Food Systems[M]. New York: Academic Press, 2014.
[4] Evans R G, LaRue J, Stone K C, et al. Adoption of site-specific variable rate sprinkler irrigation systems[J]. Irrigation Science, 2013, 31(4): 871-887.
[5] Sui Ruixiu, Baggard J. Wireless sensor network for monitoring soil moisture and weather conditions[J]. Applied Engineering in Agriculture, 2015, 31(2): 193-200.
[6] Vachaud G, Passerat D S A, Balabanis P, et al. Temporal stability of spatially measured soil water probability density function[J]. Soil Science Society of American Journal, 1985, 49(4): 822-828.
[7] Mohanty B P, Skaggs T H. Spatio-temporal evolution and time-stable characteristics of soil moisture within remote sensing footprints with varying soil, slope, and vegetation[J]. Advances in Water Resources, 2001, 24(9): 1051-1067.
[8] Western A W, Zhou S L, Grayson R B, et al. Spatial correlation of soil moisture in small catchments and its relationship to dominant spatial hydrological processes[J]. Journal of Hydrology, 2004, 286(1): 113-134.
[9] Ran Youhua, Li Xin, Jin Rui, et al. Strengths and weaknesses of temporal stability analysis for monitoring and estimating grid-mean soil moisture in a high-intensity irrigated agricultural landscape[J]. Water Resources Research, 2017, 53(1): 283-301.
[10] Hu Wei, Shao Mingan, Han Fengpeng, et al. Watershed scale temporal stability of soil water content[J]. Geoderma, 2010, 158(3): 181-198.
[11] 胡伟. 黄土高原小流域土壤含水量与饱和导水率的时空变异[D]. 北京: 中国科学院研究生院, 2009.
Hu Wei. The Mean Clay Percentile was Used for a Priori Identification for Pplacement of Soil Moisture Sensors[D]. Beijing: Graduate University of Chinese Academy of Sciences, 2009.
[12] Jacobs J M, Mohanty B P, Hsu E C, et al. SMEX02: Field scale variability, time stability and similarity of soil moisture [J]. Remote sensing of Environment, 2004, 92(4): 436-446.
[13] Go'mez-Plaza A, Alvarez-Rogel J, Albaladejo J, et al. Spatial patterns and temporal stability of soil moisture across a range of scales in a semi-arid environment[J]. Hydrological Processes, 2000, 14(7): 1261-1277.
[14] Li B, Rodell M. Spatial variability and its scale dependency of observed and modeled soil moisture over different climate regions[J]. Hydrology Earth System Sciences, 2013, 17(3): 1177-1188.
[15] López-Vicente M, Álvarez S. Stability and patterns of topsoil water content in rainfed vineyards, olive groves, and cereal fields under different soil and tillage conditions[J]. Agricultural Water Management, 2018, 201: 167-176.
[16] Zhao Weixia, Li Jiusheng, Yang Rumiao, et al. Determinging placement criteria of moisture sensors through temporal stability analysis of soil water contents for a variable rate irrigation system[J]. Precision Agriculture, 2018, 19(4): 648-665.
[17] Schneider K, Huisman J A, Breuer L, et al. Temporal stability of soil moisture in various semi-arid steppe ecosystems and its application in remote sensing[J]. Journal of Hydrology, 2008, 359(1): 16-29.
[18] Zhao Long, Yang Kun, Qin Jun, et al. Spatio temporal analysis of soil moisture observations within a Tibetan mesoscale area and its implication to regional soil moisture measurements[J]. Journal of Hydrology, 2013, 482(5): 92-104.
[19] Gao Lei, Shao Mingan. Temporal stability of soil water storage in diverse soil layers[J]. Catena, 2012, 95(95): 24-32.
[20] Zhang Pingping, Shao Mingan, Zhang Xingchang. Temporal stability of soil moisture on two transects in a desert area of northwestern China[J]. Environmental Earth Sciences, 2016, 75(2): 161-175.
[21] Grayson R B, Western A W. Towards areal estimation of soil water content from point measurements: Time and space stability of mean response[J]. Journal of Hydrology, 1998, 207(1): 68-82.
[22] Evans R G, Sadler E J. Methods and technologies to improve efficiency of water use[J]. Water Resources Research, 2008, 44(7): 1-15.
[23] 赵伟霞, 李久生, 杨汝苗, 等. 田间试验评估圆形喷灌机变量灌溉系统水量分布特性[J]. 农业工程学报, 2014, 30(22): 53-62. Zhao Weixia, Li Jiusheng, Yang Rumiao, et al. Field evaluation of water distribution characteristics center pivot irrigation system[J]. Transactions of the Chinese Society of Agricultural Engineering (Transactions of the CSAE), 2014, 30(22): 53-62. (in Chinese with English abstract)
[24] 赵伟霞, 李久生, 杨汝苗, 等. 基于土壤水分空间变异的变量灌溉作物产量及节水效果[J]. 农业工程学报, 2017, 33(2): 1-7. Zhao Weixia, Li Jiusheng, Yang Rumiao, et al. Yields and water-saving effects of crops as affected by variable rate irrigation management based on soil water spatial variation[J]. Transactions of the Chinese Society of Agricultural Engineering (Transactions of the CSAE), 2017, 33(2): 1-7. (in Chinese with English abstract)
[25] Zhao Weixia, Li Jiusheng, Yang Rumiao, et al. Crop yield and water productivity responses in management zones for variable-rate irrigation based on available soil water holding capacity[J].Transactions of the ASABE, 2017, 60(5): 1659-1667.
[26] 李久生, 杨风艳, 栗岩峰. 层状土壤质地对地下滴灌水氮分布的影响[J]. 农业工程学报, 2009, 25(7): 25-31. Li Jiusheng, Yang Fengyan, Li Yanfeng. Water and nitrogen distribution under subsurface drip fertigation as affected by layered-textural soils[J]. Transactions of the Chinese Society of Agricultural Engineering (Transactions of the CSAE), 2009, 25(7): 25-31. (in Chinese with English abstract)
[27] 胡玮, 严昌荣, 李迎春, 等. 冀京津冬小麦灌溉需水量时空变化特征[J]. 中国农业气象, 2013, 34(6): 648-654. Hu Wei, Yan Changrong, Li Yingchun, et al. Spatial and temporal variation of irrigation water requirement for winter wheat in Jijingjin region[J]. Chinese Journal of Agrometeorology, 2013, 34(6): 648-654. (in Chinese with English abstract)
[28] Van W B, Mulligan M, Poesen J. Spatial patterns of soil water balance on intensively cultivated hillslopes in a semiaridenvironment: The impact of rock fragments and soil thickness[J]. Hydrological Process, 2000, 14(10): 1811-1828.
[29] Starks P J, Heathman G C, Jackson T J, et al. Temporal stability of soil moisture profile[J]. Journal of Hydrology, 2006, 324(1): 400-411.
[30] Dettori M, Cesaraccio C, Motroni A, et al. Using CERES- Wheat to simulate durum wheat production and phenology in Southern Sardinia, Italy[J]. Field Crops Research, 2011, 120(1): 179-188.
Influence of water stress level on determination of soil moisture sensor position under variable rate irrigation
Li Xiumei, Zhao Weixia, Li Jiusheng※, Li Yanfeng
(100048,)
Determining positions to represent mean soil water content based on soil clay contents is an alternative method for positioning soil water content sensors in wireless sensor networks for a variable rate irrigation system. The field was divided into 4 management zones according to available soil water holding capacity (AWC). Two of the 4 management zones were selected to arrange the rain-fed treatment and 3 irrigation treatments representing different water stress levels to assess the effect of the levels on the placement of soil water content sensors under variable rate irrigation system. In zone 1, sand fraction largely increased with depth with AWC within 1-m soil profile ranging from 152 to 161 mm. In zone 2, a relatively uniform profile was observed along the profile with AWC within 1-m soil profile ranging from 161 to 171 mm. Based on the temporal stability of soil water content, the effects of soil water status and soil properties on the similarity of soil water spatial pattern and the positions directly representing the plot-mean soil water content were studied. Results showed that both of soil texture and water stress had effect on the structure similarity of soil water content distribution. In zone 1, the average Spearman’s rank correlation coefficient of 0-0.6 m was significant at the probability level of 0.05 only in the rain-fed treatment in the 2016 season. In zone 2, the Spearman’s rank correlation coefficient was significant at the probability level of 0.05 in all treatments in the 2016 season and in the medium and low water stress treatments in the 2017 season. The percentages of positions directly representing the mean soil water content were almost the same in zones 1 and 2. Affected by soil water status, the percentages increased as the level of soil water stress decreased in zone 1. While in zone 2, as the severity of water stress decreased, the percentages decreased and then had a slight increase. In general, significant linear regressions (0.05) between the mean clay content and the clay content representing the mean soil water content sites were found in layers 0-0.2, 0.2-0.4, and 0.4-0.6 m for all the treatments in 2016 and 2017, except for that in the severe water stress treatment in 2016. The fitted equation coefficients ranged from 0.66 to 1.03 in the 2 seasons, demonstrating a clearly increasing trend as the severity of water stress increased in 2017. When the mean clay content was used for a priori identification for positioning soil water content sensors in the management zones under variable rate irrigation system in a field with sandy loam soil, the strategies of water stress management should be considered in determining a fitted equation coefficients.
soils; water content; sensors; networks; time stability; placement; winter wheat; variable rate irrigation
李秀梅,赵伟霞,李久生,栗岩峰. 水分亏缺程度对变量灌溉水分传感器埋设位置预判的影响[J]. 农业工程学报,2018,34(23):94-100.doi:10.11975/j.issn.1002-6819.2018.23.011 http://www.tcsae.org
Li Xiumei, Zhao Weixia, Li Jiusheng, Li Yanfeng. Influence of water stress level on determination of soil moisture sensor position under variable rate irrigation[J]. Transactions of the Chinese Society of Agricultural Engineering (Transactions of the CSAE), 2018, 34(23): 94-100. (in Chinese with English abstract) doi:10.11975/j.issn.1002-6819.2018.23.011 http://www.tcsae.org
2018-06-24
2018-08-10
“十三五”国家重点研发计划(2016YFC0400104);中国水科院科研专项(2016TS05)共同资助
李秀梅,河北邯郸人,博士生,主要从事灌溉原理与技术方面的研究。Email:lixiumei11126@126.com
李久生,河北邢台人,研究员,博士生导师,主要从事灌溉原理与技术方面的研究。Email:lijs@iwhr.com
10.11975/j.issn.1002-6819.2018.23.011
S274.3
A
1002-6819(2018)-23-0094-07
猜你喜欢
建材发展导向(2022年10期)2022-07-28
水科学与工程技术(2021年4期)2021-09-07
科学技术与工程(2021年17期)2021-07-20
今日农业(2020年20期)2020-12-15
今日农业(2020年23期)2020-12-15
当代陕西(2020年24期)2020-02-01
当代陕西(2020年24期)2020-02-01
当代陕西(2020年24期)2020-02-01
中华建设(2019年12期)2019-12-31
煤田地质与勘探(2019年3期)2019-07-02