
Hydrochemistry of the meltwater streams on Fildes Peninsula,King George Island, Antarctica*
2018-12-22 07:00YELiping叶利萍ZHANGRuifeng张瑞峰SUNQizhen孙启振JINJie金杰ZHANGJing张经
YE Liping (叶利萍), ZHANG Ruifeng (张瑞峰) , , SUN Qizhen (孙启振),JIN Jie (金杰), ZHANG Jing (张经)
1 State Key Laboratory of Estuarine and Coastal Research, East China Normal University, Shanghai 200062, China
2 Institute of Oceanography, Shanghai Jiao Tong University, Shanghai 200030, China
3 Department of Polar Research and Forecast, National Marine Environmental Forecasting Center, Beijing 100081, China
Abstract King George Island, situated in the South Shetland Islands archipelago, is one of the most visited sites in Antarctica. Antarctica attracts much attention because it is one of the most sensitive areas under the influence of global warming. To understand its hydrochemistry characteristics, we collected various types of water samples, including samples from streams, meltwaters, ground waters, snow and ice from around the Great Wall Station, Fildes Peninsula, King George Island, from January to February, 2015. Major ions,alkalinities, silicate, pH, dissolved oxygen, temperature, and electric conductivities were measured. Several approaches were applied to identify processes that affect the hydrochemistry on Fildes Peninsula, including ternary diagrams, principal components analysis and cluster analysis. Our data suggest that atmospheric seasalt deposition is the main factor controlling the hydrochemistry on Fildes Peninsula. After atmospheric influences were corrected for seasalt, we defined the weathering of local rocks to be another important factor on the Peninsula’s hydrochemistry. Processes such as Ca dissolution from the Ca-bearing basalt, Si loss through secondary mineralization and biological uptake influence the chemical composition of runoffs on the peninsula. Cluster analysis identified 4 groups of streams based on their hydrochemical features, which reflect their original weathering characters under icecap and the combined effects with melt snow, biological activity and the anthropogenic input.
Keyword: hydrochemistry; runoffs; seasalt; water-rock interaction; Fildes Peninsula; Antarctica
1 INTRODUCTION
The Intergovernmental Panel on Climate Change(IPCC) reported that mean global warming was 0.6±0.2°C during the 20thcentury (Vaughan et al.,2003). The Antarctic Peninsula has experienced some of the most rapid air temperature increases on Earth:2°C over the past 40–50 years (Quayle et al., 2002).As a result, accelerated glacier melting runoff and iceberg calving have occurred (Cook et al., 2005).These processes deliver more dissolved and particulate terrestrial materials to the adjacent seas. It may have significant ecological and geochemical impacts, thus affecting the carbon cycle and then feedback to global climate (Gerringa et al., 2012; Bhatia et al., 2013).
The hydrochemistry of glacier meltwater is a key parameter to understanding the feedback mechanism of glacier melting and evaluating its influence on the environment. Based on the characteristics and variation of meltwater hydrochemistry, we can infer the impact of climate change, chemical weathering,and the circulation among terrain-river-ocean system(Hu et al., 1982; Meybeck, 1987; Gaillardet et al.,1999; Ingri et al., 2005; Dong et al., 2017). In high latitude regions, ice caps and glaciers are the main land cover. Many studies on the hydrochemistry of glacial meltwater and its contribution to the surroundings have been conducted (Wadham et al.,1998; Borghini and Bargagli, 2004; Rückamp et al.,2011; Stumpf et al., 2012; Graly et al., 2014; Lim et al., 2014; Nowak and Hodson, 2014). Glacial meltwater features depend on glacier type and location(Fegel et al., 2016), and the melt snow and ice can perturb the glaciochemical record beyond the natural variability (Wong et al., 2013). It had been suggested that meltwater discharge and rock types are the principal driving factors contributing to chemical denudation; thus, researchers could investigate the chemical denudation and further estimate the rate of temporary CO2drawdown (Sharp et al., 1995; Tranter,1996; Hodson et al., 2000; Wadham et al., 2010;Graly et al., 2017; Torres et al., 2017). Bioavailable trace metals (e.g. Fe) delivered by meltwater are able to stimulate primary production, and thus lead to CO2drawdown (Raiswell et al., 2008).
King George Island (KGI) is the largest island of the South Shetland, lying approximately 120 km north of the Antarctic Peninsula. Glaciers occupy 92% of King George Island (Leal et al., 2008). KGI covered with several connected icecaps. Collins Ice Cap is the most western icecap on KGI which directly connected with Arctowski Icefield (Rückamp et al.,2010). Small streams and lakes near icecap feed by glacial or snow meltwater are present in ice-free areas of the Antarctic during summer. A recent study has shown that the air temperature in KGI increased by 1.2°C from the year of 1948 to 2011 (Kejna et al.,2013). Consequently, the estimated ice volume loss on KGI was approximately 20 km3(~1.6% area of the island loss), from 2000 to 2008 (Rückamp et al.,2011). The seas adjacent to the Antarctic Peninsula(e.g., Drake Passage and southern Scotia Sea) host a number of biogeochemical hot spots that support primary and secondary productions (Zhou et al.,2013). Investigating the geochemical composition of runoffs and glacier meltwater on KGI is important in evaluating the role they play after draining into the adjacent seas.
Fildes Peninsula (FP) locates next to the Collins Ice Cap, is one of the largest ice free areas on KGI,and dominated by periglacial, glacial, fluvial, and coastal processes and landforms (Schmid et al., 2017).FP was originally a component part of volcanic island,and the main rock type on FP is basalt (Liu and Zheng,1988). Permanent ice and snow cover about 7% of the landform on FP (Schmid et al., 2017). The annual number of air freeze-thaw cycles is 120 to 122 on FP(Schmid et al., 2017). FP is sensitive to the environment change, the meltwater of snow and ice and the icecap will alert the hydrology on FP.However, to the best of the authors knowledge, few documented comprehensive hydrochemistry studies was carried out on FP. Geochemical features of the runoffs on FP are important to reflect this rapid changing environment. To have a better understanding of the characteristics of polar glacier meltwater, the mechanism of the chemical weathering and the circulation of terrain-river-ocean system, in January to February, 2015, we investigated various types of water samples, including streams, meltwaters, ground waters, snow and ice around the Great Wall Station,Fildes Peninsula. Major ions, alkalinities, silicate,pH, dissolved oxygen, temperature, and electric conductivities were measured, in order to better understand the hydrochemical features on FP.
2 MATERIAL AND METHOD
2.1 Study area
FP (62°08′48″–62°14′02″S, 58°40′59″–59°01′50″W)is the largest ice-free area on the KGI, west of Antarctica. The surface area of FP is 29 km2(Alfonso et al., 2015) (Fig.1). The monitoring data at the Great Wall Station from 1985 showed that the temperature is as low as -26.6°C in winter, and as high as 11.7°C in summer. Wind speed at the Great Wall reaches up to 40.3 m/s, and the precipitation is approximately 630 mm per year. The main rock type on FP is basalt(Liu and Zheng, 1988). Glacier and snow melting occurs from November to March (Wen et al., 1998;Lim et al., 2014).
2.2 Sample collection, handling and storage
The expedition on FP was carried out from January to February 2015. 13 stream water samples were collected, while ground waters, meltwaters, ice and snow samples were collected during the expedition(Fig.1). Meltwater samples were defined as the water samples taken directly from the outlets of the Collins ice cap. Stream water samples are main consisted of meltwater from icecap and also possibly influenced by groundwater and melting of snow and ice. To get the relationship of the influence factors in streams water, we investigate the geochemical temporal variations in Yuquan River. The time series sampling on the Yuquan River located near the “Great Wall Station.” Our sampling strategy is described in Zhang et al. (2015). Briefly, water samples were collected using a 1-L precleaned polyethylene bottle held at the tip of a pole to avoid any contamination by hand.Samples were then carried back to the Chinese “Great Wall Station” and processed in the laboratory on shore. To avoid potential contamination, all water samples were filtered in a plastic covered space with filtered air blowing from an air filter. Samples were filtered with 0.4 μm polycarbonate membrane(Whatman, USA). Samples for major ion analysis were stored in precleaned polyethylene bottles.Samples for silicate analysis were stored in precleaned polyethylene bottles separately, with saturated HgCl2added before storage.

Fig.1 Sampling sites
2.3 Analysis method
2.3.1 Physical-chemical parameters
The pH, dissolved oxygen (DO), temperature (T)and electric conductivity (EC) were measured on site with a portable multifunction water quality meter(Multi 350i, WTW Company, Germany). Alkalinity was measured using the method described in Zhu et al. (2006); the relative standard deviation (RSD) of our measurement is 1.3%. To achieve more precisedata, we calculatedusing different equations under different hydrological conditions (Li et al., 2013). pH ranged from 6.43 to 9.66, and all samples were fresh water in this study. When pH<8,can be ignored, asis much lower in water than.can be calculated as Eq.1,where Kwrefers to the ionic product constant of water,and the values under different temperatures were obtained from Marshall and Franck (1981). When pH>8, [H+] can be further ignored.is calculated by Eq.2, where K2refers to dissociation constants of carbonic acid, which is calculated refers to the method described by Goyet and Poisson (1989)and Millero et al. (2006).
2.3.2 Major ions
Major ions (cations: Na+, K+, Mg2+, Ca2+; anions:Cl-,were analyzed with an Ion Chromatograph(ICS-2000, Dionex). The standard solution used for Na+, K+, Mg2+, and Ca2+was 1 000 mg/L (Anpel,China); the standard solution used for Cl-andwas 1 000 mg/L (Merck, Germany). The precision and accuracy data are documented in supplementary Table S2. Total cation content was calculated as TC=Na++K++2Mg2++2Ca2+and total anion content was calculated as TA=Cl-+ˉ+. TC/TA ranged from 91% to 110% (the charge balance is shown in supplementary Fig.S1).
2.3.3 Silicate and Nitrate analysis
2.3.4 Air temperature, precipitation, and discharge
The air temperature and precipitation data were extracted from ERA-Interim, which is a reanalysis system of the global atmosphere covering the datarich period since 1979, and continuing in real time.ERA-Interim represents a major undertaking by ECMWF (European Center for Medium-Range Weather Forecasts, 2009) to produce a reanalysis with an improved atmospheric model and assimilation system and will be continued as an ECMWF Climate Data Assimilation System (ECDAS) until superseded by a new extended reanalysis. More details of this dataset can be found in Dee et al. (2011).
The ERA-Interim data used in this research was downloaded from NCAR (National Center for Atmospheric Research). NCAR’s Data Support Section (DSS) is performing and supplying a grid transformed version of ERA-Interim, in which variables originally represented as spectral coefficients are archived on a reduced Gaussian grid and transformed to a regular 512 longitude by 256 latitude N128 Gaussian grid. The air temperature and precipitation data are configured for a reduced Gaussian grid with approximately uniform 79 km spacing for surface fields. Temporal resolution is four analysis per day at 00, 06, 12 and 18 UTC.
The discharge of each stream was roughly estimated via the float method, which is calculated from the cross-sectional area of the stream and the stream velocity, obtained by timing 8–10 small plastic floating balls.
2.3.5 Statistics
Significance discriminant analysis and principal components analysis (PCA) were performed by SPSS(Statistical Package of the Social Sciences, vision 23.0). Significance discriminant analysis used the independent samplest-test. If thet-test results less than 0.05, we regard there exists significant difference,otherwise the difference is insignificant. Principal components analysis applied the KMO and Bartlett's Test and the maximum variance method. When the Bartlett’ test result is less than 0.001, it represents there are correlations between these data, and the PCA analysis continued. Cluster analysis chose Ward’s method and measure interval chose squared euclidean distance.
3 RESULT
3.1 Physical-chemical parameters and the major ions
Table 1 presents the physical-chemical parameters(including pH,T, DO, EC) and the major ions of Stream water, Meltwater, Ground water and Snow and Ice samples collected on FP. The pH of streams water ranges from 6.55 to 9.66, which has the highest average pH (8.15±0.56,n=36) over meltwater, ground water, snow and ice. The pH of snow and ice ranges from 5.90 to 7.95, with average value of 7.20±0.70(n=6), which is lowest average pH compared to other samples. Streams water temperature ranges from 0.0 to 9.0°C, averaging 1.6°C. Temperature in meltwater and ground water are lower than in streams water,ranging from 0.4 to 0.9°C, and from 1.5 to 3.3°C,respectively. The range of EC in streams water,meltwater, ground water, snow and ice is from 45 to 353 μs/cm, 65 to 162 μs/cm, 65 to 147 μs/cm, and 4 to 17 μs/cm, respectively. The EC of snow and ice is significantly lower than in the other samples(P=0.000). DO in the meltwater is significantly lower than in the streams water (P=0.004).
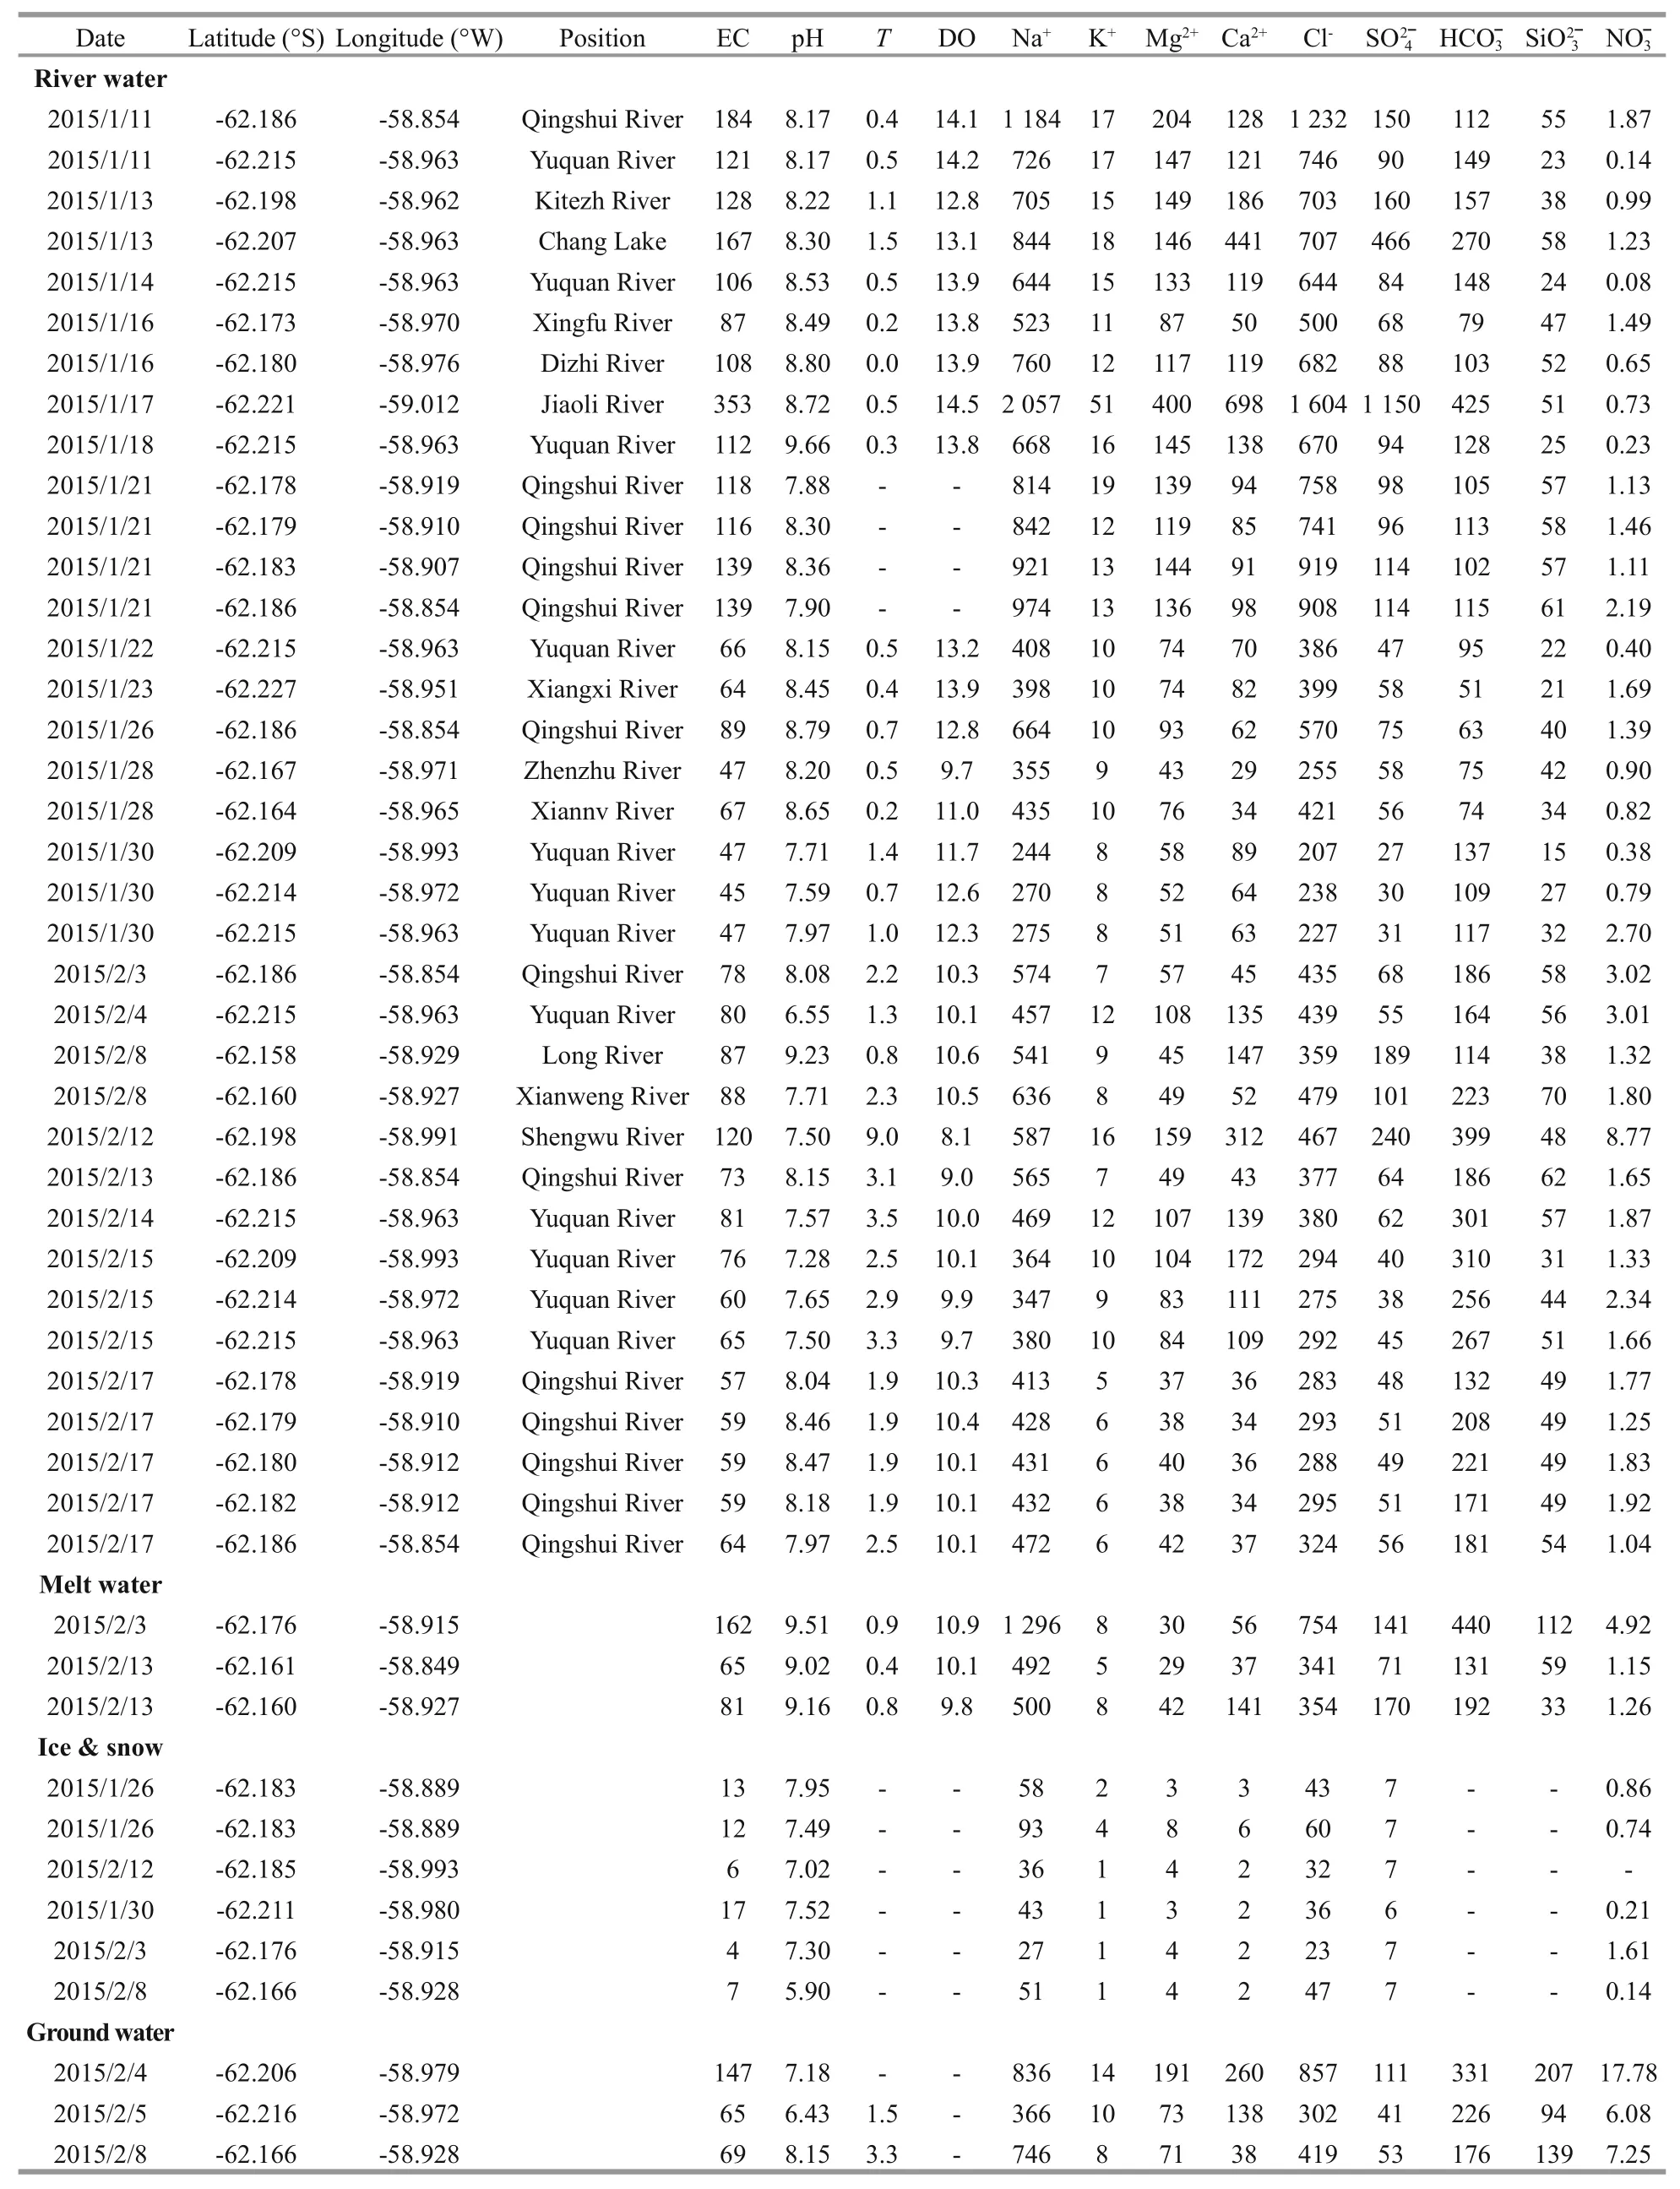
Table 1 Physical-chemical parameters and the composition of stream water, snow and ice, melt water and ground water in Fildes Peninsula
The concentrations of major ions (Na+, K+, Mg2+,Ca2+, Cl-,, HCO ˉ3) and silicate (Si) in the FP water system are presented in Table 1. Among all four types of water, major ion concentrations are highest in streams water, while major ion concentrations are lowest in snow and ice. Stream water samples have higher Na+(range from 244 to 2 057 μeq/L) and Cl-(range from 207 to 1 604 μeq/L) concentrations relative to other major ions. K+has the lowest concentration, range from 5 to 51 μeq/L. The average Si concentration is highest in ground water(147±57 μeq/L,n=3) and lowest in streams water(45±14 μeq/L,n=36).
3.2 Time series observation on Yuquan River
Yuquan River originates from the small permanent icecap on the south part of the FP. During our investigation, the air temperature on FP ranged from-1.8 to 5.2°C. After January 18, 2015, the air temperature on FP began warming. The air temperature averaged 2.3°C, ranging from -0.2 to 5.2°C. Relatively high precipitation (>6 mm) events occurred on January 31, February 4 and February 6, 2015. The greatest precipitation event occurred on January 31,measuring 11.1 mm.
The two end-member mixing model was applied to quantify the contribution of meltwater and snow and ice to the mass of the water in the Yuquan River(Eq.3). The concentration of total ions in three melting Collins Icecap water samples were chosen as the meltwater end-member since the outlet of the Yuquan River was not achievable, and six samples of young ice and snow were chosen as the snow and ice endmember. The average concentration of total ions from the two end-members were chosen for this model,since concentration of total ions in these two types of samples differed significantly from each other.

where TIobservedrepresents the observed concentration of total ions in Yuquan River, where TI(MW)and TI(SI)represent the end-member concentration of total ions’values in meltwater and snow and ice, respectively;f(MW)and f(SI)refer to the fractions of water from meltwater and snow and ice, respectively. The fraction of meltwater contribution to the Yuquan River on different days is shown in Fig.2b and was noticeably higher before January 18. As snow and fresh ice melted due to the rising air temperature after January 18, the fraction of snow and ice contribution to the Yuquan River increased.
4 DISCUSSION
4.1 Controlling mechanisms of hydrochemistry on FP
4.1.1 Seasalt
Seasalt is one of the important chemical components in the runoff systems. Seasalt contributing to a great proportion found in natural water located within 100 km from the ocean (Meybeck, 1983; Dong et al.,2016). In this study, the width of FP is only ~3 km,seasalt effects on the runoffs on FP would be expected.To better understand the hydrochemical process that occurred in catchments of the runoffs, seasalt corrections are usually applied to eliminate the seasalt from atmospheric deposition (Grosbois et al., 2000).The non-seasalt portion of major ions in FP streams is calculated by Eq.4:

where [M]measureand [Cl]measurerepresent the original concentration of major ions and Cl-, respectively.[M]sea/[Cl]searepresents the ratio of major ions to Cl-in sea water, where we applied the molar ratios from Millero et al. (2008). The original data and the results after seasalt correction in FP streams present in supplementary materials Table S5. Only a small portion of major ions remain after the seasalt correction, since the main controlling factor for hydrochemistry on FP is atmospheric deposition, as previously discussed. Post-seasalt correction, [K+]and [Mg2+] in some FP streams showed negative values. These negative values may be attributed to over-correction. This is because that the seasalt correction equation assumes chlorine is entirely coming from the ocean (Meybeck, 1983; Grosbois et al., 2000). There is an unsubstantiated hypothesis that chlorine may come from mineral dissolution during water-rock interaction (Prof. Andrew J Hodson,personal communication). Additionally, observed evidence suggests that in the glacial environment, Clmay be produced in the rock-water interface through the early englacial process (Brown, 2002). This observation is consistent with our observation of Cl-concentrations of up to 747 μeq/L in a meltwater sample collected directly from an outlet of the Collins ice cap. Constraining the chlorine from mineral dissolution is beyond the scope of this study; in the following section, we will discuss the rock weathering features revealed by the hydrochemistry on FP after seasalt correction.

Fig.2 Time series observation on Yuquan River
4.1.2 Identifying the main controlling factors of the hydrochemistry on FP after seasalt correction
After seasalt correction, the PCA result in Table 2 suggest there are three main factors that controlling the hydrochemistry on FP. Factor 1 accounts for 48.08% of the total variance and is correlated with Na+*, K+*, Mg2+*, Ca2+*,,. We infer this factor mainly from carbonate weathering (Li et al.,2007). Factor 2 represents 30.65% of the total variance, andis the important parameters in this factor. Since Si is usually regarded as a terrestrial tracer (Cornelis et al., 2011), we consider this factor represents silicate weathering. Factor 3 accounts 12.07% of the total variance, and NO3ˉ plays a key role in this factor. Since only NO3ˉ in snow and ice is significantly different from streams water (P=0.03,supplementary Table S4), factor 3 correlating to the aerosol flux, which may originally from photochemical reaction in atmosphere (Xu et al., 2011).

Table 2 The PCA results show the factors’ effect on the hydrochemistry of Fildes Peninsula

Fig.3 Ternary diagram (molar percentage) of stream water, ground water, meltwater and snow and ice on Fildes Peninsula
4.1.3 Chemical processes on FP
Different types of water (include stream water,meltwater, ground water, snow and ice) has been compared on the ternary diagram in Fig.3. For cations,stream water, meltwater, snow and ice show the feature of the K+* and Na+* enrichment. Higher composition of Si, Ca2+* and Mg2+* were found in ground waters. For most samples, meltwater, ground water and stream water all exhibit the enrichment of Cl-.were found higher in four samples from Long River, Chang Lake, Shengwu River and Jiaoli River. The melt water which close to Long River also found a high concentration inˉ.
High Ca2+*/ˉ ratios in the runoff systems on FP can be explained by either Ca gain or Si loss processes.Ca gain due to the preferred Ca dissolution in basalt rocks is usually found in the runoff systems in high latitude regions. For example, High Ca2+*/ratios in glacial runoffs were found due to dissolution of calcite even with low calcite abundance in the host rock (Raiswell and Thomas, 1984; Jacobson et al.,2015). These examples suggested that the carbonate type rocks, e.g., calcite and heulandite in basalt, could be formed though hydrothermal alteration of basalt in the lava pile. Fildes Peninsula is mainly composed of basalt which formed by the same processes (Yang et al., 1990; Shin et al., 2009). Ca2+*/ratios averaged 1.75 in our ground water samples, similar to the data reported by Pokrovsky et al. (2005). Our high Ca2+*/ratios in runoffs on FP are also consistent with the observed loss of Ca in rocks on FP (Liu and Zheng, 1988). Applying the approach of Georg et al.(2007), the estimated fraction of Ca gain from the dissolution of carbonate into runoffs from the waterrock interaction on FP averaged 61%±35% (n=13).However, this calculation is based on the silicatederived Ca2+per mole of Na+. Graly et al. (2017)suggested the higher Ca2+to Na+in the subglacial environment, which may create errors for our previous calculation. Si loss into secondary clay minerals or precipitation may contribute to the high Ca2+*/ˉ ratio in rivers (Georg et al., 2007). Previous study reported that high amounts of secondary clay minerals were found in the sediment from lakes on FP (Alfonso et al., 2015). We found that streams closest to the Collins Ice Cap usually have lower Ca2+*/ˉ ratios(0.67–0.75), e.g., Qingshui River, Zhenzhu River, and Xiannv River; while the streams with more vegetativecovered catchment, e.g., Shengwu River, Chang Lake, have much higher Ca2+*/ratios (>3). The Ca2+*/ˉ ratio reaches as high as 10.24 in the waters of the Chang Lake (Chang lake outflow),suggesting that biological uptake may be a factor responsible for the Si loss in waters on FP.
4.1.4 Cluster analysis
Cluster analysis (after seasalt correction) of the 13 streams on FP was conducted to identify these different streams, as shown in Fig.4. Four groups are presented here. Streams in Gourp 1 are near the Collins Icecap maybe more close to glaciated stream,including, Xingfu River, Zhenzhu River, Xiannv River, Dizhi River. The streams in Group 1 are spatial closed, exhibited weakly alkaline (pH range from 8.2–8.8), and contain the lowest concentration of the Na+over the 4 groups. Group 2, including, Kitezh River, Yuquan River, Xianweng River and Long River, are more complicated due to their complicated environmental influences, eg: glacial melted,anthropogenic activity and biological activity. This group has higher Na+, Ca2+andthan Group 1.Chang Lake and Shengwu River in Group 3, major ions are apparently higher than that of in Group 1 and 2. Group 3 locate more closed to the airport and many bases on FP. The only stream of Jiaoli River is in Group 4. The sampling location was closed to the sea,and may reflect more influence from the sea. The salinity in Jiaoli River is 0.1, contains much higher ions compared to other 3 groups.
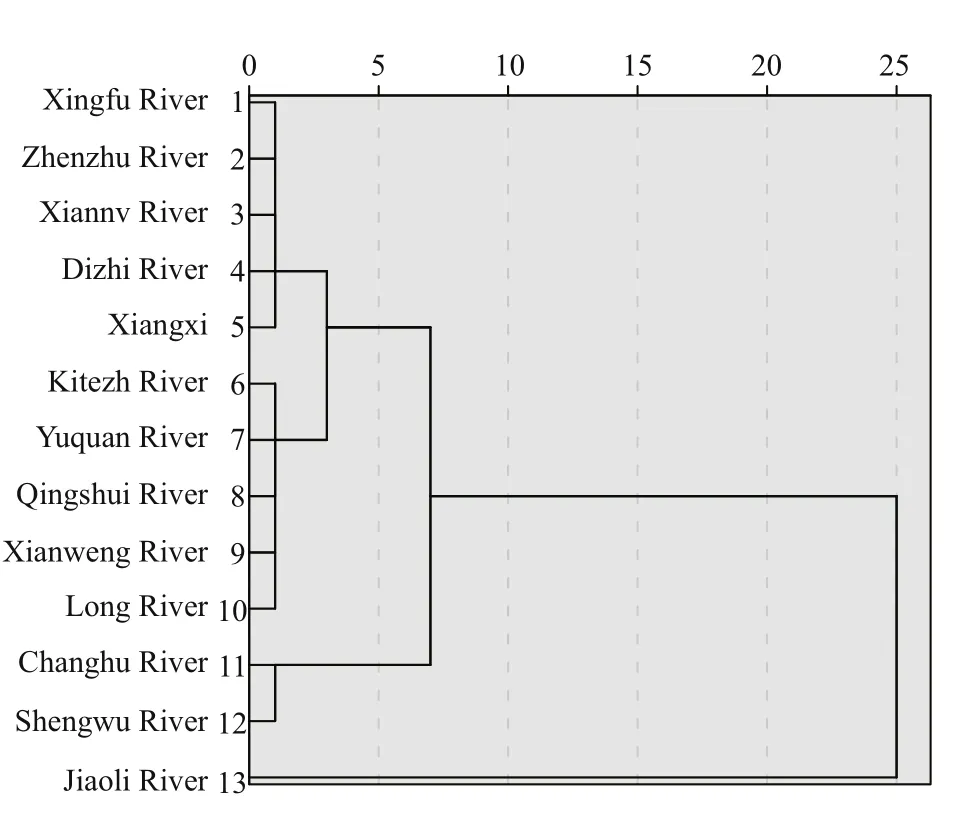
Fig.4 Cluster analysis of 13 streams on Fildes Peninsula
4.1.5 Chemical weathering rate and atmospheric CO2consumption rate
As the glacier melting on the silicate based rocks,atmospheric CO2will drawdown into the glacial meltwater accompanied silicate weathering (Sharp et al., 1995; Tranter, 1996; Brown, 2002). In this section,atmospheric CO2drawdown during silicate weathering on FP was estimated.
Chemical weathering rate is calculated by Eq.5:

Ca2+and Mg2+contribution from silicates:

Atmospheric CO2consumption rate:

CWR, R(CO2), Q and A represent chemical weathering rate, atmospheric CO2consumption rate,runoff and basin area respectively.
Precipitation is 630 mm/a and the surface area is 29 km2on FP, an estimated runoff of 0.018 km3from the peninsula can be calculated. If we considered silicate is the dominate bedrock, Ca2+and Mg2+which came from silicates can be calculated by Eq.6 (Graly et al., 2017). Then the rest Ca2+and Mg2+in the streams should be attributed from carbonate weathering. Therefore, we can estimate the proportion from the silicate weathering and carbonate weathering. In silicate weathering, 1 mol HCO3ˉ would consume 1 mol CO2, while in carbonate weathering, 1 mol HCO3ˉ only consume 0.5 mol CO2(Shi, 2012). After applying Eq.7, the total atmospheric CO2consumption of (0.5–5.0)×106mol/a can be estimated, and the CO2consumption rate can be estimated as (1.7–17.3)×104mol/(km2·a) on FP. The chemical weathering rate is approximately 6.5–9.7 t/(km2·a), after applying the total dissolved ions and the water flux on FP.
Our data is comparable to other polar glacial runoffsystem, for example Svalbard, Arctic and Onyx River,Antarctica (Hodson et al., 2000; Green et al., 2005).Detail information see supplementary Table S3.However, the differences between methodology for CO2consumption calculation also need further comparison.
4.2 Si flux estimation
Si concentration in meltwater samples averaged 34±20 μmol/L (n=3), and Si in all freshwater samples on FP averaged 25±17 μmol/L (n=45). Si concentration in sub-surface seawater of the adjacent seas of King George Island is 60 μmol/L, and salinity is 34.5(Brandini, 1993). Due to freshwater input from the FP, salinity in surface seawater is diluted to ~33.6. As Si usually exhibited conservative behavior in estuary,it indicates the meltwater from King George Island is an unimportant source of Si to its adjacent seas,having a small, local impact with respect to Si flux.However, Hawkings et al. (2017) found that amorphous silica is the dominant Si species, rather than dissolved silica. Therefore, we may be underestimating the Si flux from King George Island to its adjacent seas based solely on our dissolved Si concentration.
5 CONCLUSION
In this study, the hydrochemical features of the freshwater system on Fildes Peninsula, King George Island, Antarctica, were demonstrated, and the waterrock interaction process was evaluated. The hydrochemical features of streams on FP were influenced by the meltwater from icecap and melt snow. Ternary diagrams, principal components analysis and cluster analysis were applied to interpolate the data. It showed the runoffs on FP were largely influenced by seasalt from the atmospheric deposition. After seasalt correction, we conclude that the remaining geochemical components are released by silicate weathering from the local water-rock interactions. As revealed by the Ca*/Si ratios in the streams water on FP, a major assumption is that more than half of the Ca from the water-rock interactions originates from the dissolution of Ca-bearing silicate minerals (basalt is the main silicate rock type on FP).Si may be lost through secondary mineralization,precipitation and biological uptake processes. As observed by this and previous studies, dissolved Si concentration in runoffs on KGI are low, suggesting a less important Si source to the adjacent ocean. Four groups of streams on FP were identified after cluster analysis based on their hydrochemical features.
6 DATA AVAILABILITY STATEMENT
The datasets during and/or analyzed during the current study are available from the corresponding author on reasonable request.
7 ACKNOWLEDGEMENT
We are grateful to all the team members during our investigation in the Great Wall Station, who provided us with their assistance during our field work. Thank you to Dr. Bulat Mavlyudov, who kindly led us to the sampling locations at the outlet of the Collis ice cap.
SUPPLEMENTARY MATERIALS
Fig.S1: Charge balance of total cation (TC) and total anion (TA).
Fig.S2: Fig.S2. Ternary diagram with the relative molar percentage of Na+*+K+*, Ca2+* and Mg2+*. Symbols represent different rivers from the polar region. All the data has been reported after seasalt correction.
Table S1: Results oft-test between ice and snow.
Table S2: Accuracy of the major elements analysis.
Table S3: Polar region CO2 consumption rate.
Table S4:t-test ofin streams water with other three types sample.
Table S5: Major ions in streams before and after seasalt correction (unit, μeq/L).
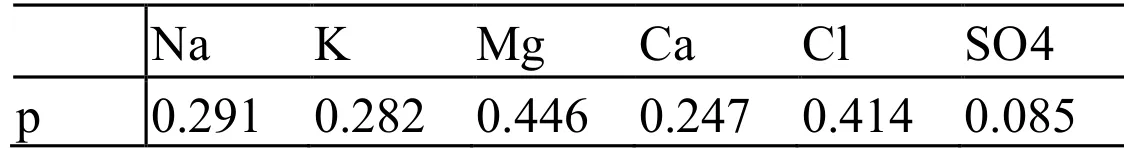
Table S1. Results of t-test between ice and snow.
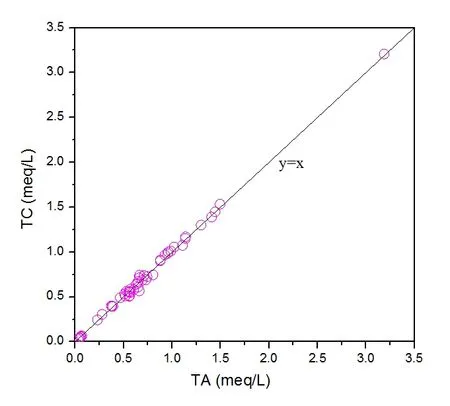
Fig.S1, Charge balance of total cation (TC) and total anion (TA).

Fig.S2. Ternary diagram with the relative molar percentage of Na+*+K+*, Ca2+* and Mg2+*. Symbols represent different rivers from the polar region. All the data has been reported after seasalt correction.

Table S2. Accuracy of the major elements analysis.
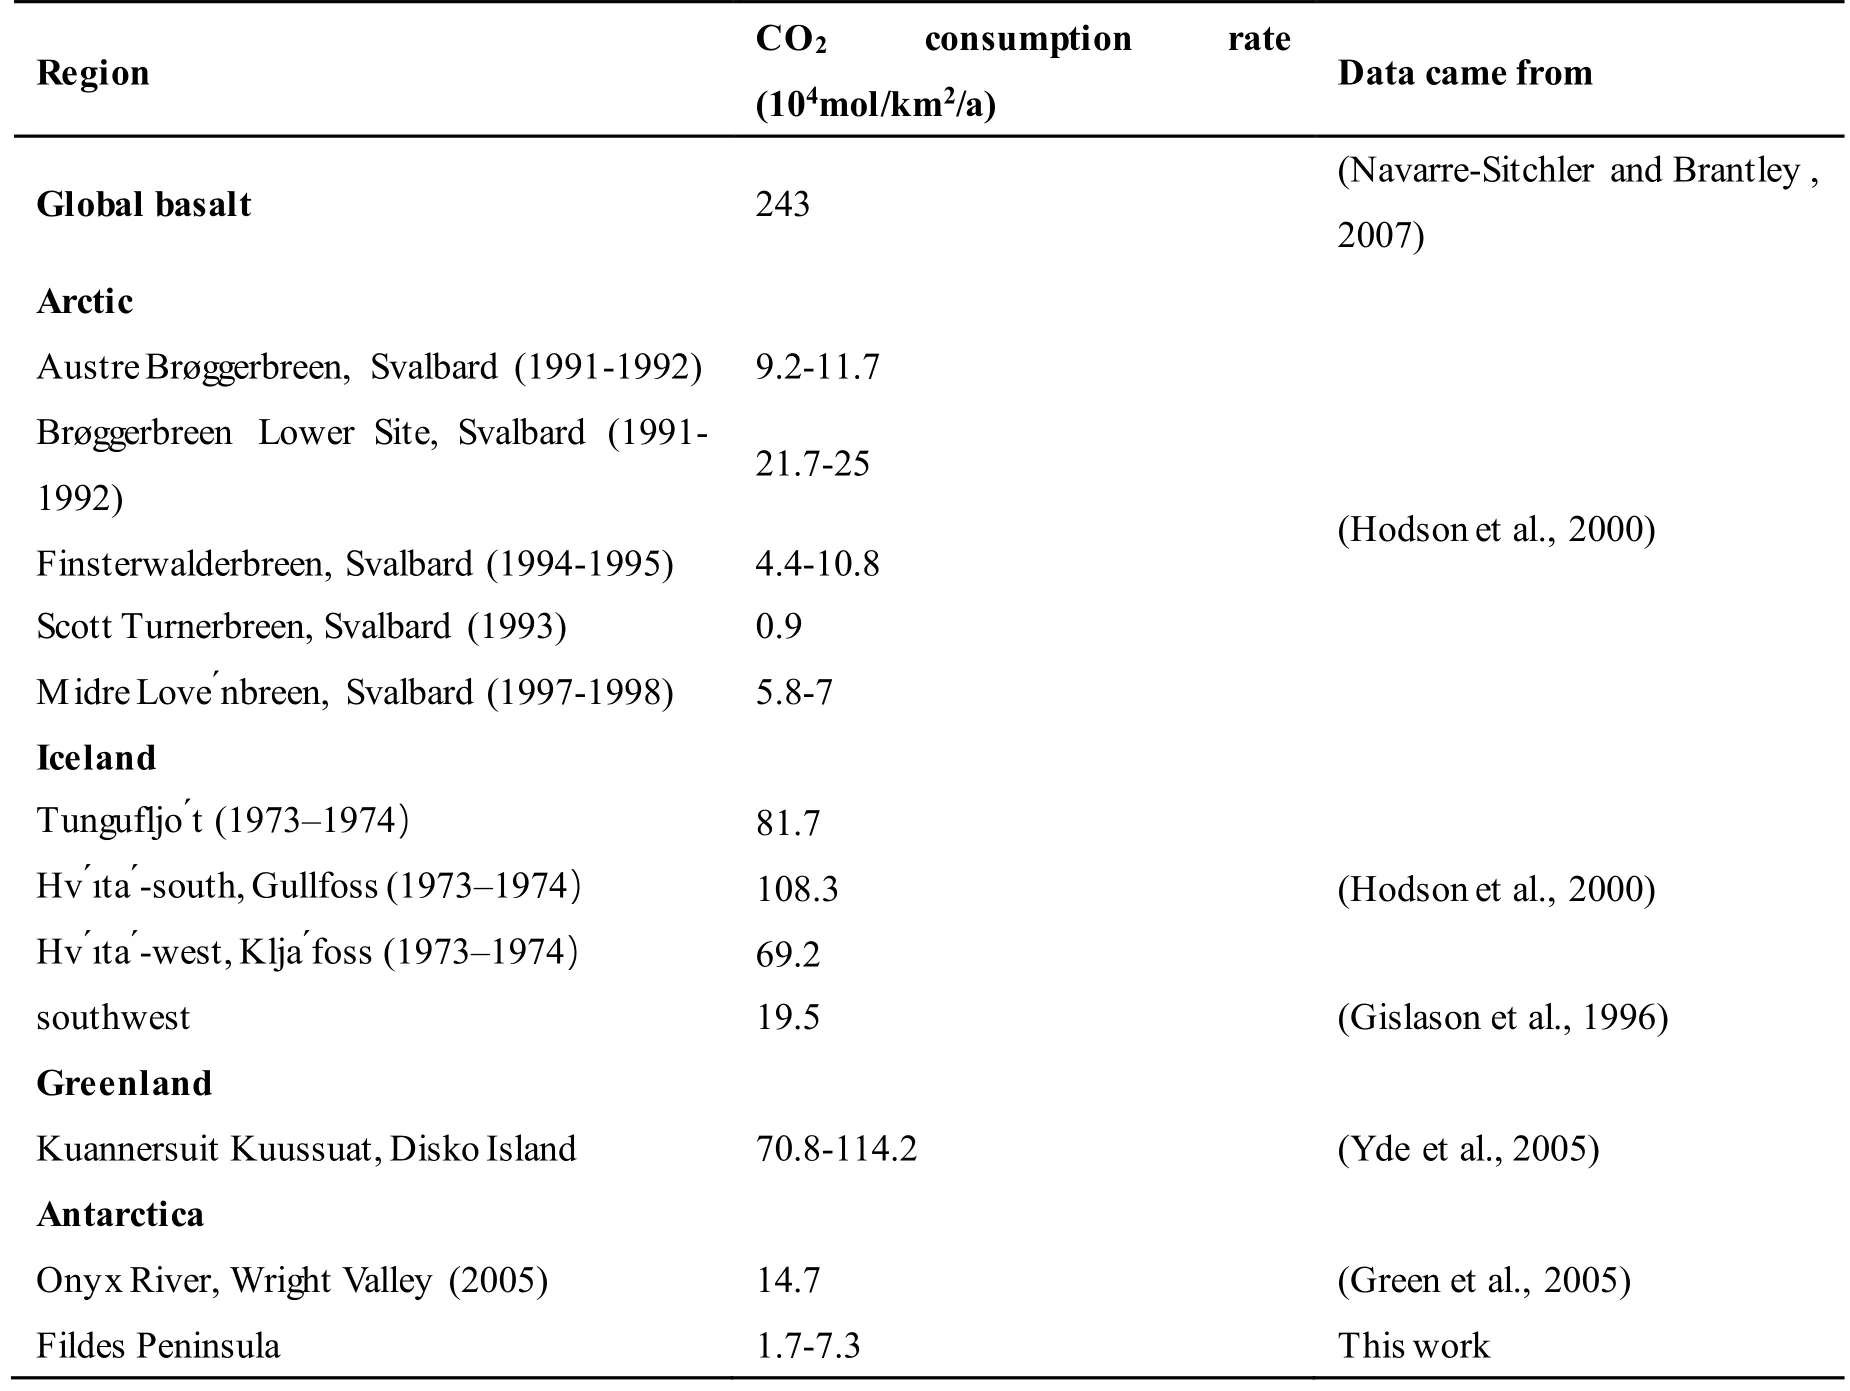
Table S3 Polar region CO2 consumption rate.
Table S4 t-test of streams water with other three types sample

Table S4 t-test of streams water with other three types sample
melt water ground water snow and ice streams 0.56 0.14 0.03
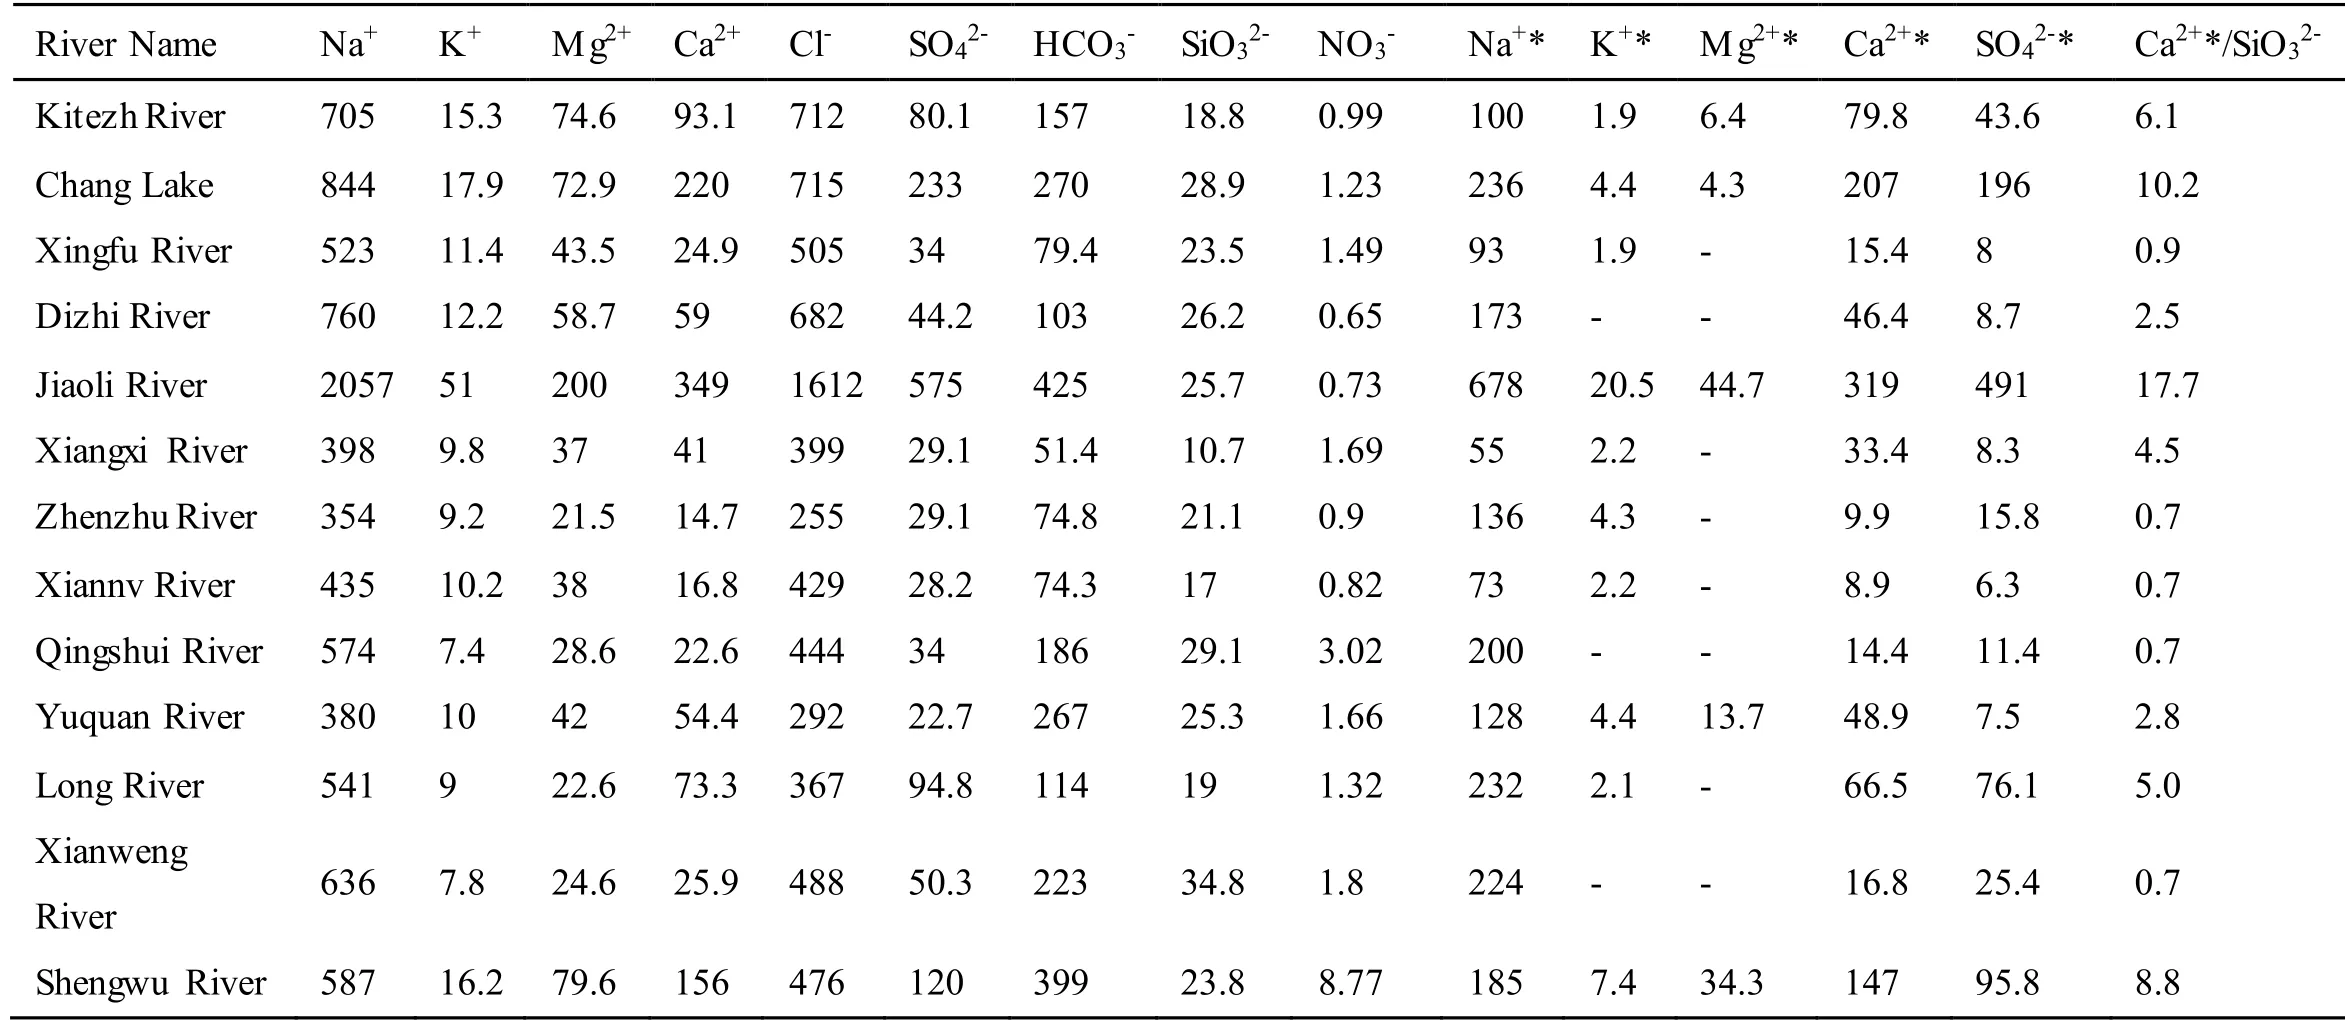
Table S5. Major ions in streams before and after seasalt correction (unit, μeq/L).
 Journal of Oceanology and Limnology2018年6期
- Journal of Oceanology and Limnology的其它文章
- Neuroanatomy and morphological diversity of brain cells from adult crayfish Cherax quadricarinatus*
- On the influence of season and salinity on the phenology of invertebrates in Australian saline lakes, with special reference to those of the Paroo in the semiarid inland
- Man-made plutonium radioisotopes in the salt lakes of the Crimean peninsula
- Cladophora mats in a Crimean hypersaline lake: structure,dynamics, and inhabiting animals
- Antimony speciation at the sediment-water interface of the Poyang Lake: response to seasonal variation*
- Seasonal variations of phosphorus species in the Tuohe River,China. Part I. Sediments*