
Biochemical and Metabolomics on Rice Cultivars
2019-05-23 01:13HurugalavadiPuttaswamaiahRanjithaRameGowdaNagarajappaNethraNarayanappaAmrutaHemanthKumarKandikattu
Rice Science 2019年3期
Hurugalavadi Puttaswamaiah Ranjitha, Rame Gowda, Nagarajappa Nethra, Narayanappa Amruta, Hemanth Kumar Kandikattu
Biochemical and Metabolomics on Rice Cultivars
Hurugalavadi Puttaswamaiah Ranjitha1, Rame Gowda1, Nagarajappa Nethra1, Narayanappa Amruta1, Hemanth Kumar Kandikattu2
()
Plant metabolites are important for both plant life and human nutrition. However, the genetic control of plant metabolome remains largely unknown. Here, we performed a genetic analysis of the different rice metabolome and isozymes which are highly versatile and non-destructive as bio-markers. Five isozymes peroxidase, catalase, malate dehydrogenase, alcohol dehydrogenase (ADH), polyphenol oxidase were studied to characterize the thirty rice cultivars and two hybrids KRH-2 and KRH-4 along with their parental lines. Among the zymograms, ADH was found to be useful for the detection of cultivars, like CTH1, IR64, IR30864, with anRvalue of 0.549. The metabolomics of rice cultivars by using gas chromatography coupled with mass spectrometry instrument with selected reaction monitoring mode software identified the 66 metabolites in the rice samples, including amino, organic, fatty acids, alcohols and sugars (mono-/dis-accharides). All metabolites investigated varied significantly among rice samples. Jaya had the higher number of metabolites (15) with a peak for each metabolite, followed by Jyothi (13). This study demonstrated a powerful tool and provided a high-quality data for understanding the plant metabolome and isozymes, which may help bridge the gap between the genome and phenome.
gas chromatography; mass spectrometry; isozyme; spectroscopy; metabolomics; rice
Plants are highly enriched in specific metabolites with extensive quantitative and qualitative variation both among and within different plant species. Understanding the genes involved in metabolism and dissection of the metabolic pathway is essential to improve plant adaptation to environmental stress, food quality and crop yield. Electrophoresis is a technique used to separate charged particles under the influence of the electric field. It is most useful for separating mixtures of large molecules such as proteins and nucleic acids, which in solution behave as charged particles. The use of proteins and isozymes as genetic markers has been accepted as a reliable tool. Glaszman et al (1988) studied the electrophoretic variation of isozymes in plumules and coleoptile of 4- to 10-day-old seedlings of rice genotypes using starch gel electrophoresis and developed a key for identification of 76 alleles of 24 loci. Hussain et al(1989) characterized 11 rice genotypes for specific protein pattern using polyacrylamide gel electrophoresis (PAGE). Band variation is conspicuous in slow migration regions on the gel. Yu and Wang (1989) conducted a study on esterase isozyme pattern of 84 rice varieties and reported that typical sickle-shaped rice mostly belonged to thegroup. Isozyme patterns of esterase, malate dehydrogenase, alcohol dehydrogenase, peroxidase, catalase and acid phosphatase are compared to distinguish cotton cultivars. The esterase zymogram reveals a unique banding pattern for each genotype. Peroxidase and catalase enzymes are useful in distinguishing the species group and interspecific hybrids, whereas alcohol dehydrogenase polymorphism is not sufficient to aid in cultivar identification (Nerkar and Rao, 1993). Shion et al (1994) revealed the genetic nature of several isozymes segregating in Mendelian inheritance, which showed have simple genetic control, therefore, isozyme variation can be used as genetic markers.
Metabolomics is the scientific study of chemical processes involving metabolites. Specifically, metabolomics is the ‘systematic study of the unique chemical fingerprints that specific cellular processes leave behind’, and the study of their small-molecule metabolite profiles (Daviss, 2005; Gong et al, 2013). Metabolomics is a high-throughput platform which is used to profile the small molecules or metabolites involved in metabolic processes. Mass spectrometry (MS) is used to identify and quantify metabolites after optional separation by Gas chromatography (GC), high performance liquid chromatography (HPLC), liquid chromatography-mass spectrometry (LC-MS), and is the first hyphenated technique to be developed. Identification leverages the distinct patterns in which analytes fragment can be as a mass spectral fingerprint; libraries exist to allow identification of a metabolite according to this fragmentation pattern. MS is sensitive and can be very specific as well. There are also a number of techniques which use MS as a stand-alone technology: the sample is infused directly into the mass spectrometer with no prior separation, and MS provides sufficient selectivity to separate and detect metabolites. The metabolomics study of rice may be used to ‘fingerprint’ different rice samples in order to identify strains that hold significant promise for development, like rice quality improvement and increased nutritional content. As crude extracts tend to be used for metabolite profiling in a nontargeted manner, chromatographic separation is usually required (Fukushima and Kusano, 2014), and fractionated compounds were analyzed. Gas chromatography coupled with mass spectrometry (GC-MS) is particularly well suited to the study of low molecular-weight metabolites that can be made amenable to gas chromatography by chemical derivitization. The main advantage of GC-MS lies in its capability for both metabolite profiling and targeted metabolite quantitation for the analysis of hundreds of metabolites in one GC-MS/MS multiple reaction monitoring (MRM) run. The MRM acquisition mode of unique and timed precursor ion-product, ion transitions for metabolites of interest eliminates interference from matrix or noise. Likewise, co-eluting compounds can be quantified separately, forgoing the need for de-convolution by mathematical methods.
MATERIALS AND METHODS
Isozyme analysis
Pure rice seeds of thirty cultivars and two hybrids (KRH-2 and KRH-4) along with their parental lines (IR58025 and KMR-3 for KRH-2, and CMRS32A and MSN36 for KRH-4) were obtained from Rice Breeding Unit, Zonal Agricultural Research Station, VC Farm, Mandya, Karnataka, India. The seeds were cleaned, dried to the safe moisture level and preserved for further use. Five isozymes peroxidase (POD), catalase (CAT), malate dehydrogenase (MDH), alcohol dehydrogenase (ADH), polyphenol oxidase (PPO) were studied.
Five seeds were soaked in water under an aerobic condition for 48 h and then for germination. Four-day-old single seedling was ground thoroughly in pestle and mortar along with 200 µL extraction buffer, and then a pinch of poly vinyl pyrrolidone (PVP) was added. The extract was taken in 2 mL centrifuge tube and incubated at 40 ºC for extraction of the enzyme for 2 h. After 2 h, sample was centrifuge at 40 ºC at 12 000 ×for 15 min. The supernatant was collected and 10 µL of tracking dye (1% bromophenol blue and drop of glycerol) was added and again centrifuged at 40 ºC at 12 000 ×for 5 min, and 30 µL supernatant was loaded into the gel for electrophoresis. Resolving stacking gel and staining solutions were prepared by using the protocol of Glaszman et al (1988). Sodium dodecyl sulfate polyacrylamide gel electrophoresis (SDS-PAGE) was performed according to Laemmli (1970).
TheRvalue was calculated asR=D/D, whereDis the distance traveled by the band, andDis the distance traveled by the tracking dye. Bands were numbered on the basis of increasingRvalues, the presence or absence of specific bands or combination of different bands.
Metabolomics analysis
Twelve cultivars BR2655, Thanu, Tunga, BPT5204, IR64, Raksha, Rasi, Jaya, Jyothi, CTH1, KRH-4 and JGL1798 were selected to metabolomics analysis based on their popularity and usage by the public.
Derivatives of rice extracts were prepared for metabolic profiling according to Zhou et al (2009). Freshly dehulled grains were immediately dipped in liquid nitrogen prior to grinding the rice samples using a 60-mesh sieve. A total of 300 mg rice samples were weighed, and mixed with 5 mL methanol/water (4:1) with 120 μL cupric acid solution (0.30 mg/mL) as an internal standard. The sample vial was vortexed for 5 min and let stand for 45 min followed by 60 min of sonication before centrifuging at 12 000 ×for 10 min. Then, 7 mL supernatant was removed, freeze-dried and subsequently derivatized using 100 μL N,O-bis (trimethylsilyl) tri-fluoro- acetamide (BSTFA) with 3% trimethyl-chlorosilane (TMCS) and 80 μL pyridine. The mixture was heated in a water bath at 75 ºC for 45 min before being transferred to 2 mL GC vials with 200 μL inserts, ready for analysis by GC-MS/MS. Steps were followed to ensure that the derivatized samples were analyzed within 24 h after derivatization.
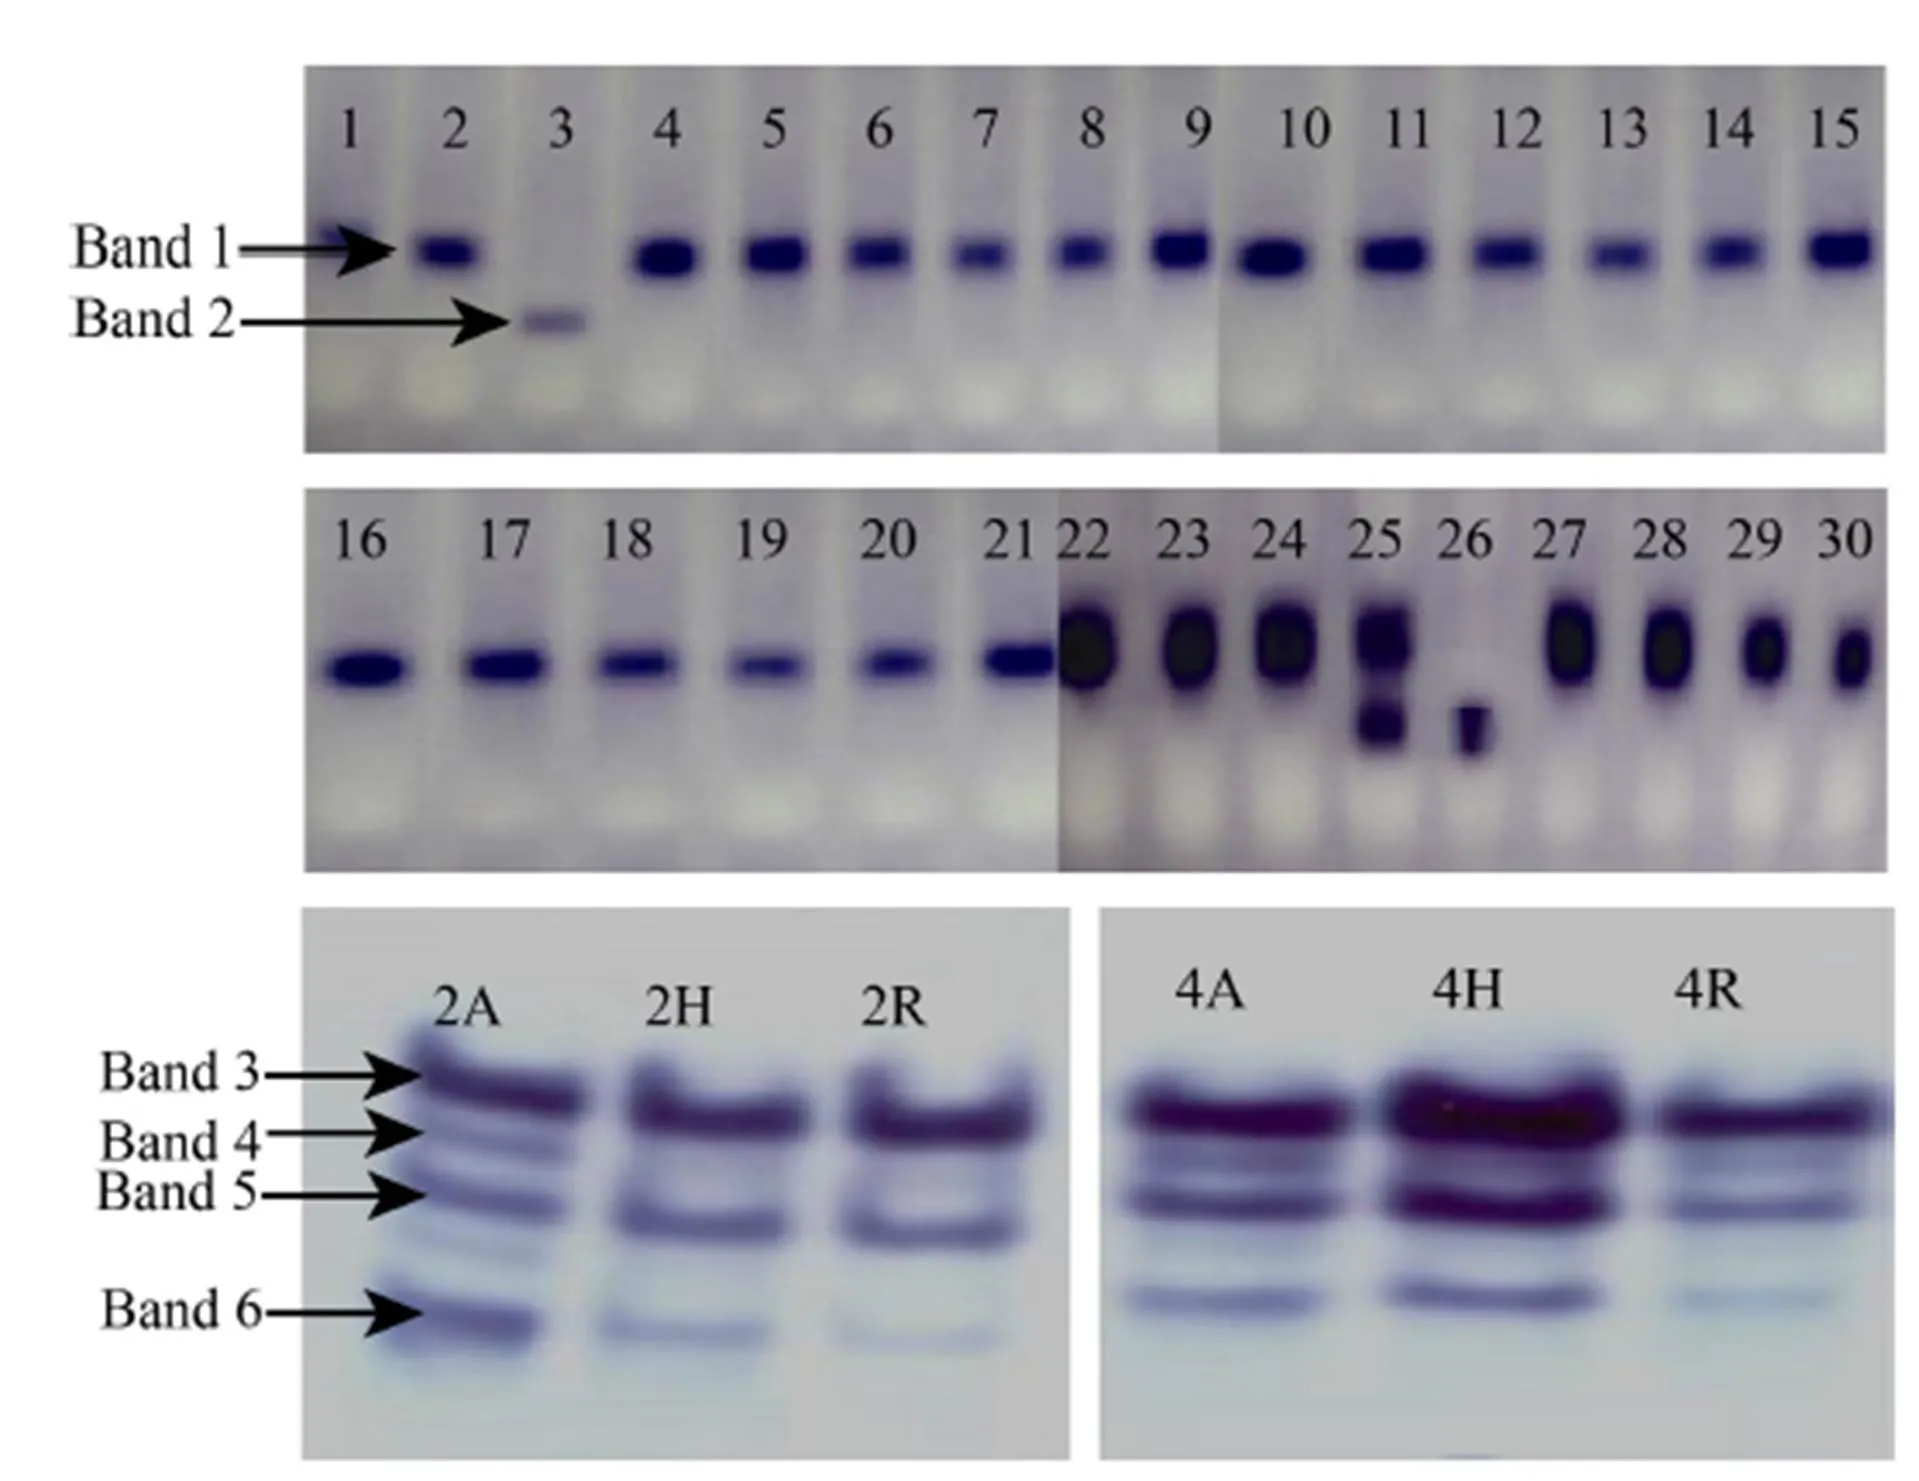
Fig. 1. Alcohol dehydrogenase activity of rice cultivars.
1, Jaya; 2, Mandya Sona 1; 3, CTH1; 4, BI33; 5, Ratna Choodi; 6, KMP200; 7, MAS946-1; 8, Rajamudi; 9, JGL1798; 10, KMO201; 11, Mandya Sona 2; 12, MAS26; 13, BR2655; 14, BPT5204; 15, KMP175; 16, Mandya Sona 3; 17, Thanu; 18, KMP128; 19, MTU1001; 20, Gangavathi Sona; 21, Rasi; 22, Raksha; 23, Tella Hamsa; 24, MTU1001; 25, IR30864; 26, IR64; 27, Jyothi; 28, CTH3; 29, KMP153; 30, Tunga; 2A, IR58025; 2H, KRH-2; 2R, KMR-3; 4A, CRMS32A; 4H, KRH-4; 4R, MSN36.
Phase-I requires full scan GC-MS analysis for identification of compounds by searching library databases. Phase-II requires analysis in the selected reaction monitoring mode (SRM) in order to accurately identify the compounds at trace levels in the heavy matrix background. The ability to perform simultaneously full scan and SRM analyses in a single sample run allows the users to quantitate the known metabolites (targeted) while allowing identification of unknowns (discovery). One of these samples was chosen for the development and optimization of complete SRM. The compound retention time was constant for both workflow stages, served as an additional qualifier for identification, and greatly facilitated the setup of the targeted MRM method.
RESULTS AND DISCUSSION
Isozyme analysis
We selected the five isozymes mainly because they are the major enzymes found in almost all the rice cultivars. And among the isozymes, ADH was effective in distinguishing the cultivars CTH1, IR30864 and IR64 with anRvalue of 0.549, while the other isozymes did not show any significant differences between the cultivars.
Among the different isozymes (Fig. 1 and Supplemental Fig. 1), ADH showed different banding pattern or difference in the Rm value. The zymograms of ADH are presented in Fig. 1. The electrophoretic analysis of rice cultivars for ADH revealed the presence of only two bands. Band number one with medium intensity was present in most of the cultivars, except Raksha, Tella Hamsa, MTU1010, IR30864, Jyothi, CTH3, KMP153, and Tunga showing very high-intensity bands, with anRvalue of 0.427. Whereas, this band was absent in CTH1 and IR64. Band number two of high intensity was absent in all the cultivars studied except CTH1, IR30864, and IR64 with anRvalue of 0.549. Therefore, by using ADH enzyme, these cultivars can be differentiated and the zymogram profile was showed in the Fig. 1-A.
The electrophoretic analysis of rice parental lines and hybrid for ADH revealed the presence of only four bands (Fig. 1-B). Band number one with high intensity was present in the hybrid KRH-2 and its parental lines with anRvalue of 0.398. The difference in terms of relative intensity among CRMS32A, MSN36 and KRH-4 was observed in the band number one. KRH-4 exhibited dark band intensity whereas light intensity band was observed in both CRMS32A and MSN36. It was also present with very high intensity in KRH-4 and medium intensity in its parental lines. Band number two was present in KRH-2 with low intensity and in its parental lines with very low intensity (Rof 0.439). In case of KRH-4 and its parent lines, the band was low intensity. Band number three was present in hybrid KRH-2 and its parental lines with medium intensity. In KRH-4, high-intensity band was present and whereas in its parental lines medium intensity band was present with anRvalue 0.464. Band number four was present in KRH2 hybrid and its parental lines but it was very low in intensity. KRH-4 and its parental lines also showed a very low-intensity band with anRvalue of 0.509. Band number five was low intensity in IR58025 line and it was very low in hybrid KRH-2 and KMR-3. KRH-4 and CRMS32A hybrid showed low-intensity band and MSN36 had shown very low-intensity band with anRvalue of 0.578 (Rohini, 2000; Nethra, 2007; Bimb et al,2010; Rao et al, 2012; Pushpa et al, 2014; Venuprasad et al, 2014; Galal et al, 2015).
Metabolomics analysis
Rice produced various types of metabolites which may be major bioactive (Supplemental Table 1). Phytohormones were secondary metabolites that can coordinate cellular activities for germination, growth, protection against stress, and other physiological activities in the life of plants. As crude extracts tend to be used for metabolite profiling in a non-targeted manner, chromatographic separation is usually required (Fukushima and Kusano, 2014), and fractionated compounds are then analyzed by MS. These analytical methods are most commonly used in not only metabolomics (Kim et al, 2011), but also natural product chemistry. We analyzed the metabolite composition in the rice cultivars and also discussed current knowledge on the secondary metabolites produced by rice and their biological activities as well as the strategies and challenges for using constituents. It captured differences in the metabolite abundance and correlations between rice cultivars, suggesting that these differences may reflect the extent of metabolic adaptation and the specific phenotypes in rice genotypes.
During phase I of the workflow, five different rice samples KRH-4, Jyothi, CTH1, Raksha, Jaya were analyzed. These samples were chosen for their diverse characteristics and the likelihood they would display significant differences in the amounts of various metabolites.
Precursor ion study from full scan data, 66 interest metabolites of and 3–4 precursor ions were chosen for each compound. This step required a single sample injection GC-MS/MS run and the selected precursor ions were then taken to the product ion study (Kandikattu et al, 2014, 2015). Product ions were selected for each of the precursor ions. Several product ions were chosen for each compound, resulting in 3–7 precursor-product ion pairs per compound, which were then taken for the SRM optimization study.
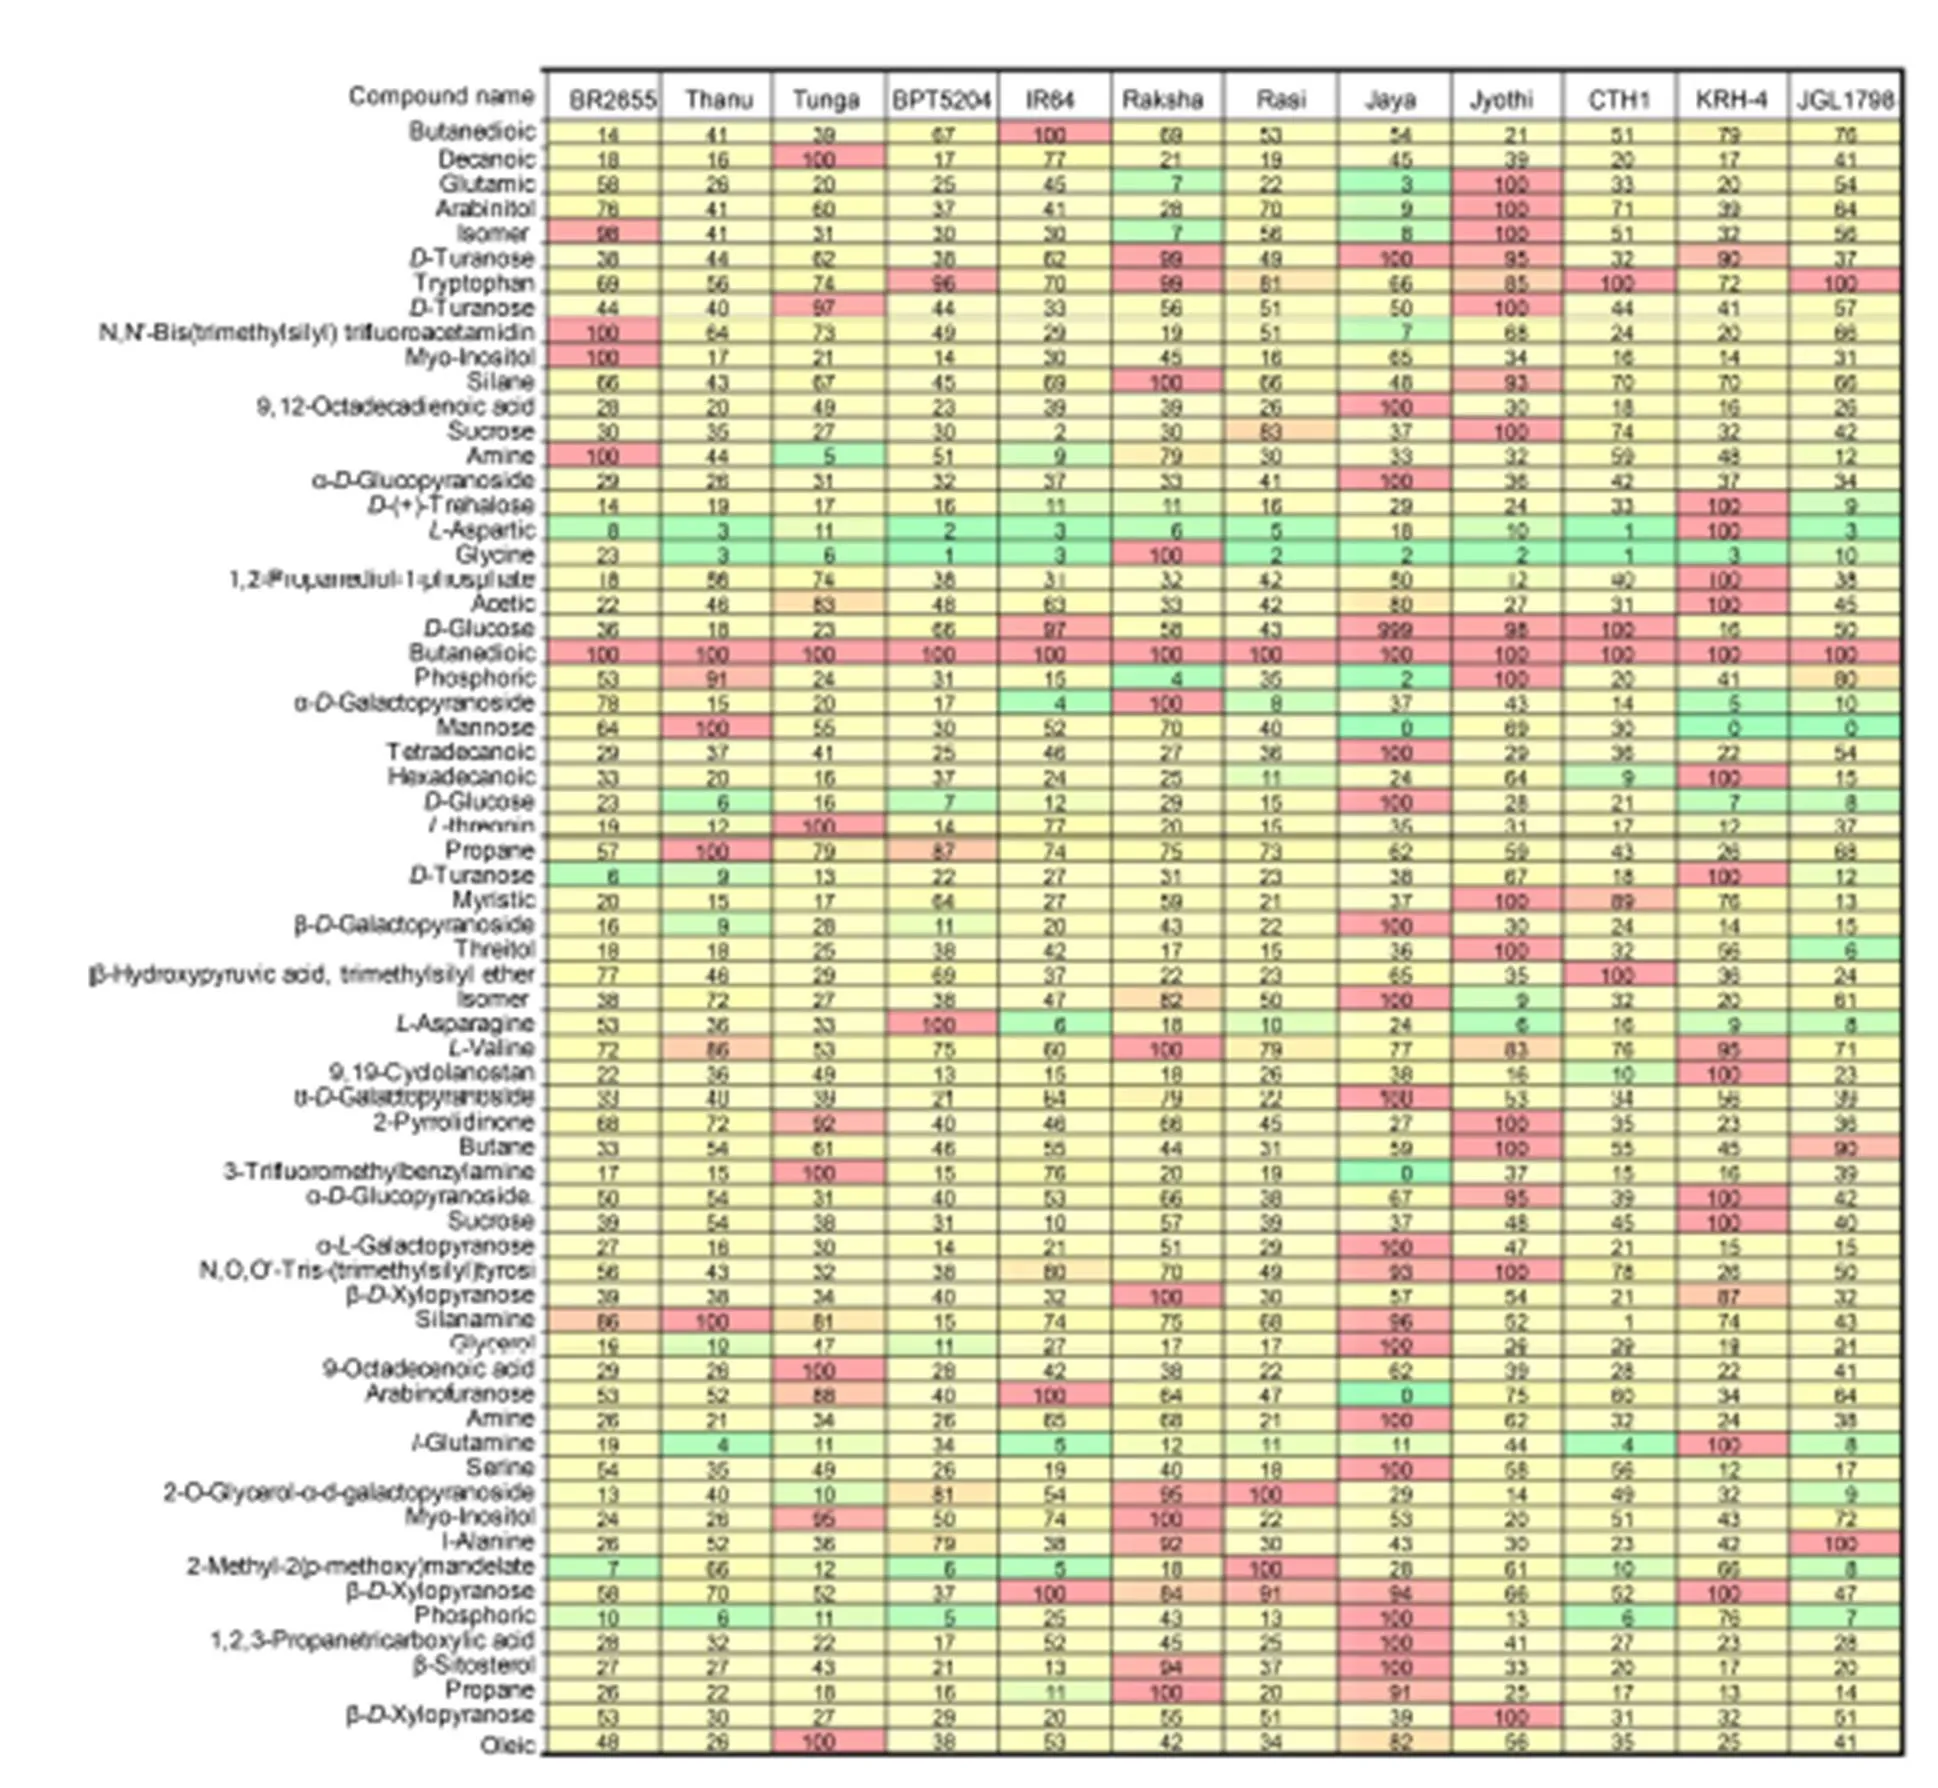
Fig. 2. Selected reaction monitoring mode comparison heat map for 66 compounds in 12 tested rice cultivars.
The colors in the heat map represent the relative concentration with green and red corresponding to 0 and 100%, respectively. The heat map allows direct visual comparison of the relative amounts of these compounds in the 12 tested samples.
The SRM transitions from the Auto SRM optimization described above were exported to the Trace Finder quantitation software and a processing method was automatically created. KRH-4, Jyothi, CTH1, Raksha, Jaya as then run again in SRM mode to check the validity of the SRM optimization. The optimized SRM method used to analyze the twelve different rice strains to identify the potential biomarker, compounds that could be used to discriminate between rice accessions. The relative number of individual metabolites can be represented in the form of the heat map.
The heat map showed the relative concentration of the 66 analysts in the 12 rice samples (Fig. 2). The peak areas were internal standard-corrected, and the final peak areas were normalized. In this way, the sample with the highest concentration of a particular analyst was assigned a relative value of 100% and all other sample concentrations were normalized as a fraction of this. The colors in the heat map represent the relative concentration with green and red corresponding to 0 and 100%, respectively (Fig. 2). The heat map allows direct visual comparison of the relative amounts of these compounds in the 12 tested samples.
The heat map showed that the relative concentration of the 66 metabolites analyzed varied widely among the 12 tested samples. Jaya showed the highest traces (15) the most of metabolites detected, followed by Jyothi (13) and KRH-4 (12), while the remaining cultivars showed low to medium traces for the metabolites (Fig. 2 and Supplemental Table 1). Based on the peak values, retention time and amount of traces of metabolites in particular cultivar, the cultivars can be easily identified, which is helpful to distinguish the cultivars from one other. In fact, all the metabolites studied are potential biomarkers and may be used to distinguish between different rice accessions. This quantitative metabolic data can be used with principal component analysis to associate metabolic biomarkers with grain quality features of the contrasting rice, and National Institute of Standards and Technologylibrary search was used to identify unknowns with aim of identifying potential biomarkers for characterization in support of grain quality research. The identification of unknown compounds could be achieved by library search with high confidence. Isomeric compounds have been distinguished on the basis of their elution at differing retention times and could be selectively quantified based on their specific fragmentation profiles. The 66 metabolites in the rice samples includes amino, organic and fatty acids, alcohols and sugars (mono-/dis- accharides). The optimized SRM method was completed in less than 24 h and used to analyze these metabolites in 12 diverse rice samples. All metabolites investigated varied significantly among rice samples and therefore have the potential for use as biomarkers for the characterization of diverse rice accessions. This work forms a basis for future studies to tap into the value of diversity to improve grain quality and nutritional value of rice in the larger panels (Wechwerth et al, 2004; Zhou, 2009; Kusano et al, 2015; Nam et al, 2015).
Acknowledgements
This study was supported by the Rajiv Gandhi National Fellowship of the Ministry of Science and Technology, India.
SUPPLEMENTAL DATA
The following materials are available in the online version of this article at http://www.sciencedirect.com/science/journal/ 16726308; http://www.ricescience.org.
Supplemental Table 1. Metabolites obtained from GC/MS SRM transitions method for 12 diverse rice cultivars selected from Phase-I discovery.
Supplemental Fig. 1. Malate dehydrogenase (A), catalase (B), peroxidase (C), esterase (D), and phenylalanine ammonia lyase (E) activities of thirty rice cultivars.
Bimb H P, Sah R P, Karn N L. 2010. Isozyme variations in fine and aromatic rice genotypes.,5: 59–66.
Daviss B. 2005. Growing pains for metabolomics., 19(8): 25–28.
Fukushima A, Kusano M. 2014. A network perspective on nitrogen metabolism from model to crop plants using integrated ‘omics’ approaches., 65: 5619–5630.
Galal O A, Abo-Youssef M I, Abdelaziz M, Gharib A T, Dora S A. 2015. Assessment of genetic purity of some hybrid rice parental lines using protein profile and fertility restorer gene linked markers.,2(6):75–88.
Glaszman J C, de Los Reyes B G, Khush G S. 1988. Electrophoretic variation of isozymes in plumules of rice (L.) a key to the identification of 76 alleles at 24 loci., 134: 1–3.
Gong L, Chen W, Gao Y Q, Liu X Q, Zhang H Y, Xu C G, Yu S B, Zhang Q F, Luo J. 2013. Genetic analysis of the metabolome exemplified using a rice population., 110: 20320–20325.
Hussain A, Scanlon M G, Juliano B O, Bushu K W. 1989. Discrimination of rice cultivars by PAGE and HPLC.,66(4): 353–356.
Kandikattu H K, Venuprasad M P, Pal A, Khanum F. 2014. Phytochemical analysis and exercise enhancing effects of hydroalcoholic extract of., 55: 217–224.
Kandikattu H K, Rachitha P, Krupashree K, Jayashree G V, Abhishek V, Khanum F. 2015. LC-ESI-MS/MS analysis of total oligomeric flavonoid fraction ofand its antioxidant, macromolecule damage protective and antihemolytic effects., 22(4): 165–173.
Kim H K, Choi Y H, Verpoorte R. 2011. NMR-based plant metabolomics: Where do we stand, where do we go?, 29(6): 267–275.
Kusano M, Yang Z, Okazaki Y, Nakabayashi R, Fukushima A, Saito K. 2015. Using metabolomic approaches to explore chemical diversity in rice., 8(1): 58–67.
Laemmli U K. 1970. Cleavage of structural proteins during the assembly of the head of bacteriophage., 227: 680–685.
Nam M H, Bang E, Kwon T Y, Kim Y, Kim E H, Cho K, Park W J, Kim B G, Yoon I S. 2015. Metabolite profiling of diverse rice germplasm and identification of conserved metabolic markers of rice roots in response to long-term mild salinity stress., 16: 21959–21974.
Nerkar M, Rao G N. 1993. Studies on isozyme variability of rice (L.)., 19(3): 477–480.
Nethra N. 2007 Studies on varietal characterization based on morphological, biochemical and molecular markers in rice. [Master Thesis]. Bangalore, India: University Agriculture Science of Bangalore.
Pushpa C, Gowda R, Nethra N, Nataraj K, Uma Rani K, Gangaraju N. 2014. Identification of parental lines and rice hybrid (KRH-4) using protein and isozyme electrophoresis.: 2328–3491.
Rao P, Bharathi M, Reddy K, Keshavulu K, Rao L, Neeraja C. 2012. Varietal identification in rice () through chemical tests and gel electrophoresis of soluble seed proteins., 82(4): 304–311.
Rohini D D. 2000. Studies on the characterization of varieties based on morphological and biochemical traits in rice (L.). [Master Thesis]. Bangalore, India: University Agriculture Science of Bangalore.
Shion B B, Morishma H, Oka H I. 1994. A survey of variations in peroxidase, acid phosphatase and esterase isozymes of wild and cultivatedsp.,44(5): 303–319.
Venuprasad M P, Kandikattu H K, Razack S, Khanum F. 2014. Phytochemical analysis ofby LC-ESI-MS/MS and its antioxidant and anxiolytic effects., 92: 151–158.
Weckwerth W, Wenzel K, Fiehn O. 2004. Process for the integrated extraction identification, and quantification of metabolites, proteins and RNA to reveal their co-regulation in biochemical networks., 4(1): 78–83.
Yu W J, Wang X. 1989. Classification of sickle-shaped rice (L.) based on esterase isoenzymes.,3: 4–7. (in Chinese)
Zhou J, Ma C F, Xu H L, Yuan K L, Lu X, Zhu Z, Wu Y N, Xu G W. 2009. Metabolic profiling of transgenic rice withandgenes: An evaluation of unintended effects at metabolic level by using GC-FID and GC-MS., 877: 725–732.
Copyright © 2019, China National Rice Research Institute. Hosting by Elsevier B V
This is an open access article under the CC BY-NC-ND license (http://creativecommons.org/licenses/by-nc-nd/4.0/)
Peer review under responsibility of China National Rice Research Institute
http://dx.doi.org/10.1016/j.rsci.2018.08.007
8 March 2018;
28 August 2018
Hurugalavadi Puttaswamaiah Ranjitha (ranjuranjitha91@gmail.com)
(Managing Editor: Wang Caihong)

- Rice Science的其它文章
- Molecular Markers and Candidate Genes for Thermo-Sensitive Genic Male Sterile in Rice
- Morpho-Physiological Changes in Roots of Rice Seedling upon Submergence
- Classification and Identification of indica P/TGMS Lines in China
- Agrobacterium-Mediated Transformation of Rice: Constraints and Possible Solutions
- Comparative Efficacies of Next-Generation Insecticides Against Yellow Stem Borer and Their Effects on Natural Enemies in Rice Ecosystem
- Morphological and Molecular Characterization of Novel Salt-tolerant Rice Germplasms from the Philippines and Bangladesh