
Low Salinity Waterflooding; A Promising Prospect to Improve Oil Recovery in the Niger Delta Oil Fields
2019-08-05 09:23IhekoronyeIzuwaObah
K. K. Ihekoronye; N. C. Izuwa; B. O. Obah
[a]Petroleum engineering, Federal University of Technology Owerri,Nigeria.
Abstract Low salinity waterflooding is considered one of the most promising and cost–effective methods in oil recovery as a result of wettability change from oil-wet to waterwet. This work considered reducing the residual oil saturation by injection of low salt concentration in order to improve oil recovery. The objective of the study is to reduce the residual oil saturation. In this study,Simulation has been carried out on a synthetic model by using (ECLIPSE 100) as the simulator. Different Salinities of 500ppm,1000ppm, 1500ppm, 2000ppm, 5000ppm,7000ppm, 10000ppm,30000ppm and 40000ppm were evaluated. Low salinity water was injected at the first year of production and continues to the end of the production life.Effect of salinity on oil recovery was also evaluated.The results obtained showed that low salinity waterflooding improved oil recovery at different salinity as compared to fresh water waterflooding. In conclusion, based on the results of this work, it is possible to choose the best salinity ratio that gives the lowest residual oil saturation.
Key words: Low Salinity; Waterflooding; Residual oil saturation; Wettability change; Ion exchange; Mobility control
INTRODUCTION
The energy demand is increasing but discovery of huge reservoirs is scarce. The only solution to meet the energy demand is to maximize recovery from existing reservoirs.Low salinity waterflooding is an emerging EOR technique in which the salinity of the injected water is controlled to improve oil recovery. This EOR technique has recently found utility in oil industry to recover by-passed oil. Low salinity waterflooding has improved recovery through wettability alteration, reduction in interfacial tension,ionic exchange and mobilization of clay fines. The major concern will be to determine the appropriate injection scheme that will yield the best recovery. Corefloods and single-well chemical tracer tests have shown that the low salinity water flooding can improve basic water flooding recovery by about 5 to 38%.(Jerauld et al 2008)
Low salinity waterflooding (LSW) deals with several mechanism which involves the flooding of low saline water. Some techniques used to improve oil recovery in low salinity waterflooding alters the wettability of the rock(Lighthelmetal 2009)while other incorporate the concept of fine migration(Morrow etal 1998) and ion- exchange methods (Larger etal 2006). In this work, we want to establish a correlation between the salinity and oil recovery using a dimensionless number. Based on this expected result, it will be possible to determine the lowest possible low salinity adequate to recover the remaining oil. The study will also set limits on the concentration of salt required.
1. METHODOLOGY
In this study, we conducted numerical evaluation of low salinity waterflooding using these materials Well and reservoir data, and Eclipse Simulator used to generate field oil recovery, field oil production total, field pressure and field water cut. Table 1 shows the summary of the data used.
1.1 Reservoir Model Description
A Black oil model was designed using a centre blocked linear model geometry. The reservoir model was constructed to have grid block size of 20×20×10. Each grid cell is 250×250×50 (feet). The reservoirs have an area of 574 acre and made up of 4000 grids as shown in Figure 1.Thereservoir is assumed to be homogenous with respect to permeability and porosity. The simplistic reservoir model used in the simulation was built using the rock and fluid data obtained from reservoir Y-Field in the Niger Delta given in Table 1.

Figure 1 Reservoir model showinggrids

Table 1 Summary of the Reservoir Rock and Fluid Properties for Y-Field in the Niger Delta
1.2 Well Description
Four vertical oil producers (P1, P2, P3, and P4) were completed at the flange end of the oil zone for maximum reservoir contact. One water injector was drilled through the reservoir into the free water zone to maintain pressure,enhance sweep and displacement of the remaining oil.

Figure 2 Reservoir grid block and well connections
1.3 Aquifer Model
The aquifer was designed using a Carter Tracy aquifer model. This was attached to the designed reservoir model to enable fluid injection.The properties of the aquifer zone are shown in Table 2.

Table 2 Carter-Tracy Aquifer
1.4 PVT Model
The PVT model was defined in the reservoir simulation.When the BRINE keyword is activated in the RUNSPEC,PVTWSALT is used to supply the water PVT data for simulation. The keyword PVTDO is used to supply the dead oil PVT data.

Table 3 Oil and Water PVT
1.5 Initialization Sections
On initializing the model in Eclipse, approximately 220,000,000 rbof oil in place was obtained for this reservoir.The wells were connected to the reservoir. Injection water of different salinity was used to study the effect of salinity on oil recovery. During the study, different ratios of injection water salinity were used. These are shown in the several case studies in this work. Table 4, 5 and 6 shows the constraints used to control the simulation in the 3 cases.
1.6 Water and Oil Saturation Function
Relative permeability for water and oil, are also defined in the reservoir simulation as shown below in Figure 3.

Figure 3 Water/oil saturation function
1.7 Parameter Considered for AnaIysis
1.7.1 Fractional flow
This is the ratio of the water flow rate to the total rate (oil and water) .These flow rate are derived from Darcy’s law.The overall fractional flow of water for water-oil system is then obtained by Buckley-Leverett analysis/method shown in eqn (iv) or (v).

where fw = fraction of water in the flowing stream,bbl/bbl
qt = total flow rate, bbl/day
qw = water flow rate, bbl/day
qo = oil flow rate, bbl/day
Eqn i-ii is used for calculation of fractional flow of water for water-oil system which was done by Buckley-Leverett method. Sw,kroandkrware taken from PROPS section under keyword SWFN.


ᾀ1=0.8 , ᾀ2= 0.2, m=2, n=2

Figure 4 Fractional flow (fw) verses water saturation (sw)

Figure 5 A plot of fractional flow (fw) against water saturation(sw)
ii. Sweep efficiency
Uo= 35cp,Uw= 0.4 cp,Swi= 0.18,Soi=1-0.18=0.82
Total primary recovery = 16.5%
Sorp = 0.82-0.165 = 0.655
Total waterflood recovery = 42% = 0.42 ˟ Sorp (0.655)= 0.2751
Sorwf = 0.655-0.2751 = 0.3799 = 0.38

Table 4 Showing Sweep Efficiencies for Different Low and High Salinity

Continued
1.8 Reservoir Simulation
The Simulation was ran and evaluated for the following cases.
Case 1: performance simulation conducted for natural depletion
Case 2: Performance simulation conducted for fresh waterflooding
Case 3:Performance simulation conducted for difference low and high salinities.
1.8.1 Natural Depletion
This is the production of oil from the reservoir using the reservoir primary energy.

Table 5 Model constraint for natural depletion
1.8.2 Fresh Waterwaterflooding
This is the production of oil from the reservoir using the secondary recovery mechanism to maintain reservoir pressure and enhance reservoir sweep.

Table 6 Model Constraint for Waterflooding
1.8.3 Low Salinity Water Model
In this work, low salinity waterflooding injection was used to increase oil recovery; the salt is modeled as a single component in water phase. The option is activated by the keyword BRINE in the RUNSPEC section. Several mechanisms are involved in the displacement of oil by injection of low salinity water during production. This work allowed these mechanisms to play out during the injection.The mechanisms of low saline water (wettability change, fine migration and ion exchange) contributed to improved oil recovery in this study. The injection of low salinity water started from the first day of production and continues to the end of the production life.

Table 7 Model Constraint for Low Salinity Water
2. RESULT
2.1 Result Presentation
The results of low salinity waterflood simulation are shown in Figures 4 to 25 while Table 7 displays therecovery factor, oil production, water cut and time before water production. The results are presented based on the case studies.
2.1.1 Production Forecast for Natural Depletion

Figure 6Plot of recovery factor and cumulative oil production total against time for natural depletion

Figure 7 Plot of field water cut, pressure and production rate against time for natural depletion
2.1.2 Production Forecast for Waterflooding (fresh water)
The base case(BC)is the case of water flooding with fresh water. This flooding technique was evaluated to determine the recovery factor (FOE), field water cut (FWCT), field pressure (FPR), oil production rate (FOPR) and cumulative production total (FOPT).

Figure 8 Plot of recovery factor and cumulative oil production total against time for waterflooding with fresh water

Figure 9 Plot of field water cut, pressure and production rate against time for waterflooding with fresh water
2.1.3 Production Forecast for Low Salinity Water (500ppm)

Figure 10 Plot of recovery factor and cumulative oil production total against time for low salinity water (500 ppm).

Figure 11 Plot of field water cut, pressure and production rate against time for low salinity water (500ppm)
2.1.4 Production Forecast For Low Salinity Water (1000ppm)

Figure 12 Plot of recovery factor and cumulative oil production total against time for Low salinity water(1000ppm)
2.1.5 Production Forecast for Low Salinity Water (1500ppm)

Figure 14 Plot of recovery factor and cumulative oil production total against time for low salinity water (1500 ppm)
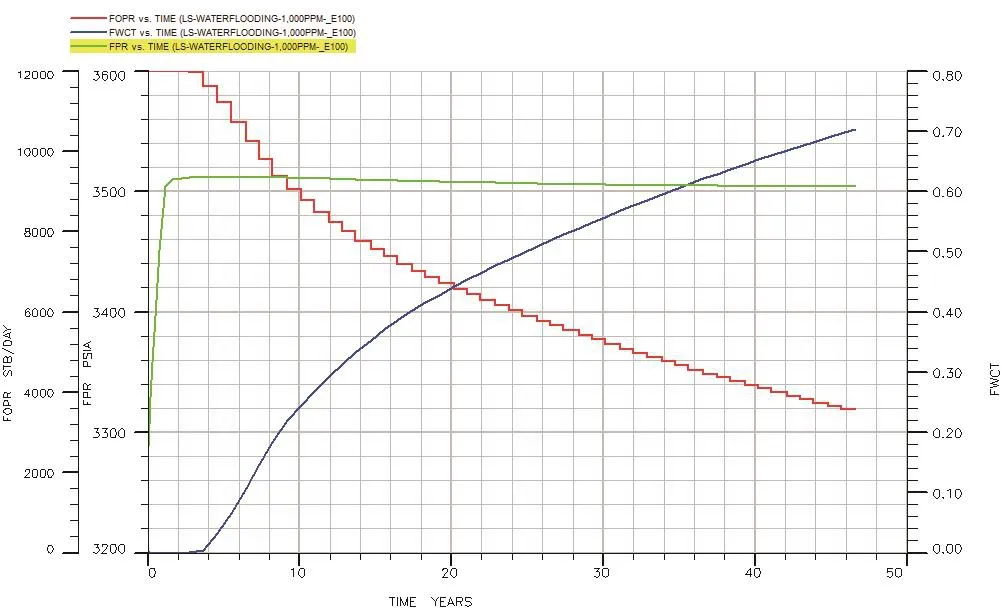
Figure 13 Plot of field water cut, pressure and production rate against time for low salinity water (1000 ppm)

Figure 15 Plot of field water cut, pressure and production rate against time for low salinity water (1500 ppm)
3.1.6 Production forecast for Low Salinity Water (2000ppm)

Figure 16 Plot of recovery factor and cumulative oil production total against time for low salinity water (2000 ppm).

Figure 17 Plot of field water cut, pressure and production rate against time for low salinity water (2000 ppm)
3.1.7 Production forecast for Low Salinity Water (5000ppm)

Figure 18 Plot of field water cut, pressure and production rate against time for low salinity water (5000 ppm)

Figure 19 Plot of recovery factor and cumulative production total against time for low salinity waterflooding (5000 ppm)
3.1.8 Production Forecast for Low Salinity Water (7000ppm)

Figure 20 Plot of recovery factor and cumulative production total against time for low salinity waterflooding (7000 ppm)
3.1.9 Production Forecast for Low Salinity Water (10000ppm)

Figure 22 Plot of recovery factor and cumulative production total against time for low salinity waterflooding (10000 ppm)

Figure 21 Plot of field water cut, pressure and production rate against time for low salinity waterflooding (7000ppm)

Figure 23 Plot of field water cut, pressure and production rate against time for low salinity waterflooding (10000 ppm)
3.1.10 Production Forecast for High Salinity Water (30000ppm)
High salinity (HS) with salt concentration 30,000 ppm is used as formation water. In this study, we assumed formation water has salinity equal to sea water that is 30000 ppm.

Figure 24 Plot of recovery factor and cumulative oil production total against Time for high salinity waterflooding(30000ppm)

Figure 25 Plot of recovery factor and cumulative oil production total against time for high salinity waterflooding (30000ppm)
3.1.11 Production Forecast for High Salinity Water (40000ppm)

Figure 26 Plot of recovery factor and cumulative oil production total against Time for High salinity (40000ppm)

Figure 27 Plot of recovery factor and cumulative oil production total against time for high salinity waterflooding (40000ppm)

Table 8 Result Comparison for Low and High Salinity Waterflooding
3.2 Discussion of Result
In natural depletion in Figure 6 and 7, oil recovery was observed to be 16.5 %. The oil production rate was maintained for one year and 4 months before oil production rate begins to drop drastically to the end of the production life of the reservoir. It was noticed that there was a sharp reduction in pressure as production continues. Field water cut was delayed for 1 and 3 months before water started coming out from the aquifer attached to the reservoir. The drop in pressure indicates that it is practically impossible to produce from this reservoir without an additional energy to improve oil recovery,reservoir sweep and maintain pressure. Figure 7 and 8, it was observed that field oil production rate was maintained to about 2 years before a drop in oil production rate, as water production rate was high. The drop in oil production rate continues at a point, when the drop in oil production rate reduces. Field water production was maintained at zero for 2 years before we started noticing water as production continues. Water production increased steadily up to 9 years when there is a decline in the rate of water cut. However, Oil recovery was improved to 42%from 16.5% natural depletion case. Field pressure was maintained throughout the production life of the reservoir.
From Figure 9-17, oil recovery was 52%, an additional recovery of 10% was observed as compared to waterflooding(fresh water). The field pressure was maintained throughout the production life of the reservoir.The field water cut was delayed to about 4 years that means more oil will be produced.
Figure 18-21, oil recovery decreases a bit to 49%when 5000ppm salinity was injected, while pressure was maintained all through the production period. Water cut delayed to about 3 years while the field oil production rate was maintained for 2 years before a gradual decrease in oil production rate.
Figure 22-25, oil recovery was observed to be 48%when salinity of 10,000ppm and 30,000 ppm was injected into the reservoir. Field pressure was maintained throughout the production period while field water cut delayed for 3 years.
Figure 26-27, Oil recovery reduces to 46% for 40,000 ppm salinity. Field water cut was high as oil production rate reduces drastically. This indicates that in high salinity waterflooding, early water breakthrough time might be encountered as water rate was high. The mechanisms of low salinity waterflooding play out during the injection of different salt concentration.
In table 9, it can be observed that at low salinity, oil recovery improves and salinity ratio increases from (0.01-1.00). However, high salinity of 30000ppm and 40000 ppm (0.80-1.00) is almost equivalent to formation water which is 1. From the research study, residual oil saturation reduces from 0.82 to 0.44 at high salinity of 30,000ppm and 40,000ppm. The increase in salinity ratio and decrease in residual oil saturation contributes to improve oil production in all cases of low and high salinity. In table 9 and 10, it can be noticed that water cut reduces at a point increases at high salinity. This means that oil production can be improved at reduced residual oil saturation and reduced ratio of injective salinity. Also, in Figure 25, it can be observed that oil recovery improves at low salinity than high salinity.

Table 9 Residual Oil Saturation (Sorw), Salinity and Salinity Ratio
3.2.1 Comparison of Result of the LS Case and HS Case
From the simulation study conducted, oil recovery was greatly improved at different salinity. In low salinity, oil recovery was higher as compared to high salinity. This is because the mechanisms of low salinity waterflooding was allowed to play out during the injection of low salinity water. The oil on the walls of the matrix of the rock were loose as low salt was injected, oil was displaced and mobilized. Hence, high recovery was recorded

Figure 29 Plot of residual oil saturation against salinity ratio
4. SENSITIVITY ANALYSIS
4.1 Effect of Salinity on Oil Recovery
Sensitivity analysis was carried out to examine the effect of salinity on oil recovery. Figure 27 illustrates oil recovery at different low and high salinity. It can be observed that oil recovery improved at salinity of (500-2000ppm) while at high salinity of 30000 and 40000ppm,oil recovery reduced. This means that at low salinity oil recovery is improved than high salinity as shown below in Figure 30.

Figure 30 Plots of oil recovery factor against salinity for LS and HS
CONCLUSION
Low salinity waterflooding was evaluated using rock and fluid properties of OML 11 F-Field in the Niger Delta. Eclipse reservoir engineering software was used to perform the reservoir simulation. In the simulation cases, waterflooding, low and high salinities of 500ppm,1000ppm, 1500ppm, 2000ppm, 5000ppm, 7000ppm,10000ppm, 30000ppm and 40000ppm was evaluated.Plots of field oil efficiency, oil production rates, field water cut and cumulative oil production against time were generated from the simulation study.
From the simulation results conducted in this work, the following conclusions are made:
i.Low salinity waterflooding gives a positive effect to improve oil recovery in all cases of low and high salinity.
ii. Residual oil saturation was reduced by subjecting it to waterfloods containing low salt concentrations.
iii The mechanism of fine migration, ion exchange and wettability change played a significant role in the effectiveness of oil recovery in low and high salinity.
iv. The result from the study will be useful in the industry for making choices of different salinity application and their various oil recoveries in the Niger Delta.
v.The lower the ratio of injection salinity to formation salinity , the lower the remaining oil (Sor) and the more the oil recovery increases.
vi. The optimal salinity is determined based on the economics of water treatment.
FractionaI FIow TabIe for Waterflooding
Sw Waterflooding fw 0.18 0 0.2 0.002826456 0.22 0.012345679 0.24 0.030221625 0.26 0.058139535 0.28 0.097580016 0.3 0.149501661 0.32 0.213973799 0.34 0.289855072 0.36 0.374653099 0.38 0.464684015 0.4 0.555555556 0.42 0.642857143 0.44 0.722840034 0.46 0.792880259 0.48 0.851627555 0.5 0.898876404 0.52 0.935275081 0.54 0.961995249 0.56 0.98044541 0.58 0.992063492 0.6 0.998189226 0.62 1
Relative Permeability of Oil and Water
To be continued
Sw kro krw 0.18 0.8 0 0.2 0.748484 0.000214
Continued
Sw kro krw 0.22 0.698682 0.000857 0.24 0.650595 0.001929 0.26 0.604222 0.003429 0.28 0.559563 0.005357 0.3 0.516619 0.007715 0.32 0.475389 0.0105 0.34 0.435874 0.013715 0.36 0.398072 0.017358 0.38 0.361986 0.021429 0.4 0.327613 0.025929 0.42 0.294955 0.030858 0.44 0.264011 0.036215 0.46 0.234781 0.042001 0.48 0.207266 0.048216 0.5 0.181465 0.054859 0.52 0.157379 0.061931 0.54 0.135007 0.069431 0.56 0.114349 0.07736 0.58 0.095405 0.085717 0.6 0.078176 0.094503 0.62 0.062661 0.103718 0.64 0.048861 0.113361 0.66 0.036775 0.123433 0.68 0.026403 0.133933 0.7 0.017746 0.144862 0.72 0.010802 0.156219 0.74 0.005574 0.168006 0.76 0.002059 0.18022 0.78 0.000259 0.192864 0.8 0.000174 0.205935
 Advances in Petroleum Exploration and Development2019年1期
- Advances in Petroleum Exploration and Development的其它文章
- Staged Premium Screen Completion Design for Horizontal Well Based on Laboratory Test: A Successful Application in Block 451, Shengli Oil Field
- Simulated Calculation of Bullheading Method When the Well is Empty
- Development of Organic Soil Suitable for Biodiesel-Based Drilling Fluids
- Study on the Affection of Drilling Tools’ Abrasion to the Regular Pattern of Tensile Strength
- Optimization Program for Difficult-to-Produce Reservoir in Bonan Oil Feild
- Producibility Scenario of Unidentified Productive Zone