
Water Content of Sweet Natural Gas: A Simplified Formula-Based Approach
2019-08-05 09:23UwaezuokeIzuwaOnwukwe
Uwaezuoke, N.; Izuwa, N. C.; Onwukwe, S. I.
[a]Department of Petroleum Engineering, Federal University of Technology, P.M.B 1526, Owerri, Imo State, Nigeria.
Abstract Gas with negligible or zero composition of hydrogen sulphide is sweet natural gas. During production,transportation and processing, the presence of traces of water can cause problems such as ice formation and/0r the problem of gas hydrates, increase in corrosion potential of the gas and two-phase flow problems if condensation occurs. Calculation of the water content at specified temperature and pressure conditions is the first step. A formula based approach of the calculation is proposed,and comparison with existing formulas presented.Application of the proposed formula in the specified ranges of temperature and pressure conditions of 15oC(59oF) to 48.8oC (119.84oF) and 1.07MPa (155.19 psia) to 10MPa (1450.38 psia) is recommended for sweet natural gases. A calculated Mean Absolute Percentage Deviation(MAPD) of 16.4077% from the experimental data is the statistical indicator used for validity check. It predicted better than some existing models which are adaptable under certain conditions. Only a hand-held device is required as the proposed model is highly simplified.
Key words: Mean Absolute Percentage Deviation;Natural Gas; Pressure; Temperature; Water Content
INTRODUCTION
During production, transportation and processing of natural gas, the presence of traces of water can cause problems such as ice formation and/0r the problem of gas hydrates, increase in corrosion potential of the gas and two-phase flow problems if condensation occurs.Charts, models and computer programs have been used to estimate the water content of natural gas at different conditions and mixtures.
Many authors have developed correlations that represent the curves in the charts such as in the McKetta and Wehe chart (Mcketta and Wehe, 1958) chart, in order to reduce the time and tediousness associated with graphical based calculations such as interpolation. Formulas for water content of sweet natural gases, typical of gases found in the Niger delta, have also been evaluated (Lin,et al., 2015).These formulas are adaptable under certain conditions of pressure and temperature (Lin,et al., 2015), hence,generalized accurate natural gas water content prediction formula remains a problem even after equations of state and computer programs were introduced.
This work re-examined the McKetta and Wehe(Mcketta and Wehe, 1958) chart and the aim was to propose a simplified formula for water content of sweet natural gas that also requires only pressure and temperature values. Validity was checked by comparing with other formula calculation methods, by the use of an experimental data with the aid of a statistical indicator. A range of temperature and pressure conditions where the formula predicts most accurately was recommended.
1. LITERATURE REVIEW
Several methods have been proposed for estimation of water content of natural gas. McKetta and Wehe(Mcketta and Wehe, 1958) developed a chart empirically for estimation of water content of a sweet gas, with corrections for salinity and gas gravity. An improved chart has also been developed (Guo and Ghalambor, 2005), with duplicated data of McKetta and Wehe nomographic chart.
Water content can also be determined from commercial softwares and models based on phase-equilibria (Alirezaet al.,2016, Haridyet al., 2002, Mohammadi and Richon,2008) at different conditions of temperature, pressure and mixtures. Some formula calculation methods have also been evaluated based on mean absolute percentage deviation (MAPD) (Equation 1), and ranges of temperature and pressure of adaptability recommended(Linet al., 2015).

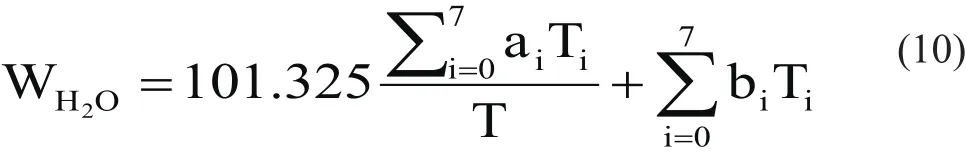
Other statistical indicators include R, predicted R2and adjusted R2(Equation 2, Equation 3 and Equation 4)

Where n is the number of experimental data, ae,iis the experimental values, ap,iis the predicted values, ae,aveis the average experimental values, ap,aveis the average predicted values and j is the number of input variables.
Several methods have been developed to determine the water content of acid gases (carbon hydroxide and hydrogen sulphide) and sour natural gases (significant amount of acid gas). A chart based method that provides good estimates for sour gases for a range of conditions exists (Wichert and Wichert, 2003).
Also, the Peng Robinson (PR-EoS), Soave-Redlich-Kwong (SRK-EoS) and Cubic-Plus-Association (CPA-EoS)equations of state and their combinations and improvements have also been used to estimate water content (Palmaet al., 2017, Chapoyet al., 2016, Li and Firoozabadi, 2009).Whereas the PR-EoS and SRK-EoS are the classic equations of state, the addition of CPA-EoS over twenty years ago was to account for contribution from hydrogen bonding in the form of association and solvation (Equation 5).

Other methods that have been used to predict water content of natural gas, with reliable data, a wide range of temperatures and pressures and mixtures of acid and natural gases have been highlighted (Haridy et al., 2002) to include;MacCarthy, et al. chart (1950), Katz chart (1956), Sharma and Campbell (1969), Campbell chart (1970), GPSA (1972),Robinson, et al. (1976), Sloan (1986), Gordon chart (1993),Kasim (1996) and Dalton’s Law.
However, the phase behavior of a natural gas stream with traces of water is shown in Figure 1.

Figure 1 Phase behavior of natural gas with traces of water (Christensen et al., 2004)
It is observed (Figure 1) that the gas phase and dissolved water (as vapor) can form a condensate (liquid water), ice/frost, or gas hydrate at the liquid water-gas,ice-gas, or hydrate-gas boundaries, respectively.
1.1 Some Existing Formulas
Equations 6 to 23 are the existing formulas for water content of sweet natural gas. They have been tested for conditions of adaptability (Lin et al., 2015) in terms of temperature, pressure and phase equilibria conditions.
i. Sloan’s formula;

It is based on nomographic chart and was derived based on low temperature data (15oC and 0.101325 MPa).
ii. Ning Yingnan’s formula;

Its derivation was based on the calibrated and McKetta-Wehe nomographic charts.
iii. Khaled’s formula;

It was derived based on high temperature data fit of the nomographic chart.
iv. Bahadori’s formula;

Derivation was based on numerical fitting.
v. Zhu Lin’s formula;
Derivation was based on the conclusion that sweet natural gas water content is inversely proportional to pressure and directly proportional to temperature.
vi. Behr’s formula;
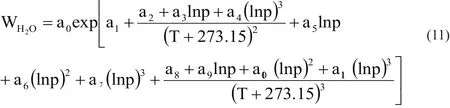
The work regarded water content as a function of natural log of pressure and reciprocal of Kelvin temperature unit.
vii. Kazim’s formula;

It was based on low temperature (T<37.78oC) and high temperature (37.78oC≤T≤82.22oC) data fitting.
viii. Saturated Vapour Pressure Model (SVPM);
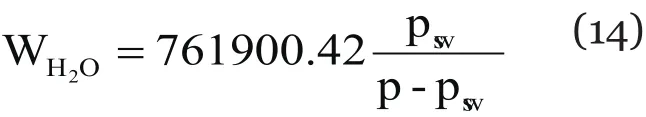

It estimates water content based on the law of partial pressures.
ix. Modified Ideal Model (MIM);

This is for gas-liquid equilibrium state

This is for gas-liquid equilibrium state
This formula is a correction for the ideal model and valid at low pressure of p<1.38MPa.
x. Simplified Thermodynamic Model (STM);

These are simplified models based on thermodynamic gas-liquid and gas-solid equilibrium.
xi. Bukacek’s formula;

This is a modification of ideal models of Behr’s and STM.
In Equations 6 to 23, WH2O=water content mg.m-3, aij,a0to a11are coefficients, P = absolute pressure of the gas,T = temperature of the gas, d = relative density, S = salt content, VH2O= m3/mol and a function of temperature, Pc= critical pressure of water (22.064 MPa), Tc= critical temperature of water (393.99oC),is the fugacity coefficient of water,λis a function of temperature and critical temperature, R is the universal gas constant of 8314 (m3.MPa) per (mol.K).
2. MATERIALS AND METHOD
2.1 Materials
Table 1 was created from some readings taken from McKetta and Wehe nomographic chart and used to duplicate the chart (Figure A.1). An MSExcel (version 2010) based regression tool from Data Analysis ToolPak under the add-ins was used to generate the formula(Equation 25). However, other commercial regression tools and statistical software packages such as Minitab®and Design Expert®exist.
An experimental data from literature (Linet al.,2015) was used to test the validity of the proposed formula, by the application of the statistical indicator,mean absolute percentage deviation (MAPD) (Equation 1). Simulation runs in Table 1 were generated by the use of the Design Expert.

Table 1 Simulation Runs of Water Content Readings From Table 2 for an Experiment (Lin, et al., 2015), analogous to McKetta and Wehe nomographic chart (Guo and Ghalambor, 2005, Mokhatab et al., 2006) at Standard Conditions of Temperature and Pressure
2.2 Method
The oil and gas industry have existing formulas for water content of sweet natural gas developed using different experimental data sets, extracts from McKetta and Wehe nomographic chart (Guo and Ghalambor, 2005,Mokhatabet al., 2006) and software packages. Similarly,in this work, the McKetta and Wehe nomographic chart and experimental results of water content of sweet gas were all applied. The independent variables, temperature and pressure were used as explanatory or predictor variables, while the dependent variable, the water content of sweet natural gas is the criterion variable. The logarithms of both the predictor and criterion variables were determined. The undefined values thereafter, due to negative or zero values of temperature read from the nomographic chart were eliminated. The model was build based on non-linear regression similar to the approach used in developing a proxy model for critical rate and optimum well placement (Onwukweet al., 2012). The proposed formula was applied to estimate the water content from the experimental data presented at different temperature and pressure conditions without consideration of the gas gravity and salinity, in accordance with adaptability analysis performed with experimental data(Linet al., 2015). The predicted values were compared with calculated water content values of eleven existing formulas (Table 2) for validation. Comparison of the results was made on the basis of mean absolute percentage deviation (MAPD) as used for the other formulas. Other statistical indicators applied include R, predicted R2and adjusted R2. Applicable ranges of temperature and pressure conditions have been recommended.
3. RESULTS AND DISCUSSION
3.1 Results and Comparison
With the protocol, using the non-linear least-squares fitting, with the sum of squared residuals computed and minimized, the temperature and pressure values that best represent the experimental data (Figure A.1) were used to generate the formula.
The new proposed formula is summarized and presented as Equation 25.

where VH2Ois the water content in lb/MMcf standard conditions, k is 8.99E-2, α is 2.6688, β is -0.8471, T is the temperature inoF and P is the pressure in psia.
Presented in Table 2 are the experimental values and the predicted values from existing formulas and the proposed formula (column #1) in mg.m-3.
From the statistical indicators applied, based on the procedures2, the R, predicted R2and adjusted R2are 0.9897, 0.7848, and 0.7669 respectively.

Table 2 Calculated and Experimental Water Contents (Lin, et al., 2015)

Figure 2 Comparison of the mean absolute percentage deviation (MAPD) of the models from the experimental data

Figure 3 Comparison of water content values of the proposed and existing formulas with the experimental data of twenty seven sets of pressure and temperature variations
3.2 Discussion and Model Validation
It was observed that increasing the temperature increases the water content, while increasing the pressure decreases the water content. The reverse is the case for both parameters. The predicted values of water content of the proposed formula with data (Linet al., 2015) compared quite fine with other existing formulas (Table 2). The MAPD from the experimental data was 16.4077%. The new formula performed better than Ning Yingman, Behr and Kazim’s formulas. The proposed formula predicted best under specified ranges of 15oC (59oF) to 48.8oC(119.84oF) and 1.07MPa (155.19 psia) to 10MPa (1450.38 psia) conditions. Also, by application of the analysis of variance statistics (ANOVA), the predicted R² of 0.7848 is in reasonable agreement with the adjusted R² of 0.7669,since the difference is less than 0.20.
Shown in Figure 3 are the predictions of the proposed and existing formulas in comparison with the experimental values. Different conditions of temperature and pressure were used in the predictions, based on similar conditions used in the experimental data provided.The conditions are shown in the insert in Figure 3. The points are represented on the abscissa, while the water content is the ordinate. The trends are similar, but some formulas are more adaptable in some conditions where they predict better (Linet al., 2015).
Methods with MAPD value of less than 10% include STM, Bahadori, Khaled, Sloan, Bukacek and Zhu Lin.Zhu Lin’s formula is the most precise from -50 to -40oC,Sloan’s formula for -40 to 0oC, STM for 0 to 37.78oC,Khaled’s formula for 37.78 to 171.11oC, and Bukacek’s formula for 171.11 to 237.78oC temperature ranges.
The proposed formula adaptable range of temperature is within the STM and Khaled’s formulas, though the points where they performed poorly have been neglected in determining the MAPD as shown in columns #4 and #11 in Table 2; whereas no point was neglected in calculating the MAPD for the proposed formula.
4. CONCLUSION AND RECOMMENDATION
4.1 Conclusion
The formula is very simple as water content could be obtained with a hand-held device. It predicted water content of a sweet gas, and compared with the experimental data with the mean absolute percentage deviation of 16.4077%. The value is within the range of other formulas evaluated and predicts better than Ning Yingman, Behr and Kazim’s formulas. Application of the proposed formula in the specified ranges of temperature and pressure conditions of 15oC (59oF) to 48.8oC(119.84oF) and 1.07MPa (155.19 psia) to 10MPa (1450.38 psia) would yield MAPD value less than 10%. Only a hand-held calculator is required as the proposed model is highly simplified.
4.2 Recommendation
It is recommended to apply the proposed formula in the combined ranges of temperature and pressure conditions of {15oC (59oF) ≤ T ≤ 48.8oC (119.84oF)} and {1.07MPa(155.19 psia) ≤ P ≤ 10MPa (1450.38 psia)}. This is in line with the other recommendations made after making an evaluation of the other eleven existing correlations/formulas, and their adaptability analyses.
APPENDIX
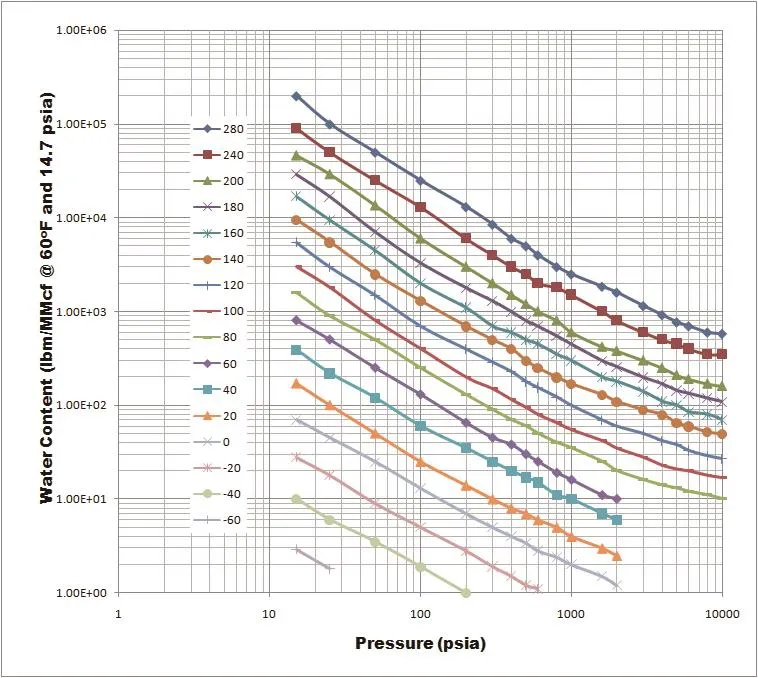
Figure A. 1 Water content of sweet natural gases (duplicated by authors with data of McKetta and Wehe (McKetta and Wehe,1958)
 Advances in Petroleum Exploration and Development2019年1期
- Advances in Petroleum Exploration and Development的其它文章
- Staged Premium Screen Completion Design for Horizontal Well Based on Laboratory Test: A Successful Application in Block 451, Shengli Oil Field
- Simulated Calculation of Bullheading Method When the Well is Empty
- Development of Organic Soil Suitable for Biodiesel-Based Drilling Fluids
- Study on the Affection of Drilling Tools’ Abrasion to the Regular Pattern of Tensile Strength
- Optimization Program for Difficult-to-Produce Reservoir in Bonan Oil Feild
- Producibility Scenario of Unidentified Productive Zone