三羟基咔咯及其镓配合物与DNA的相互作用、光断裂和光动力抗肿瘤活性
2019-09-09 08:08汪华华WaseemAkram孙艳梅廖玉辉司利平刘海洋张启光
无机化学学报 2019年9期
陈 璇 汪华华 Waseem Akram 孙艳梅 廖玉辉 司利平 刘海洋*, 张启光
(1华南理工大学化学系,广东省功能分子工程重点实验室,广州 510641)
(2南方医科大学皮肤病医院分子诊疗中心,广州 510091)
(3佛山科学技术学院材料科学与能源工程学院,佛山 528000)
(4Department of Chemistry,Michigan State University,E.Lansing,MI 48824,USA)
0 Introduction
Porphyrin derivatives have multiple applications in biology and medicine such as photodynamic therapy[1-2]and tumor imaging[3-4].Some of them have even been used in clinical diagnosis[5-8].Corrole is a member of porphyrin family macrocycles[9-10],whose potential anticancer application has greatly pushed the development of corrole-based bioinorganic chemistry[11-12].In 2006,Chang et al.found that monohydroxyl corrole exhibited excellent photodynamic therapy activity against NPC tumor cells[13].Gross et al.also found the cytotoxicity of sulfonic gallium corrole could be enhanced by light irradiation due to the generation of reactive oxygen species (ROS)[14].Recently,tris(ethoxycarbonyl)gallium corrole was proved with high in vitro and in vivo photodynamic antitumor activity[15].These observations demonstrated corrole is a kind of the promising photodynamic anticancer agents,and study on the design and synthesis of corrole-based photosensitizers has become a hot topic in current porphyrin chemistry[16].It was found that cationic gallium pyridyl corrole could stabilize G-quadruplex DNA which is a target of antitumor medicine[17].Thus,study on the interaction between corrole derivatives and DNA may also helpful to give more insight into their role in antitumor activity. In fact,the photonuclease activity and DNA binding property of many water-soluble corrole derivatives,including sulfonated[18-19],carboxyl[20],pyridyl[21-22],methyl benzoate corrole[23],have been documented,which shows these corroles exhibit good DNA-binding affinity and nuclease like activity under light irradiation.
Previously,we found polyhydric corrole exhibited significant photonuclease activity and photocytotoxicity towards tumor cells[24].To further extend the scope of hydroxyl corrole along this line,herein we report the synthesis of a new 10-(4-hydroxyphenyl)-5,15-bis(4-(2-hydroxyethyl)-amino-2,3,5,6-tetrafluorophenyl)corrole(1),which bears two ethyl-hydroxyl groups and one hydroxyl group on periphery phenyl groups (Scheme 1).Its gallium complex 1-Ga as well as their DNA binding properties,photonuclease activity and in vitro photo-cytotoxicity against human carcinoma cell lines were studied.
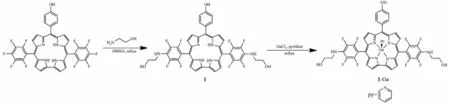
Scheme 1 Synthetic route of corrole 1 and 1-Ga complex
1 Experimental
1.1 Chemicals and measurements
10-(4-hydroxylphenyl)-5,15-bis(pentafluorophenyl)corrole was prepared by the reported method[13].Calf thymus DNA(CT-DNA)and Supercoiled(SC)pBR322 DNA were purchased from Sigma-Aldrich.Dimethyl sulfoxide(DMSO),tris(hydroxymethyl)aminomethane(Tris),ethidium bromide(EB),N,N-dimethylformamide(DMF),boric acid(H3BO3),superoxide dismutase(SOD),ethylenediaminetetraacetic acid(EDTA)and sodium chloride were supplied by Shanghai Sangon Company.Thiazolyl blue tetrazolium bromide (MTT)and 9,10-diphenylanthracene (DPA)were supplied by Adamas Reagent Company.Annexin V-FITC Apoptosis Detection Kit(C1062),cell cycle and apoptosis analysis kit(C1052),JC-1(C2006),DAPI(C1002)and DCFH-DA(S0033)kits were obtained from Beyotime Biotechnology.BufferⅠ solution(pH=7.2):containing 5 mmol·L-1Tris-HCl and 50 mmol·L-1NaCl;buffer Ⅱsolution (pH=7.2):containing 50 mmol·L-1Tris-HCl and 18 mmol·L-1NaCl;buffer Ⅲ solution (pH=8.3):containing 89 mmol·L-1Tris,89 mmol·L-1H3BO3and 20 mmol·L-1EDTA.All solutions for biological assays were prepared by using Ultrapure water and LED lamp(650 nm,DB-E27-5W,Likaijin)was used as light sources.MCF-7,HepG2 and A549 tumor cells were supplied by the American Type Culture Collection.
1H,19F and13C NMR spectrograms were obtained in DMSO-d6solvent by a Bruker DRX-400 spectrometer.HR-MS spectra were obtained by VG ZAB-HS mass spectrometer.Hitachi 3900H UV-Vis spectrometer,Perkin-Elmer LS55 fluorescence Spectrophotometer and Jasco-J810 spectrometer were used in electronic spectroscopy,fluorescence quenching,and circular dichroism spectroscopy studies,respectively.Viscosity test was carried out by Ubbelohde viscometer.DYCP-31CN electrophoresis cell and Gel Doc XR system were used for Gel electrophoresis testing.Tumor cells were visualized by a TE2000-E inverted fluorescence microscope.
1.2 Synthetic methods
1.2.1 Synthesis of corrole 1
A mixture of 10-(4-hydroxylphenyl)-5,15-bis(pentafluorophenyl)corrole (72 mg,0.1 mmol)and 2-aminoethanol(400 μL,6.7 mmol)in 15 mL DMSO solvent was refluxed for 2 h.After cooling down to room temperature,50 mL CH2Cl2was added.Then,the mixture was washed with saturated salt water for three times to remove DMSO and excessive ethanolamine,the organic phase was collected and dried with anhydrous sodium sulfate.After filtration,CH2Cl2was removed by rotatable evaporation to afford crude product.The purple product corrole 1 was obtained by silica gel chromatography with CH2Cl2/CH3OH(100∶3,V/V)mixture as eluent.Yield:79.0%.UV-Vis(CH2Cl2),λmax/nm(ε/(L·mol-1·cm-1)):417(9.77×105),569(1.51×105),616(1.05×105).1H NMR(400 MHz,DMSO-d6):δ 9.12(s,2H),8.81(s,2H),8.56(s,4H),7.93(d,J=7.5 Hz,2H),7.19(d,J=7.4 Hz,2H),6.21(s,2H),4.94(s,2H),3.77(s,4H),3.65(s,4H).19F NMR(376 MHz,DMSO-d6):δ-143.08(d,J=18.0 Hz),-160.43(d,J=18.2 Hz).13C NMR (151 MHz,DMSO-d6):δ 157.01(C29),146.77(C9,C11),145.19(C6,C14),137.51(C21,C25,C27,C31,C33,C37),135.94(C22,C24,C28,C30,C34,C36),135.34 (C1,C4,C16,C19),132.18(C7,C13),129.17(C3,C8,C12,C17),116.41(C2,C18),114.21(C20,C26,C32),111.91(C23,C35),103.86(C5,C15,C10),60.82(CNH),47.35(COH)(Supporting Information,Fig.S4).Elemental Anal.Calcd.for C41H28F8N6O3(%):C,61.20;H,3.51;N,10.44.Found(%):C,61.17;H,3.49;N,10.40.HR-MS m/z:Calcd.for C41H29F8N6O3([M+H]+):805.217 3,Found:805.216 8.
1.2.3 Synthesis of 1-Ga
Under argon atmosphere,corrole 1 (40 mg,0.1 mmol)and dry GaCl3(100 mg,0.6 mmol)were dissolved in 15 mL pyridine and refluxed for 1.5 h.After cooling to room temperature,50 mL CH2Cl2was added to the reaction mixture.The reaction mixture was washed more than five times with saturated salt water.Then the organic phase was collected and CH2Cl2was removed by rotatable evaporation to afford crude product.Final product was obtained by silica gel chromatography with CH2Cl2/CH3OH/pyridine (100∶7∶0.5;V/V)as eluents.Yield:85%.UV-Vis(CH2Cl2),λmax/nm(ε/(L·mol-1·cm-1)):422(9.55×105),534(3.72×104),574 (8.32×10⁴),608 (1.70×10⁵).1H NMR(400 MHz,DMSO-d6):δ 9.78(s,1H),9.24(d,J=3.7 Hz,2H),8.87(d,J=4.1 Hz,2H),8.77(s,2H),8.68(d,J=4.5 Hz,2H),8.55(d,J=4.2 Hz,2H),7.94(d,J=8.0 Hz,2H),7.78(t,J=7.6 Hz,1H),7.38(dd,J=7.4,5.6 Hz,2H),7.18(d,J=8.1 Hz,2H),6.08(s,2H),4.97(t,J=5.3 Hz,2H),3.78(dd,J=11.5,5.8 Hz,4H),3.64(d,J=5.9 Hz,4H).19F NMR (376 MHz,DMSO-d6):δ-142.06(s),-160.49(s).13C NMR(151 MHz,DMSO-d6):δ 156.64(C29),149.50(Cpyridine-o),143.71(C9,C11),141.08(C6,C14),137.07(Cpyridine-p),136.08(C21,C25,C27,C31,C33,C37),134.92 (C22,C24,C28,C30,C34,C36),133.91(C1,C4,C16,C19),132.35(C7,C13),129.60(C3,C8,C12,C17),123.85(Cpyridine-m),116.34(C2,C18),114.09(C20,C26,C3),110.87(C23,C35),98.01(C5,C15,C10),60.75(CNH),47.44(COH)(Fig.S8).Elemental Aanal.Calcd.for C46H30F8N7O3Ga(%):C,58.13;H,3.18;N,10.32.Found(%):C,58.09;H,3.14;N,10.29.HR-MS m/z:Calcd.for C41H25F8N6O3Ga([M-Py]+):870.111 6,Found:870.111 1.
1.3 Absorption spectroscopic assay
In electronic absorption titration assay,we kept the concentrations of compounds constant and record the absorption values after continuous addition of 2 μL CT-DNA(1.5 mmol·L-1).The intrinsic binding constant(Kb)of the compound is determined by following equation[25]:

where εfand εbare extinction coefficient of the compound when incompletely and completely bind to DNA respectively;εais the extinction coefficient of the compound in the presence of DNA,and cDNAis the concentration of DNA.By graphing the plot of cDNA/|εa-εf|versus cDNA,Kbmightbe calculated by y-intercept.
1.4 Fluorescence titration assay
A solution(3 mL)containing 30 μmol·L-1CTDNA and 5 μmol·L-1EB in buffer Ⅰ solutions was titrated with increasing the amount of compound and measured after incubated for 3 min.The quenching constants (KSV)is obtained by the following Stern-Volmer equation[26]:

where ccompoundis the concentration of compound,F0and F are the fluorescence intensities in the absence and presence of the compound,respectively.
1.5 Circular dichroism spectral studies
CD spectra were recorded with polarimeter by using a 1 cm quartz cell with scanning wavelength number from 600 to 200 nm.We kept CT-DNA at a constant concentration and added the compounds with suitable concentrations,and all CD spectra were recorded three times and background was automatically subtracted.
1.6 Viscosity studies
Viscosity test was conducted by Ubbelohde viscometer in a thermostatic (30.0℃±0.1℃)water bath.The flow times were recorded by digital stopwatch with the concentration of the compound increasing,which was taken the average value of five times.The result was presented as(η/η0)1/3vs ccompound/cDNA,where η and η0are the relative viscosity of CT-DNA in the presence and absence of the compound,respectively.Specific viscosity is evaluated by the equation[27]:
Where t0and t are the flow time of CT-DNA in the absence and presence of the compound,respectively.
1.7 Molecular docking studies
AutoDock Tools(ADT)v1.5.6 was used to perform molecular docking.The DNA(d(CGCGAATTCGCG)2)structure data was got from the Protein Data Bank(PDB ID:1BNA).The geometry of corrole derivatives was optimized with Gaussian 09.The DNA duplex was enclosed in grid dimensions(6 nm×6 nm×6 nm)and a grid spacing of 0.037 5 nm.Kollman method incorporated in AutoDock software was used for docking calculations.The lowest energy docked conformation was chosen as the binding mode[28].
1.8 DNA cleavage assay
The photocleavage activity assay was performed by using agarose gel electrophoresis.The reaction mixtures were in a total volume of 10 μL,containing supercoiled pBR322 DNA (0.1 μg)and different concentrations of complexes in bufferⅡ(10%DMF).Then the mixture was put under the filament lamp and irradiated for 2 h.After staining with an EB dilute solution,DNA bands were captured by using Gel Doc XR system.The photocleavage mechanistic studies were performed by using multiple reactive oxygen species scavengers.
1.9 Cytotoxic activity assays
Cells(MCF-7,HepG2,A549)in 100 μL of medium containing 10%fetal bovine serum were seeded in 96-well plates (5×10³cells per well)and incubated overnight in cell incubator(37℃and 5%(V/V)CO2).In the treatment of 1 and 1-Ga,DMSO (final concentration≤1%in the test culture)was used as a solvent to prepare different concentrations of the drug and diluted with the cell culture medium.There were 5 multiple pores in each group.After incubation for 2 hours and irradiation treatment by red light for 1 hour,cells were further incubated for 48 hours.Removed the medium with drugs,100 μL of MTT containing medium (250 μg·mL-1)was then added to each well carefully.The cells were incubated for three hours,optical density(OD)value were calculated by using a microplate spectrophotometer at 490 nm.The IC50value was obtained by Graph Pad Prism 7.0 software and represents the mean of five independent experiments.
1.1 0 Reactive oxygen species(ROS)detection in cells
HepG2 cells suspended in 2 mL of culture medium were seeded in 6-well plates(1×10⁵cells per well)and cultured overnight in cell incubator.Then the cells were incubated with 1(0.1 μmol·L-1)and 1-Ga(5 μmol·L-1)and treated with the same illumination condition as previously described above.After cultured cells for 24 h,the medium was removed.According to the instruction of test kit,cells were stimulated with suitable concentration of DCHF-DA for 30 min under the dark.The fluorescence image acquisitions were performed by fluorescence microscope.
1.1 1 Mitochondrial transmembrane potential analysis
HepG2 cells suspended in 2 mL of culture medium were plated into 6-well plates (1×10⁵cellsperwell)and cultured overnight under dark.Then the cells were incubated with 1(0.1 μmol·L-1)and 1-Ga (5 μmol·L-1)and irradiated with the same illumination condition as previously described above.After being treated by using JC-1 kits and washed with PBS buffers more than three times,cells photos were obtained by using TE2000-E inverted fluorescence microscope.
1.1 2 Flow cytometry analysis
HepG2 cells were seeded into 6-well plates(1×10⁶cells per well)and incubated overnight.The cells were incubated with 1 (0.1 μmol·L-1)and 1-Ga(5 μmol·L-1)and irradiated with the same illumination condition as described above.Adherent cells were washed and dealt with pancreatin.According to the manufacturers operating instruction,cells were incubated with Annexin V-FITC after re-suspended and centrifuged.The cell cycle assay was performed by propidium staining.Data acquisition and analysis were implemented by a FACS Calibur flow cytometer and FlowJo10.0 Software respectively.
2 Results and discussion
2.1 DNA interaction and photocleavage
The UV-Vis spectra titration is one of simplest techniques for detecting DNA binding mode.Intercalation binding will cause a significant red shift and a large hypochromic effect,while external binding brings a slight red shift and a smaller hypochromic effect in the spectra[29].As shown in Fig.1,with the addition of DNA,only small hypochromic and bathochromic shift of the spectra could be observed.This suggested an outside binding mode between these corroles and CT-DNA[18,30].The intrinsic binding constants Kbfor 1-Ga and 1 are 1.69×10⁵and 1.13×10⁵L·mol-1,respectively.1 and 1-Ga showed the same binding affinity to CT-DNA.Spectroscopic titration data are summarized in Table 1.

Fig.1 UV-Vis spectra changes of 10 μmol·L-1 1(a)and 1-Ga(b)with increasing concentration of CT-DNA
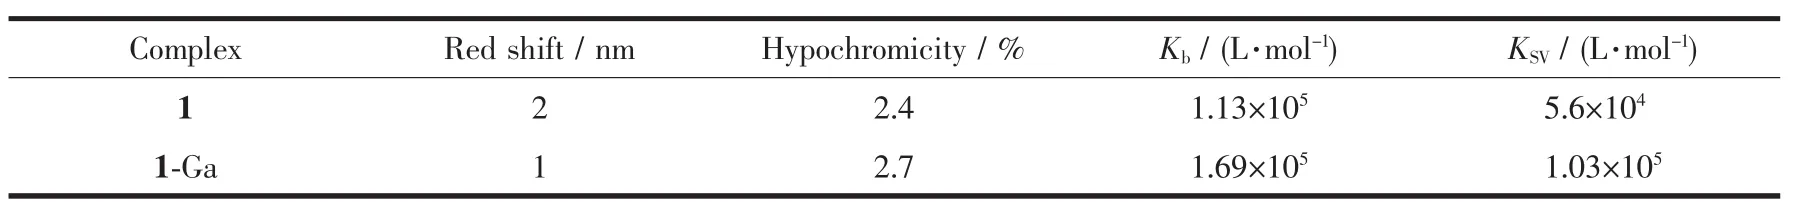
Table 1 Spectroscopic titration data of corrole 1 and 1-Ga binding with CT-DNA
EB shows weak fluorescence in buffer solution,but exhibits strong fluorescence after inserting into the base pair of DNA[31].Thus,EB is often used as the fluorescence probe to detect the interaction between small molecules and DNA.Fig.2 is the fluorescence spectra changes of EB/CT-DNA upon the addition of 1-Ga and 1.The EB fluorescence decreased remarkably with the increasing of the concentration of both corroles.As EB is a strong intercalator,the replacement of EB by corrole is not possible.The fluorescence quenching of the system is caused by the dynamic or static process of the interaction between the EB/CTDNA and corroles.The Stern-Volmer quenching rate constants KSVfor 1 and 1-Ga were 5.6×10⁴and 1.03×10⁵L·mol-1,respectively,indicating strong interactions between CT-DNA and these corroles.The KSVresults are also comparable to the absorption titration assay.
CD spectra is sensitive to DNA conformation transformation during complexes-DNA interactions.The outside binding of the complex causes little variation on the base stacking and helical structure of DNA,and there are no significant changes in CD spectra could be observed.But intercalation binding mode will cause the remarkable enhancement of both CD peaks of CT-DNA[32].CD spectral changes of CTDNA upon the addition of 1 and 1-Ga are shown in Fig.3.Small decrease in both CD signal intensity of CT-DNA were observed when binding 1 and 1-Ga,excluding the intercalation interaction mode.Noteworthy,no exciton coupling CD peaks were observed in the Soret band of corrole in both cases,indicating the outside binding corrole 1 or 1-Ga are not ordered in a chiral manner.

Fig.2 Fluorescence spectra changes of EB bind to CT-DNA with increasing concentration of 1(a)and 1-Ga(b)
Viscosity measurement is the most important method for investigating DNA binding mode in lack of crystal data.Intercalation binding will result in the viscosity increase remarkably,while outside binding has little effect on the viscosity[33].The viscosity of CTDNA did not change obviously with the addition of corrole indicating 1 and 1-Ga interact with CT-DNA via an outside binding mode.This is in accordance with the spectroscopic titration results.
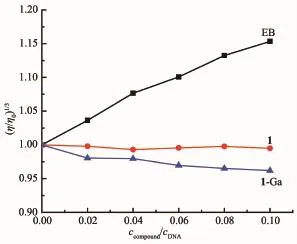
Fig.4 Effect of concentration of 1,1-Ga and EB on relative viscosity of 0.1 mmol·L-1 CT-DNA
To further investigate the interaction between 1 and 1-Ga and DNA,we have also performed molecular docking simulations.The energy-minimized molecular docking simulated conformation of duplex DNA and 1 or 1-Ga are shown in Fig.5,which reveals that both corroles interact with DNA in major groove.Corrole 1 situated around DA18,DA17,DA6,DA5,DG4,DT19 and DC3 base pairs.One H-bond between amino-ethyl hydroxyl group and DG16 base.While 1-Ga was found situated around DA18,DA17,DA6,DA5,DG3 and DG4 base pairs.Except for one H-bond between phenyl hydroxyl and DC3 base,one phenyl group was observed partially intercalated into DA5-DA6 base pair.The binding energy for 1 and 1-Ga were-27.8 and-34.8 kJ·mol-1respectively,showing 1-Ga has higher binding affinity to DNA.
Many corrole complexes show photonuclease activity[24,34].DNA photocleavage efficiency of 1 and 1-Ga were evaluated by using pBR322 DNA.As shown in Fig.6,no cleaved plasmid DNA could be observed for control or test sample under dark condition.After light irradiation for 2 h,both 1 and 1-Ga exhibited significant photonuclease activity and supercoiled pBR322DNA(FormⅠ)was transformed to nicked form(Ⅱ) with 1-Ga showing better performance.When corrole concentration reached 160 μmol·L-1,90%and 50%supercoiled pBR322DNA was transformed to nicked form Ⅱ for 1-Ga and 1,respectively.Interestingly,form Ⅲ DNA was observed for 1-Ga when its concentration was 20 μmol·L-1(Fig.6b,lane 4).

Fig.5 Molecular docked structure of 1(a)and 1-Ga(b)with DNA

Fig.6 DNA photocleavage at different concentrations of 1(a)and 1-Ga(b)with 2 h irradiation
To check the reactive oxygen species(ROS)involved in DNA photo-cleavage by corrole,inhibitation tests were carried out by using different oxidant inhibitors (Fig.7).The reagent NaN3(lane 4)is the scavengers of singlet oxygen (1O2),KI(lane 5)is the scavenger of hydroxyl radical(·OH)and SOD(lane 6)is the scavenger of superoxide anion radical (·O2-).NaN3inhibitor could remarkably inhibit the DNA cleavage by 1,indicating singlet oxygen was the main ROS involved.While for 1-Ga,both NaN3and KI were observed to inhibit the DNA cleavage obviously.This suggests singlet oxygen and hydroxyl radical are involved in 1-Ga.SOD had small inhibition effect to DNA cleavage by 1 and no effect to the DNA cleavage by 1-Ga.

Fig.7 DNA photocleavage in the presence of oxidant inhibitors:(a),20 μmol·L-1 1;(b)20 μmol·L-1 1-Ga after irradiation for 2 h
2.2 Photodynamic antitumor activity cytotoxicity
The cytotoxicity of 1 and 1-Ga was evaluated by MTT method by using three tumor cell lines MCF-7(breast),HepG2 (liver)and A549 (lung).Temoporfin(mTHPC,the second generation PDT clinical drug)was used as the control under the same experimental conditions.The IC50[35]of 1 and 1-Ga were calculated by graphing analysis of dose-response curves and summarized in Table 3.Both 1 and 1-Ga exhibited excellent photocytotoxicity to all tested tumor cell lines.Especially,1 showed better PDT performance than mTHPC,indicating it is a promising candidate for PDT drug.For HepG2 and A549 tumor cell,1-Ga exhibited significant lower photocytotoxcity than 1.Their dark cytotoxicity is around three times stronger than mTHPC and 1-Ga displayed higher dark cytotoxicity than 1.It could be observed that MCF-7 was much sensitive to 1-Ga than HepG2 and A549 tumor cells.
The generation of ROS,especially singlet oxygen,is closely related to the cell death in PDT treatment.Here,fluorescence microscope was used to detect the cellular ROS level changes.2′,7′-dichlorodihydrofluorescein diacetate(DCFH-DA)and Rosup was used as a fluorescent dye and positive control respectively.DCFH-DA is a non-fluorescent dye,which could be oxidized to the fluorescent compound DCF with green fluorescence.Fig.8 shows qualitative detection of ROS generation in HepG2 cells.Green emission was observed after PDT treatment by 1 and 1-Ga,showing that cellular ROS level increased.This imply the photocytotoxicity of 1 and 1-Ga may relate to the oxidative stress reaction of the tumor cells.
The destruction in mitochondrial membranepotential(MMP)is related to cytochrome c triggered cell apoptosis[36].MMP changes may be monitored by using the JC-1 fluorescent dye.JC-1 forms aggregates and emit red fluorescence in the normal mitochondrial matrix.It will be in its monomer form and emit green fluorescence when the MMP decreases.Carbonyl cyanide 3-chlorophenylhydrazone (CCCP) could promote the permeability of mitochondrial inner membrane to H+and destruct the MMP.Here,CCCP is used as the positive control for MMP detection.As shown in Fig.9,green fluorescence could be observed after PDT treatment with 1 and 1-Ga,which is similar to the treatment by CCCP.This indicates the PDT treatment by 1 and 1-Ga causes MMP destruction,which may further trigger tumor cell apoptosis.

Table 2 IC50 values of corroles against tumor cells

Fig.8 Effect of 1(0.1 μmol·L-1)and 1-Ga(5 μmol·L-1)PDT treatment on the intracellular ROS in HepG2 cells with DCHF-DA as fluorescence probe at 200×magnification

Fig.9 Effect of PDT treatment by 1(0.1 μmol·L-1)and 1-Ga(5 μmol·L-1)on mitochondrial transmembrane potential of HepG2 cells at 200×magnification

Fig.10 Flow cytometric diagram of HepG2 cells after PDT treatment by 0.1 μmol·L-1 of 1 and 2 μmol·L-1 of 1-Ga
Fig.10 shows the flow cytometry diagram double labeled by FITC and PI fluorescence dyes.Quadrant 2,3 and 4 are assigned as late-stage apoptotic cells,early-stage apoptotic cells and living cells,respectively.Significantly,late-or early-stage apoptotic tumor cells could be observed after PDT treatment by 1 or 1-Ga,suggesting the tumor cells die via apoptotic pathway.
The regulation of cell death is also related to alterations of cell cycle.Tumor cell cycle arrest means the block of DNA synthesis.The cell cycle distribution may be easily checked with flow cytometry by using propidium iodide (PI)fluorescence probe.The cell cycle distribution is shown in Fig.11.After PDT treatment,1-Ga could remarkably arrest the cell cycle at G2/M phase and 1 exhibited little effect to the cell cycle distribution.
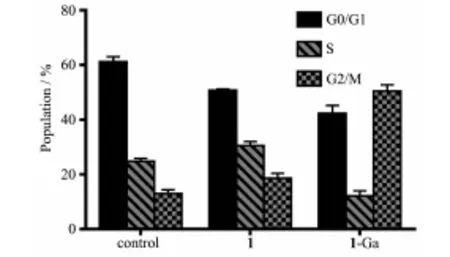
Fig.11 Cell cycle distribution of HepG2 cells after PDT treatment
3 Conclusions
In summary,a new hydroxyl corrole 1 and its metal complex 1-Ga had been synthesized.Both 1 and 1-Ga complex interact with CT-DNA via outside binding mode.1-Ga displays higher DNA binding affinity than 1,which is also supported by molecular docking binding energy.Both 1 and 1-Ga could cleave supercoiled pBR322 DNA efficiently after irradiation.Singlet oxygen (1O2)is the main active oxidant for 1,while singlet oxygen and hydroxyl radical are involved for 1-Ga photonuclease activity.Furthermore,1 and 1-Ga exhibit strong photocytotoxic toward breast,hepatoma,and lung cancer cells.After PDT treatment,1-Ga can induce cell cycle arrest at G2/M phase.The present observation suggests that corrole PDT treatment will promote the cellular ROS level,destruct the mitochondrial transmembrane potential and finally induce the tumor cell apoptosis.Investigation on the detailed signaling pathway of the tumor cell apoptosis is still going on in our laboratory.
Acknowledgments:This work was supported by National Natural Science Foundation of China(Grant No.21671068).
Supporting information is available at http://www.wjhxxb.cn
猜你喜欢
佛山陶瓷(2022年9期)2022-10-09
现代装饰(2021年5期)2021-12-02
太空探索(2021年6期)2021-06-16
太空探索(2021年3期)2021-03-19
太空探索(2021年2期)2021-02-27
宝藏(2020年4期)2020-11-05
太空探索(2020年2期)2020-03-09
绿色中国(2019年13期)2019-11-26
美与时代·城市版(2019年8期)2019-11-04
科学中国人(2017年36期)2017-06-09