
单层和双层二硫化钼化学气相沉积生长的动力学蒙特卡罗模拟研究
2019-10-14 07:56陈帅高峻峰SRINIVASANBharathi张永伟
物理化学学报 2019年10期
陈帅,高峻峰,SRINIVASAN Bharathi M.,张永伟
新加坡科技研究局高性能计算研究院,新加坡 138632
1 Introduction
Two-dimensional (2D) materials, such as graphene,phosphorene, transition metal dichalcogenides (TMDs), have attracted a great deal of attention due to their fascinating lattice structures and unusual physical properties1-4. 2D MoS2, a member in the TMD family, is a semiconductor with a large band gap, high on/off ratio and high mobility5-7, promising for many interesting electronic and energy applications. However, layer number of 2D MoS2can drastically change its physical properties. For example, monolayer MoS2 is a direct band gap semiconductor with a band gap of ~1.9 eV8; while bi-layer MoS2is an indirect band gap semiconductor with a reduced band gap of ~1.6 eV8. In addition, the change in layer number may also tune the charge mobility and photoelectric properties.Nowadays, monolayer and multilayer MoS2have been grown via chemical vapor deposition (CVD) experimentally9, but how to accurately and robustly control the number of layers remains a challenge. Clearly, addressing this issue would enable robust control of their physical properties and thus facilitate their applications9.
Fabrication techniques, such as mechanical exfoliation9-11and liquid exfoliation12-14, have been frequently used to produce layered MoS2samples. However, these fabrication techniques are limited by their scalability and lack of precise control of layer number. CVD has the advantage of the controllable synthesis of large-area 2D MoS215-20, and is widely recognized as a superior synthesis technique. However, CVD is well-known for its notorious difficulty in extending across reactors in different laboratories. Often, subtle changes in reactor parameters and growth conditions may confound reproducibility. To address this challenge, it is highly desirable to develop a theoretical tool that is able to make insightful predictions on the growth of MoS2and provide useful guidelines to control CVD synthesis.
We note that significant theoretical efforts have been made to understand the CVD growth of graphene21-34. However, only a few studies have been performed to model TMDs growth due to their more complex compound structures35-40. Recently, Ye et al.37established an analytic thermodynamic criterion for the vertical growth (bilayer) versus in-plane lateral growth(monolayer) of MoS2 with regard to the sizes of both layers, van der Waals (vdW) interaction energies, and edge energies of 2D layers, which provided useful guidelines for the growth of bilayer MoS2. However, the conditions to permit or prohibit the growth of bilayer MoS2remain unclear. Hence, it is highly desirable to develop a phase diagram which is able to delineate the permitted or prohibited growth regime of bilayer MoS2 in terms of growth temperature and adatom flux.
Usually, the second layer of MoS2starts to nucleate when the first layer is sufficient large. Therefore, there is a need to develop a computational method that is able to reproduce the growth kinetics in large scale. It is well-known that kinetic Mote Carlo(kMC) method has the advantage of much longer time scale and larger length scale. Moreover, kMC simulations can be directly correlated with experimental growth conditions, such as growth temperature and adatom flux, to understand underlying growth mechanisms and predict growth phase diagrams. Hence, kMC simulations have been used to reproduce the experimental growth behaviors and further reveal the growth mechanism of 2D materials under different conditions, for example, the growth of monolayer graphene and monolayer TMDs38-40. However, a detailed kMC model that is able to describe the mono- and bilayer growth of MoS2, currently, is still unavailable.
In this work, we aim to develop a kMC model to make insightful predictions on the mono- and bi-layer growth of MoS2.First, we proposed and formulated our kMC model of bilayer MoS2growth, and then employed the analytic thermodynamic criterion37to calibrate the kMC model. With the calibrated model, the size and morphology evolutions of bilayer MoS2at different growth temperatures and adatom fluxes were analyzed.Then, the conditions for the permitted or prohibited growth of the bilayer MoS2in terms of growth temperature and adatom flux were revealed, which match well with the experimental observations. Lastly, a phase diagram on the permitted or prohibited growth of the bilayer MoS2was predicted. The present study not only unveils the growth conditions for monoand bi-layer MoS2 growth, but also provides guidelines for controllable growth of MoS2with desired number of layers.
2 Method

Fig. 1 Schematic illustration of (a) the bilayer MoS2 model and (b)growth procedures at MoS2 edge.The growth starts from a kink nucleation at the zigzag edge and proceeds with kink propagation in kMC simulation. Mo atoms at layer 1, Mo atoms at layer 2, and all S atoms are represented by the orange, purple and white spheres,respectively. Color online.
Our kMC simulation model is illustrated in Fig. 1a, in which hexagonal MoS2lattice (lattice constant a = 0.318 nm) with bilayer structures grown on a substrate is used41. An initial triangular domain of the first layer (layer 1) with an edge length of L1and a smaller triangular domain of the second layer (layer 2) with an edge length of L2are introduced at the center of the substrate surface. Starting from the bilayer nucleus, the growth of MoS2is made by the attachments of molybdenum and sulfur adatoms to the edges of both the layer 1 and layer 2. To form the triangular MoS2 with S-terminated zigzag edge15,18, in our simulation, we assume sulfur source is sufficient. Once the molybdenum adatom is attached to the edge, its neighboring sulfur sites are quickly filled. Our model is also applicable to simulate the conditions when molybdenum source is sufficient.In that case, once the sulfur adatom is attached to the edge, its neighboring molybdenum sites are quickly filled.
Ye et al.37reported that the growth of the MoS2is governed by the distribution of the adatom concentration. The growth of layer 1 is permitted when the adatom concentration on the substrate far from the edge of layer 1 (C0) is larger than that at the edge of layer 1 (C1-). However, if C0 is not larger than C1-,the growth of layer 1 is prohibited due to the lack of feeding stock. Similarly, the growth of layer 2 is permitted when the adatom concentration on layer 1 far from the edge of layer 2(C1+) is larger than that at the edge of layer 2 (C2). Otherwise,the growth of layer 2 is prohibited. In our simulations, we assume that the Schwoebel barrier is absent. Therefore, the adatom concentration at the edge of layer 1 (C1-) is equal to the adatom concentration on layer 1 far from the edge of layer 2(C1+), i.e., C1-= C1+= C1. Meanwhile, the occurrence for attachment to the edge is also determined by the energy barrier,whose rate can be calculated by the transition state theory.Therefore, we proposed the following occurrence rate for the growth of layer 1 when C0 > C1 and layer 2 when C1 > C2.

The subscript n = 1, 2 refers to the layer 1 and layer 2,respectively. If the adatom concentration Cn-1≤ Cn, the occurrence rate Pn= 0. v is the order of the frequency of atomic vibration (1012s-1). En is the energy barrier for the attachment to the edge of layer n. It has been reported that the attachment of W adatom is mainly determined by the bond energy of W-Se (2.38 eV), which is used to simulate the growth of WSe2on different substrates38. Therefore, in our simulations, we assume E1= E2.kbis the Boltzmann constant, and T is the temperature.
Based on Ye et al.’s work37, the adatom concentrations on the edge of layer 1 and layer 2 can be expressed as

Crefis the reference adatom concentration, which is taken to be Cref= F × Ω × τ. F is the rate of adatom supply that accounts for the precursor decomposition and adsorption rate. It is a dimensionless number, often called adatom flux. Ω is the concentration of atomic sites in the 2D layer (1020m-2), and τ is the effective lifetime of adatoms due to desorption.ε1and ε2are the binding energies per unit area of monolayer and bilayer,respectively, accounting for both in-plane bonding within the formed layers and across-layer vdW interactions. γnis the edge energy per unit length, and η is the structural parameter determined by the shape of the domain. L1 and L2 are the edge lengths of layer 1 and layer 2, respectively.
Based on the adatom concentration at the edge of layer 1, we proposed the adatom concentration on the substrate far from the edge of layer 1 to be

kFis a parameter which is determined by the system and kF< 1(more detailed discussion on this is given in Sections 3.1 and 3.3). L0is the edge length of the nucleus. Here, the adatom concentration on the substrate far from the edge of layer 1 should be lower than that required to induce new nucleation. If there exists a Schwoebel barrier at the edge of layer 1, the adatom concentration at the edge of layer 1 on substrate (C1-) will be not equal to the adatom concentration on layer 1 far from the edge of layer 2 (C1+), i.e. C1-> C1+or C1-< C1+. In calibrating our kMC model with the analytic thermodynamic criterion, the parameter kFcould be tuned to change the value of C0to maintain the relative dominance between the adatom concentration differences for layer 1 and layer 2, i.e. C0- C1-and C1+- C2.Therefore, the assumption that the Schwoebel barrier is absent will only change the value of kF but will not affect the conclusions.
It has been reported that the morphology of MoS2 domain in experiments always maintains a triangular shape with compact edges15-17. The underlying mechanism to achieve compact edges has been unveiled as fast kink propagation after kink nucleation28. Based on the above analyses, we proposed the following growth process of a triangular shape with compact edges in our simulations: the growth starts from a kink nucleation at the zigzag edge and proceeds with kink propagation (cf. Fig. 1b). The kink is nucleated by the initial attachments of adatoms to the zigzag edge, while the kink is propagated by the further attachments of adatoms to the active armchair site near the kink. It was previously reported that the difference in the energy barriers for the attachment to the zigzag edge and the armchair edge was ~0.3 eV for graphene by firstprinciples calculations42. In addition, the difference in the energy barriers for the attachment to the zigzag edge and the armchair edge was 0.23 eV for WSe2by first-principles calculations43. Therefore, in our kMC simulations, the difference in the energy barrier between the kink nucleation EK-Nand the kink propagation EK-Pis chosen as EK-N- EK-P= 0.3 eV. Thus, the overall growth rates are determined by the kink nucleation EK-N. The value of EK-Ncan be deduced from the experimental growth rate (more detailed discussion on this is given in Section 3.1). Because the energy barrier for the attachment of adatoms to the armchair edge is 0.2-0.3 eV lower than that to the zigzag edge42,43, the fast growing armchair edges will lose out to the slow growing zigzag edges. The compact triangular MoS2domains observed in experiments also indicate that the zigzag edge is dominated15-17. In addition, many experimental and simulation studies have indicated that S source is always sufficient, resulting in the formation of S-terminated zigzag edge15,18. Therefore, in our simulation, S-terminated zigzag edge is used. This kMC model can also be applied to other edges, such as Mo-terminated zigzag edge or armchair edge. In this scenario, the energy barrier of the kink nucleation should be chosen according to the edge type and edge structure.
3 Results and discussion
3.1 KMC model formulation and calibration based on analytic thermodynamic criterion
In Section 2, we proposed the occurrence rate for the growth of layer 1 and layer 2 in our kMC model. In this section, we made efforts to obtain the values of parameters in Eqs. 1 to 4.Fortunately, Ye et al.’s37reported the values of most parameters in our kMC model when proposing their analytic thermodynamic criterion, such as the adatom flux (F = 1.0 × 10⁻³),concentration of atomic sites Ω = 1020m-2, effective lifetime of adatoms (τ = 10 s), growth temperature (T = 1000 K), binding energies (Δε = 500 meV·nm-2, ε1 = 20Δε, ε2 = 2ε1 + Δε),structural parameter (η = 2 3 for an equilateral triangle), and edge energy (γ1= γ2= 10 eV·nm-1). Up to now, the unknown parameters in our kMC model are the edge length of nucleus(L0), initial edge lengths of layer 1 and layer 2 (L1and L2), energy barrier of kink nucleation (EK-N) and system parameter (kF).
Xue et al.44studied the initial nucleation of MoxSy clusters on the Au(111) surface by using first-principles calculations, and reported that the 2D three-atom-thick layer structures could be stabilized only after the number of Mo atoms exceeded 12. Since the edge length of MoS2flake is ~2 nm when the number of Mo atoms is 12, in our kMC simulation, the value of L0is set to be 2 nm. In Ye et al.’s37study, the initial edge length of layer 2 was fixed to be 50 nm and layer 1 was changed from 80 to 130 nm(cf. Fig. 2d). To calibrate our kMC Model based on Ye et al.’s analytic thermodynamic criterion37, the initial edge length of layer 2 in our kMC model was also set to be 50 nm and layer 1 was varied from 80 to 130 nm (cf. Fig. 2a to 2c).
As above analyses, the growth occurs at layer 1 or layer 2 is governed by the adatom concentration difference (C0-C1versus C1-C2) and energy barrier of kink nucleation (EK-N), which can be described by Eq. 1 in our kMC model. When the above energetic data (binding energy, edge energy, etc.) and structure parameters (edge lengths of nucleus, layer 1 and layer 2) are chosen, the growths of layer 1 and layer 2 are determined by the parameter (kF) and the energy barrier (EK-N). With these in hands,we carried out a series of kMC simulations by tuning the values of kFand EK-Nto compare the size evolutions in our simulations with those from Ye et al.’s calculations37.
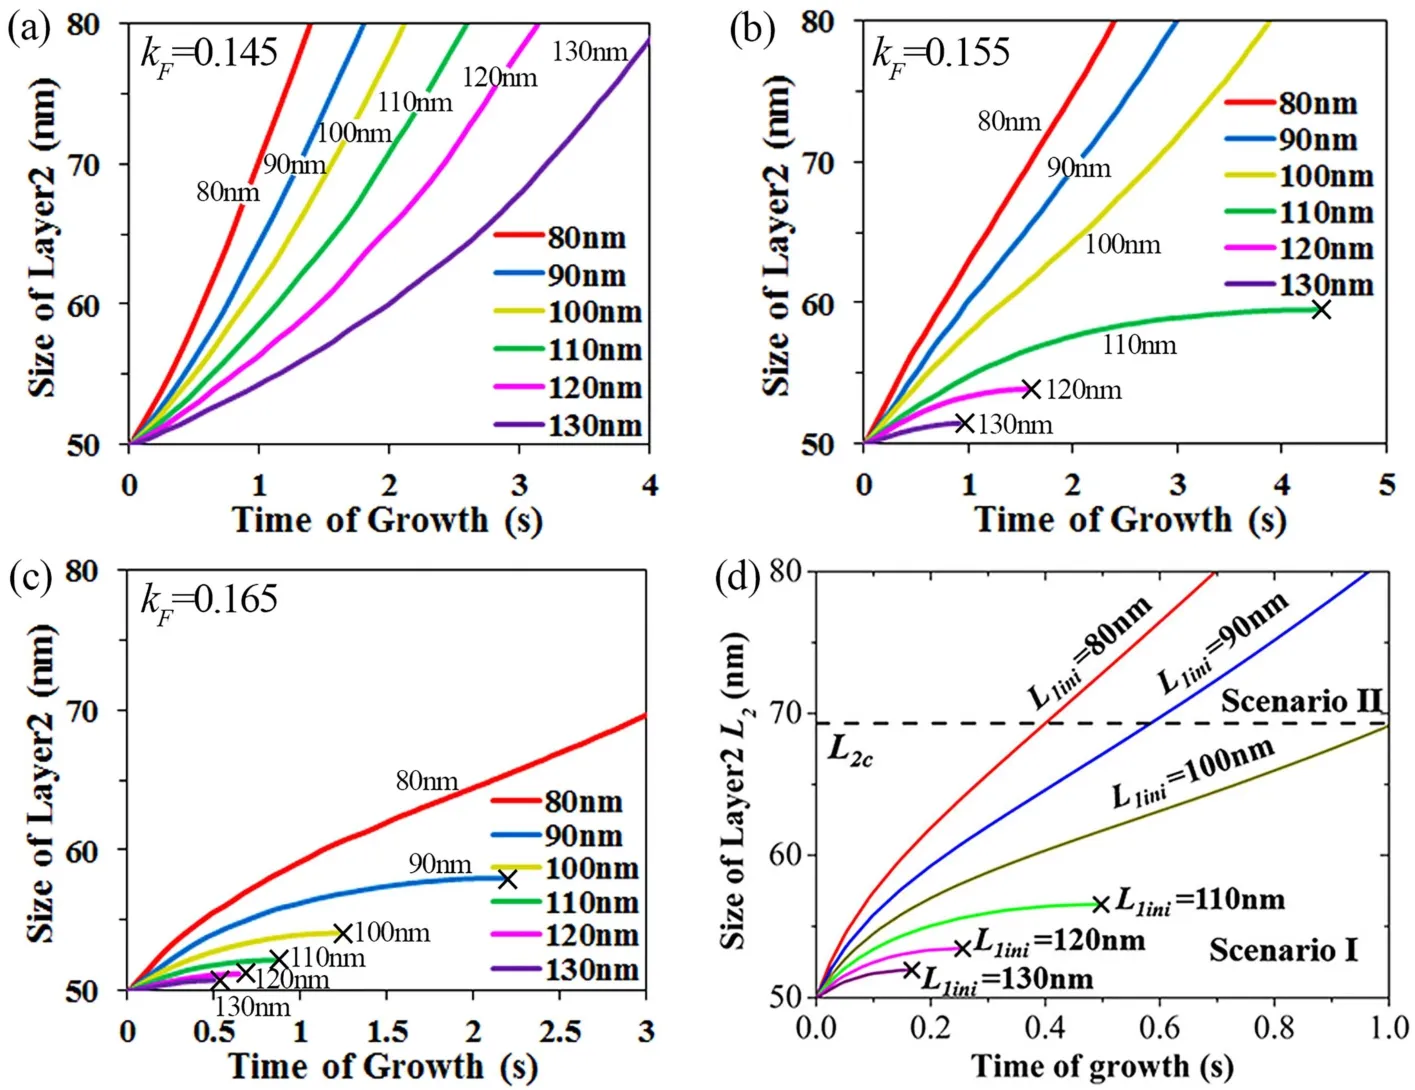
Fig. 2 Size evolution of layer 2 (L2) with different initial sizes of layer 1 (L1 = 80 nm, 90 nm, 100 nm, 110 nm, 120 nm and 130 nm) when(a) kF = 0.145, (b) kF = 0.155, and (c) kF = 0.165. (d) Size evolution of layer 2 with different initial sizes of layer 1 in Ye et al.’s 37 calculations based on analytic thermodynamic criterion. Copyright from Ref. 37.
The results show that when the value of kFis 0.155 and the value of EK-N is 1.7 eV, the domain evolutions of layer 2 (cf. Fig.2b) with different initial sizes of layer 1 (L1= 80, 90, 100, 110,120, 130 nm) match well with those in Ye et al.’s calculations37(cf. Fig. 2d). This signifies that our kMC model with this set of parameters is capable to reproduce the growth of bilayer MoS2.When the initial edge length of layer 1 is 80 to 100 nm, the growth of layer 2 is permitted and its domain continuously increases from 50 to 80 nm. When the initial edge length of layer 1 is from 110 to 130 nm, however, the growth of layer 2 is prohibited after initial growth. This indicates that the growth rate of layer 2 strongly depends on the size of layer 1 (L1) for a given size of layer 2 (L2). The growth of layer 2 monotonically decreases with increasing the size of layer 1 (L1), and may even become prohibited at a maximum value of L1.
In our kMC simulations, the growth of layer 2 is determined by the competition between the adatom concentration difference of layer 1 and layer 2 (C0-C1versus C1-C2). When the value of kF decreases to 0.145, the adatom concentration difference of layer 1 (C0-C1) is reduced because the value of C0 decreases (cf.Eq. 4). Therefore, the adatom concentration difference of layer 2(C1-C2) is relatively superior to that of layer 1 (C0-C1), leading to the acceleration on the growth of layer 2. Layer 2 continuously grows when the initial edge length of layer 1 is 80 to 130 nm (cf.Fig. 2a). When the value of kF increases to 0.165, the adatom concentration gradient of layer 1 is increased because the value of C0increases (cf. Eq. 4). In this case, the adatom concentration difference of layer 2 (C1-C2) is relatively inferior to that of layer 1 (C0-C1), resulting in the prohibition of the growth of layer 2.The growth of layer 2 is prohibited when the initial edge length of layer 1 is from 90 to 130 nm (cf. Fig. 2c).
Clearly, the growth competition between layer 1 and layer 2 is determined by the parameter (kF), not the energy barrier of kink nucleation (EK-N). The value of EK-Nonly changes the overall time line, and thus does not affect the conclusion on whether the growth occurs at layer 1 or layer 2. The overall growth time increased with increasing the value of EK-N. In our kMC simulations, the time line when EK-Nis 1.7 eV (cf. Fig. 2b) agrees well with that of Ye et al.’s calculations37(cf. Fig. 2d).Therefore, in the following simulations, the value of EK-Nis fixed at 1.7 eV and the value of kFis set to 0.155 when the adatom flux is 1.0 × 10⁻³.
3.2 Morphology evolution of bilayer MoS2 in growth process
In Section 3.1, the size evolutions of layer 2 (L2) with different initial sizes of layer 1 (L1 = 80 nm, 90 nm, 100 nm, 110 nm, 120 nm and 130 nm) were analyzed and calibrated by Ye et al.’s calculations37. As a result, our kMC model with this set of parameters is capable to reproduce the growth of bilayer MoS2.In this section, more detailed analyses on the morphology evolutions of both layer 1 and layer 2 were carried out. The morphology evolutions of the bilayer MoS2, when the initial size of layer 1 is 80 nm and 130 nm, are shown in Fig. 3a, b,separately. In the whole growth processes of bilayer MoS2, the morphologies of layer 1 and layer 2 maintain triangular shapes with compact edges, which is consistent with the kinknucleation-propagation mechanism in our kMC model. The evolutions on the sizes of the triangles marked in Fig. 3a, b indicate the effect of the initial sizes on the growth of bilayer MoS2.

Fig. 3 Size and morphology evolutions of bilayer MoS2 growth processes when the initial size of layer 2 is 50 nm and that of layer 1 is (a) 80 nm and (b) 130 nm.Orange and purple domains represent layer 1 and layer 2, respectively. Color online.
Fig. 3a shows that layer 1 grows dramatically from 80 to 259 nm with increasing the time from 0 to 2.4 s. Together with the growth of layer 1, layer 2 continuously increases from 50 nm to 80 nm, which indicates that the growth of layer 2 is permitted.This is corresponding to the experimental fabrication of bilayer MoS2. When the initial size of layer 1 is 130 nm, however, it exhibits an opposite trend for layer 2. When layer 1 increases from 130 to 259 nm with the time increasing from 0 to 1.6 s,layer 2 grows only slightly, from 50 to 51 nm initially from 0 to 0.4 s and then ceased to grow after 0.4 s. This is corresponding to the experimental synthesis of monolayer MoS2.
3.3 Permitted or prohibited growth affected by growth temperature and adatom flux
For the CVD synthesis method, subtle changes in the growth conditions may cause a huge difference in the growth of MoS2 domain. To verify the robustness of our kMC model, more simulations with varying growth temperatures and adatom fluxes were carried out. The size evolutions of layer 2 at different growth temperatures (950, 975, 1000, 1025 and 1050 K) with initial layer 1 of 100 nm are shown in Fig. 4a. The results indicate that an increase in growth temperature promotes the growth of layer 2. The growth of layer 2 is permitted when the growth temperature is high (from 1000 to 1050 K), while the growth of layer 2 is prohibited when the growth temperature is low (from 950 to 975 K). These simulation results match well with Ye et al.’s experimental observations37, where only monolayer MoS2 was synthesized at the growth temperature of 973 K (cf. Fig. 4c); second layer of MoS2was formed at some places on top of the first layer when the growth temperature increased to 1023 K; and a complete bilayer MoS2was fabricated when the growth temperature further increased to 1073 K.
Experimental results37shown in Fig. 4d indicate that the adatom flux has larger influence on the adatom concentration gradient of layer 1 than that of layer 2. With decreasing the adatom flux, the adatom concentration gradient of layer 1 decreases more dramatically than that of layer 2. Therefore, in our simulations, the value of kFis tuned to simulate the variation of the relative dominance between the adatom concentration gradient of layer 1 and that of layer 2 with the adatom flux. In the following simulations, the adatom flux F decreases from 1.8 ×10⁻³to 0.6 × 10⁻³, and the value of kFis assumed to linearly decrease with decreasing the flux F (kF = 0.145 + k × F, k = 10).The size evolutions of layer 2 at different adatom fluxes (0.6 ×10⁻³, 1.0 × 10⁻³, 1.4 × 10⁻³and 1.8 × 10⁻³) when the initial size of layer 1 is 100 nm are shown in Fig. 4b. The simulation results indicate that the decrease of the adatom flux accelerates the growth of layer 2. The growth of layer 2 is prohibited when the adatom flux is high (1.4 × 10⁻³to 1.8 × 10⁻³), while the growth of layer 2 is permitted when the adatom flux is low (0.6 × 10⁻³to 1.0 × 10⁻³). These simulation results also match well with Ye et al.’s experimental observations37. They discovered that at the Ar gas flow rate of 150 standard cubic centimeter per minute(sccm), only monolayer MoS2was synthesized (cf. Fig. 4d).When the Ar gas flow rate decreased to 70 sccm, however, layer 2 was formed at some positions on top of layer 1. When the Ar flow rate further decreased to 20 sccm, a complete bilayer MoS2was fabricated. These comparisons between our simulation results and Ye et al.’s experiments37further verify that our kMC model is capable to reproduce the CVD growth of monolayer and bilayer MoS2.
3.4 Phase diagram on permitted or prohibited growth of bilayer MoS2
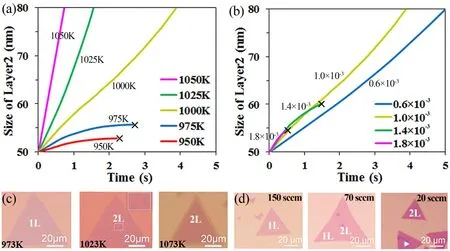
Fig. 4 Size evolution of layer 2 at (a) different growth temperatures (950, 975, 1000, 1025 and 1050 K) and(b) different adatom fluxes (0.6 × 10⁻³, 1.0 × 10⁻³, 1.4 × 10⁻³ and 1.8 × 10⁻³). Experimental observations of MoS2 layers at (c) different growth temperatures (973, 1023 and 1073 K) and (d) different flow rates of Ar gas (150, 70 and 20 sccm).Copyright from Ref. 37.
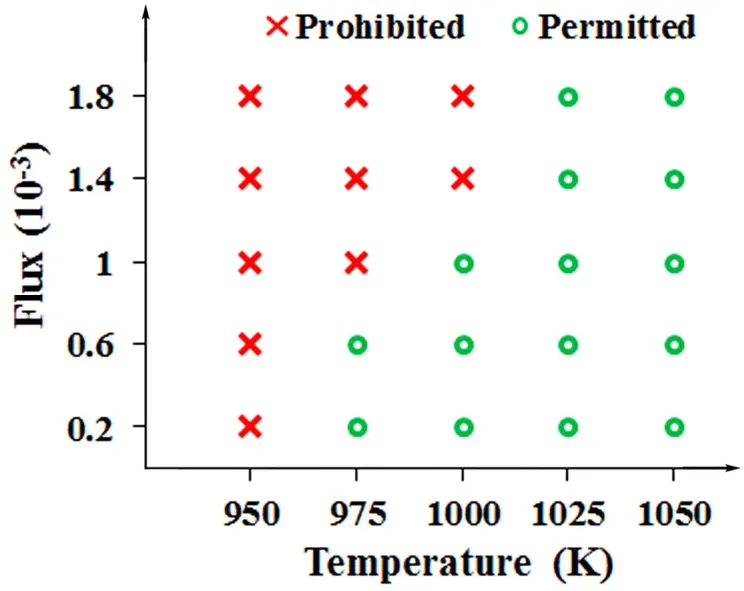
Fig. 5 Phase diagram on permitted or prohibited growth of bilayer MoS2 with varying growth temperature (950, 975,1000, 1025 and 1050 K) and adatom flux (0.2 × 10-3,0.6 × 10-3, 1.0 × 10⁻³, 1.4 × 10⁻³ and 1.8 × 10⁻³).
To further provide guideline to the experimental synthesis of MoS2with desired number of layers, a phase diagram with varying growth temperatures and adatom fluxes is produced in Fig. 5. The red symbol “×” denotes the prohibited growth of layer 2 at the corresponding growth temperature and adatom flux, while the green symbol “○” denotes the permitted growth of layer 2 at the corresponding experimental condition. For example, at the growth temperature of 950 K, MoS2 always grows as monolayer. When the growth temperature increases to 1000 K, either monolayer or bilayer MoS2can be synthesized by controlling the adatom flux (monolayer: 1.4 × 10⁻³to 1.8 × 10⁻³,bilayer: 0.2 × 10⁻³to 1.0 × 10⁻³). If the growth temperature is even higher (1025 or 1050 K), MoS2 always grows in bilayer form without the need to adjust the adatom flux.
To unveil the underlying mechanism that the growth of bilayer MoS2is promoted by the increase of growth temperature or the decrease of adatom flux, variations of the adatom concentrations C1and C2with time at different growth temperatures (975 and 1000 K) and different adatom fluxes (1.0 × 10⁻³and 0.6 × 10⁻³)were further analyzed and plotted in Fig. 6. Fig. 6a indicates that the adatom concentration C1is larger than C2initially at both 975 K and 1000 K, promoting the growth of bilayer MoS2. Then,both the adatom concentration C1and C2decreased as the bilayer MoS2grew. The difference between the adatom concentration C1 (blue rhombus) and C2 (blue triangle) decreased drastically to zero at the growth temperature of 975 K, prohibiting the growth of bilayer MoS2. When the temperature increased to 1000 K,however, the difference between the adatom concentration C1(red rhombus) and C2(red triangle) maintained constant after 1 s, permitting the growth of bilayer MoS2. Hence, the increase of temperature enables the adatom concentration C2to decrease accordingly with the adatom concentration C1, resulting in a consistent difference in adatom concentration to promote the growth of bilayer MoS2. This is the underlying mechanism that the growth of bilayer MoS2can be promoted by the increase of temperature. Similarly, the decrease of adatom flux from 1.0 ×10⁻³(blue curves in Fig. 6a) to 0.6 × 10⁻³(blue curve in Fig. 6b)lowers the value of kF, resulting in the decrease of C0. Then, the decrease of C0 lowers the concentration gradient of layer 1,decelerating the growth of layer 1. Furthermore, the decelerated growth of layer 1 reduces the difference between the adatom concentration C1(blue rhombus) and C2(blue triangle) to zero,permitting the growth of bilayer MoS2.

Fig. 6 Variations of adatom concentrations C1 and C2 with time (a) when the growth temperature is 975 K and 1000 K and the adatom flux is 1.0 × 10⁻³, and (b) when the growth temperatures is 975 K and the adatom flux is 0.6 × 10⁻³. Color online.
Compared with Ye et al.’s research37, our work has the following contributions: We presented a new kinetical Monte Carlo model for the CVD growth of MoS2 and calibrated the model by using existing thermodynamic models and experimental results. We revealed the underlying mechanism that the growth of bilayer MoS2can be promoted by the increase of growth temperature or the decrease of adatom flux.Specifically, the growth temperature enables the adatom concentration C2 to decrease with the adatom concentration C1,resulting in a consistent adatom concentration difference to promote the growth of bilayer MoS2; while the decrease of adatom flux decelerated the difference between the adatom concentration C1and C2to zero, permitting the growth of bilayer MoS2. Importantly, we presented a phase diagram (cf. Fig. 5) in the growth temperature and adatom flux space to predict the growth of bilayer MoS2, which may guide the experimental CVD fabrication of mono- and bi-layer MoS2.
4 Conclusions
In this work, we developed a kMC model to study the CVD growth kinetics and underlying mechanisms of mono- and bilayer MoS2. First, we formulated and calibrated our kMC model by an analytic thermodynamic criterion37. With the calibrated model, we successfully reproduced the mono- and bi-layer growth of MoS2under different growth conditions. We found that the growth rate of layer 2 strongly depends on the size of layer 1 and monotonically decreases with increasing the size of layer 1, and may even become prohibited at a maximum size of layer 1. Then, the size and morphology evolutions of the bilayer MoS2growth processes were analyzed. In the whole growth processes of bilayer MoS2, the morphologies of layer 1 and layer 2 maintained triangular shapes with compact edges.Furthermore, the permitted or prohibited growth of bilayer MoS2 in terms of growth temperature and adatom flux was analyzed.The increase of the growth temperature or the decrease of the adatom flux promotes the growth of layer 2, which agrees well with experimental observation37. Lastly, a phase diagram on permitted or prohibited growth of bilayer MoS2in terms of growth temperature and adatom flux was predicted. The underlying mechanism that the growth of bilayer MoS2can be promoted by the increase of growth temperature or the decrease of adatom flux was further revealed. Hence, our study here not only unveils the conditions of the mono- and bi-layer growth of MoS2, but also provides guidelines for the controllable growth of MoS2with desired number of layers.
猜你喜欢
分子催化(2022年1期)2022-11-02
现代仪器与医疗(2022年3期)2022-08-12
商品与质量(2021年43期)2022-01-18
商品与质量(2021年43期)2022-01-18
陶瓷学报(2021年4期)2021-10-14
食品安全导刊(2021年21期)2021-08-30
保鲜与加工(2021年1期)2021-02-06
电子制作(2019年15期)2019-08-27
表面工程与再制造(2019年6期)2019-08-24
智富时代(2019年6期)2019-07-24
