阳谷县近50年气温变化特征分析
2019-10-21 08:00:53徐磊梁海瀚
农业灾害研究
2019年5期
徐磊 梁海瀚
摘要 基于1968—2017年阳谷县气温资料,利用线性趋势拟合、Mann?鄄Kendall非参数检验、Mann?鄄Kendall突变检验等统计方法对月平均气温、月平均最高气温、极端最高气温进行分析。结果表明,近50年尤其是2010年以来,阳谷县气温总体呈上升趋势,但极端最高气温以0.216℃/10年的速度下降。
关键词 年平均气温;月平均最高气温;极端最高气温;变化特征;山东阳谷
中图分类号:P468.021 文献标识码:A 文章编号:2095-3305(2019)05-041-04
DOI: 10.19383/j.cnki.nyzhyj.2019.05.018
Analysis of Temperature Change Characteristics in Yanggu County in the Past 50 Years
XU Lei et al(Yanggu County Meteorological Bureau, Yanggu, Shandong 252300)
Abstract Based on the temperature data of Yanggu County from 1968 to 2017,the monthly average temperature,monthly average maximum temperature and extreme maximum temperature were analyzed by linear trend fitting,Mann-Kendall non-parameter test,Mann-Kendall mutation test and other statistical methods. The results showed that in the past 50 years,especially since 2010,the temperature in Yanggu County has generally shown an upward trend,but the extreme maximum temperature has dropped at a speed of 0.216℃ per 10 years.
Key words Annual average temperature;Monthly average maximum temperature;Extreme maximum temperature;Variation characteristics;Yanggu County of Shandong Province
近百年来,全球正在发生以变暖为主要特征的气候变化[1],极端天气出现频率逐渐增加。李又君等[2-3]研究得出聊城市气温除夏季外均呈上升趋势,且极值年较差正在减小。为验证阳谷县气温变化与周边是否相似,且后续是否保持这种趋势,选取1968—2017年气温资料进行了统计分析。
1 资料与方法
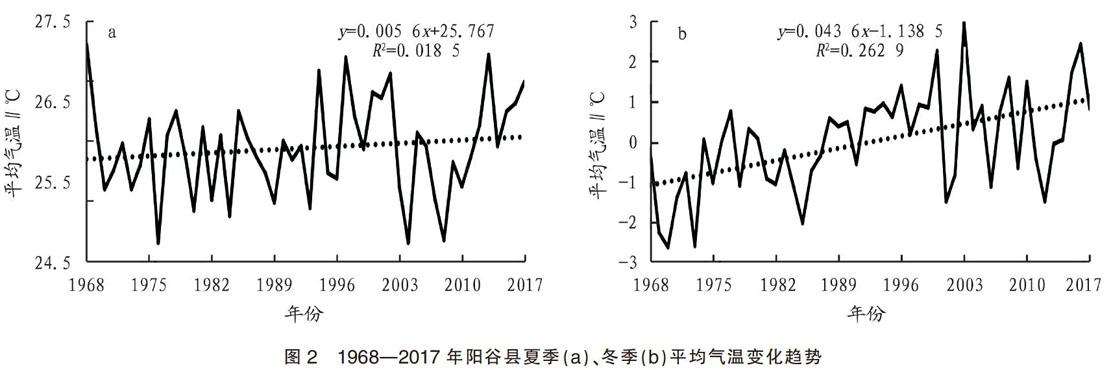
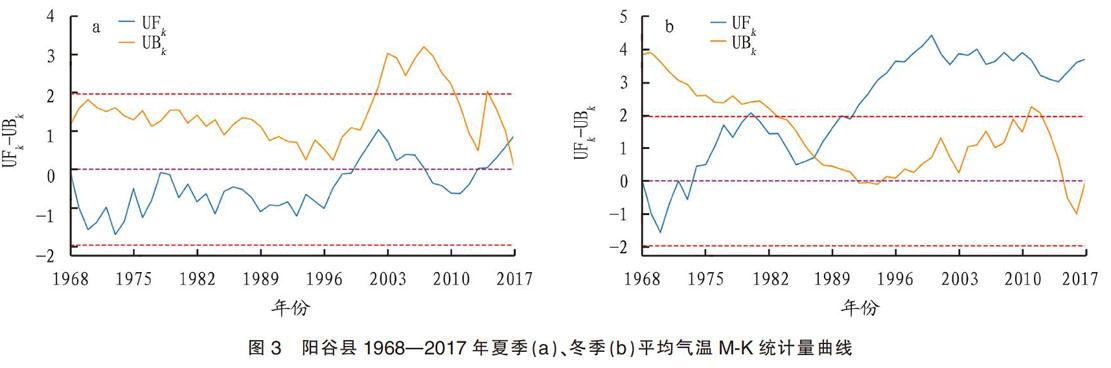
通过统计阳谷国家气象观测站1968—2017年观测的气温资料,包括月平均气温、月平均最高气温和极端最高气温,采用线性趋势拟合、Mann-Kendall非参数检验、Mann-Kendall突变检验等统计方法对阳谷县近50年气温变化特征进行了分析。季节划分夏季为6—8月,冬季为12月至翌年2月。
2 结果与分析
2.1 平均气温变化分析
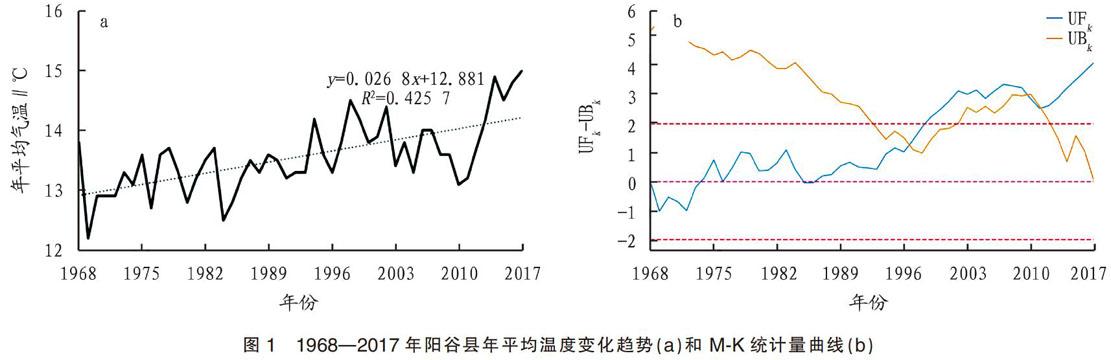
2.1.1 年平均气温变化 从图1可以看出,近50年阳谷县年平均气温呈现上升趋势,气溫倾向率为0.268℃/10年。年平均气温最低值为1969年的12.2℃,最高值为2017年的15.0℃,变化呈现一定波动性,但1994年以后基本呈逐年升高的态势,2010年以后上升较为明显。利用Mann?鄄Kendall对阳谷县近50年(1968—2017年)平均气温进行趋势检验,结果表明年平均气温通过了0.01的显著性检验(4.58),说明平均气温上升趋势十分明显。……
登录APP查看全文