
Welding deviation detection method based on weld pool image contour features
2019-10-22 07:13ZhuYanjunWuZhishengLiKeYangPeixin
China Welding 2019年2期
Zhu Yanjun , Wu Zhisheng , Li Ke , Yang Peixin
朱彦军,吴志生,李科,杨培新
1.School of Materials Science and Engineering,Taiyuan University of Science and Technology,Taiyuan 030024,China;
2.Shanxi Sanyang Refrigeration Service Co.,Ltd.,Taiyuan 030024,China
Abstract Automatic on-line detection of welding deviation based on machine vision is one of the key technologies of arc welding robot tracking welding,in which obtaining high quality weld pool image and accurate welding deviation detection algorithm are two important steps of tracking welding.Through the research and analysis of the weld pool image of gas metal arc welding (GMAW),it was found that the weld pool contains abundant welding information.First,the average gray value of the weld pool image can reflect the interference degree of arc to weld pool image and the heat input of welding process.Secondly,the tip of the weld pool image contour can reflect the center of the groove gap.Finally,the horizontal distance between the center coordinate of the wire contour and the tip coordinate of the weld pool image contour can reflect the welding deviation.On the basis of analyzing the characteristics of weld pool image,this paper proposes a new method of weld seam deviation detection,which includes the collection of weld pool image,image preprocessing,contour extraction and deviation calculation.The results of the tests and analyses showed that the maximum error of the on-line welding deviation obtained was about 2 pixels (0.17 mm) when the welding speed was ≤60 cm/min,and the algorithm was stable enough to meet the requirements of real-time deviation detection for I-groove butt welding.The method can be applied to the on-line automatic welding deviation detection of arc welding robot.
Key words I-groove,weld pool image,deviation detection algorithm
0 Introduction
Robotic arc welding is the most recent trend in welding automation and intellectualization.In CO2gas shielded robotic welding,I-grooves are often used in the butt welding of thin plates,which is applicable to a wide range of scenarios.However,welding deviation is a common problem,which makes welding deviation detection and measurement all the more important.To solve this problem,non-contact sensors (arc sensor[1-5],spectral sensor[6-7],acoustic sensor[8-10],visual sensor[11],and capacitance sensor[12])are being widely used to collect weld seam information.Visual sensing is used in welding deviation detection and seam tracking owing to its advantageous features of abundant information,high precision,and strong anti-interference ability.Visual sensing is categorized into active vision sensing and passive vision sensing depending on whether an external light source is needed or not.
In active visual welding deviation identification,an auxiliary light source,such as a laser,is employed to illuminate the welding area in an effort to mitigate the interference of arc light on image quality and to improve image quality[13].At present,the most popular practice is to project one or multiple beams of structured light or grids onto the welding piece to obtain geometrical-shape information according to the deformation of the structured light stripe.Several studies have been carried out on applying active vision sensing for welding both thick plates[14-16]and thin plates[17-18].An active vision sensor uses an industrial camera with a narrow-band optical filter to effectively suppress arc interference and obtain a clear groove profile and edge.The active two-dimensional vision sensing detection method is relatively mature and is commercially available.However,its limitation is that the distance between laser stripe and welding torch is far,which leads to poor real-time deviation recognition ability.In addition,the distortion of laser stripe is often difficult to identify.
Besides,the passive vision seam tracking system,which uses the compound narrow band filter technology,can be used to obtain comprehensive information of the welding area image[19].Xu et al.[20]studied the visual sensing system of pulsed tungsten inert gas (TIG) welding with compound optical path,and obtained the images of the front and back areas of the weld pool and the groove areas behind the weld.
There are four main ways to identify weld deviation using a single camera in passive visual welding error recognition.First,when the weld pool and groove image are clear,deviation of the weld pool center and the groove center can be used as a control variable for recognizing weld deviation.Xu et al.[21]studied the seam tracking in TIG welding.Second,Zhao et al.[22]extracted the centroid of weld pool images in TIG welding.When the arc is aimed at the groove,the gray level of the weld pool image is symmetrical and the centroid of the weld pool corresponds to the central value;the centroid of the weld pool deviates from the center of the weld pool when the arc deviates from the groove.The third is to study the horizontal distance between the weld pool center and the groove center,which is defined as the welding deviation distance[23].The fourth is to study the pool image corresponding to V-groove[24].The deviation and deviation direction between the center of the welding wire and the center of the groove are obtained through image processing.
Welding deviation usually refers to the horizontal deviation between the projection point of the wire center on the workpiece surface and the groove center.However,it is difficult to accurately judge the center of the welding wire and the groove center during welding.In this context,the monocular passive vision welding deviation monitoring system is susceptible to the following disturbances.(1) weld pool images are easily interfered by arcs and spatters,(2) it is not easy to extract the welding groove center,and (3) the accuracy of the welding wire center at the projection point of the workpiece directly affects the accuracy of the deviation measurement.In this paper,a weld pool image acquisition system based on monocular passive vision is designed,and a welding deviation detection algorithm based on weld pool contour features is proposed.The algorithm defines the horizontal deviation between the center of the welding wire and the tip of the weld pool as the welding deviation.The system can detect the I-groove,Y-groove and U-groove welding deviation information quickly and accurately.
1 Welding system and image acquisition system
1.1 Welding system
A robotic detection system for the weld pool deviation in gas metal arc welding (GMAW) is shown in Fig.1.The test system is composed of three parts:a welding system,an image acquisition system,and a current and voltage acquisition system.The welding system consists of a MOTOMANUP6 arc welding robot and a MOTOWELD-S350 welding power device.The image acquisition system includes a CMOS industrial camera with external trigger function,a composite filter system composed of filters,and light reducing films.Hall sensor is used to collect welding current and voltage signals and the collected welding voltage is used as the external trigger signal of the camera.Signal processing is completed on a desktop computer.

Fig.1 Structural diagram of the experimental system
The image acquisition system of the welding test system consists of a camera,light filter system,and an external trigger system.The camera used in this study was a DAHENGMER-231-41-U3C model with 1/1.8 inch interlines transfer CMOS of (2 048 × 1 536) pixels.The camera lens was a CBC M2518-MPW2 model,which is a 1/1.8 inch industrial camera lens with a zoom of 250 mm.The camera was installed on the welding torch at 35° with respect to the assembly gap,and the installation direction was in line with the welding direction.Experiments showed that an optical filter with a central wavelength of (630 ± 10) nm was suitable for our welding system.Further,a dimmer glass with an attenuation of 90% was also used in the visual sensor to reduce the exposed light reaching the camera.Weld pool images can be obtained during the welding process by using these filters.One such example is shown in Fig.2.The external trigger signal is supplied by a Hall voltage sensor to monitor the welding voltage.
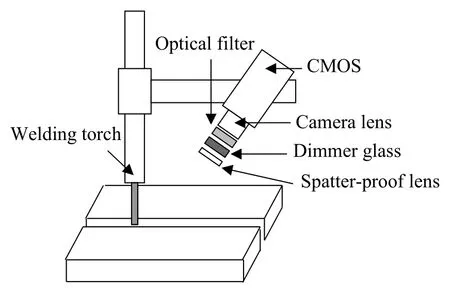
Fig.2 Structural diagram of the vision sensing system
1.2 Experimental conditions
During the welding experiments conducted for image acquisition of the weld pool,a Q235 workpiece was used and the groove type was a single I-groove.A GMAW welding method was used with 100% CO2as the shielding gas.The welding wire with a diameter of 1.2 mm was composed of H08Mn2SiA.The main parameters of the experiment are shown in Table 1.
1.3 Camera setting
In order to avoid arc light interference,a drop in the welding voltage along the trigger camera was allowed;the drop-edge triggered filter was set at 0.001 s,while the trigger delay was 0.0008 s.In order to further improve the speed of image acquisition,the exposure time could be reduced to 0.0002 s,but in this case,the brightness of the collected image was reduced.A gain of 10 dB was added to the image acquisition settings in order to enhance image brightness,as shown in Fig.3.

Table 1 Main parameters of the experiment

Fig.3 Camera trigger diagram based on the welding voltage
The original weld pool images in CO2gas shield welding were obtained by the CMOS camera.To improve the speed of image acquisition,transmission and algorithm processing,a 120 × 160-pixels region of interest to capture the weld pool image was set,as shown in Fig.4.The weld pool image was transformed into 256 gray levels represented by 8-bit binary numbers,where 0 corresponds to black and 255 corresponds to white.
1.4 Image analysis of the weld pool

Fig.4 Weld pool diagram
In the welding process,the welding wire melts and the molten metal fills the groove under the action of gravity and surface tension.The camera tilts the weld pool image in front of the torch.The light emitted by the molten metal enters the industrial camera from the groove of the workpiece.At this time,the molten liquid is red and the groove and workpiece are black.Because the groove gap is very narrow,the tip of the weld pool is sharp,as shown in Fig.5.

Fig.5 Schematic of the weld pool:(a) welding area and (b) weld section
2 Weld pool contour extraction
An algorithm for weld pool contour extraction was applied for real-time seam tracking of thin plate butting and it is expected that joint deviation can be rapidly detected from the weld pool images.The flow chart of the algorithm is shown in Fig.6.
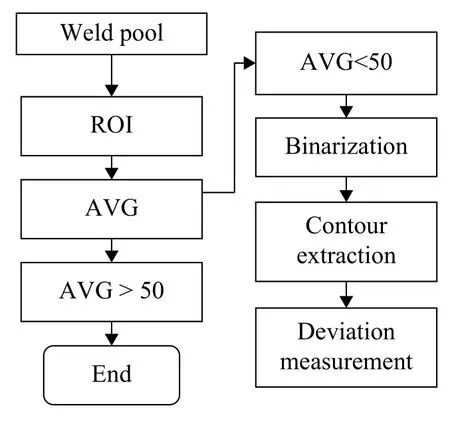
Fig.6 Flow of image processing
2.1 Setting of the region of interest (ROI)
The composite filter system significantly reduces the gray value of the image,especially the gray value far from the weld pool,and can hardly yield any effective information.For welding deviation detection and measurement based on weld pool images,effective information is mainly extracted from the front edge of the weld pool;only a little valid information is available from the rear edge.An excess of invalid information will reduce image quality and slow down the process.After repeated experiments,we found that when the ROI was set to 70 × 80 pixels,the desired contour extraction can be achieved and the processing time could be reduced to 0.081 s.
2.2 Removal of images with serious arc interference
In the process of real-time collection of weld pool images,the camera is triggered to take a delayed picture whenever the voltage drops.This can eliminate strong arc interference.However,when the welding process is unstable,some images are still subjected to significant interference from the arc and spatter.Such images show that the average gray value (AVG) of the image is relatively high.Experiments show that when AVG exceeds 50,the contour is severely disturbed by arc light and therefore discarded without being processed and saved.When AVG is less than 50,the profiles of both the weld pool and welding wire are clear.These are the images to be saved and processed.The average gray level of the image is calculated as follows.
If the gray value of imageIM×Nat (x,y) isf(x,y) and the gray level isL,thenf(x,y)∈[0,L-1].If the number of pixels in the gray leveliisfi,then the occurrence probability of leveliis

Here,i=0,1,2,…,L-1 and

The average gray value of the whole image is defined as:

2.3 Image segmentation based on the maximum inter class and intra class variance ratio method
ROI images selected after weld pool contour extraction and weld pool image with different welding parameters are showed in Fig.7 and Fig.8.The ROI images selected are segmented based on the maximum inter class and the intra class variance ratios,and the binary images produced after segmentation are shown in Fig.7b and 8b.The image segmentation algorithm is as follows.

Fig.7 ROI image selected after weld pool contour extraction (a) ROI (b) Binary image (c) Weld pool contour

Fig.8 Weld pool image with different welding parameters(a) Torch on the right and misalignment,(b) Ideal weld pool (c) Torch on the left
The pixel values in the image are divided into backgroundC1and targetC2by the thresholdT0.The gray level of the backgroundC1is between 0 andT0-1 and its corresponding pixel is {f(x,y)<T0};the gray level of the targetC2is fromT0toL-1 and the corresponding pixel is {f(x,y)≥T0}.The occurrence probability of backgroundC1isω1and the occurrence probability of targetC2isω2;further,ω1+ω2=1.

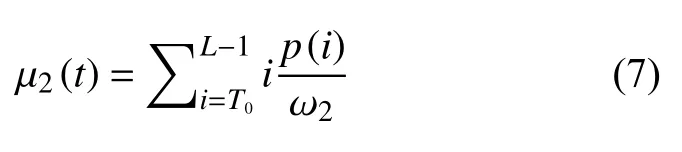
The average gray value of backgroundC1isμ1(t),while the average gray value of targetC2isμ2(t).

The gray variance of backgroundC1is

The gray variance of targetC2is


The maximum inter class and intra class variance ratio is given by

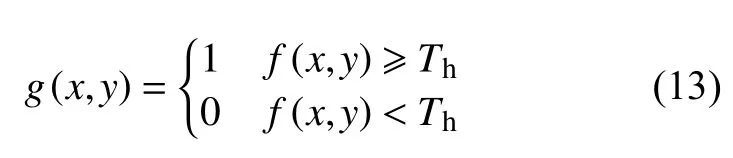
By selecting the optimal thresholdT=Th,the image we divided into backgroundand target
The binary image processing is described in the following equation.The front end of the weld pool and welding wire profile are extracted accordingly.
2.4 Contour extraction
The edges of the binary image were identified to obtain the weld pool contour,which is shown in Fig.7c.We can clearly see the outline and tip of the weld pool front end and the profile of the welding wire.
3 Welding deviation detection and measurement
The weld pool images collected fall into three categories,as illustrated in Fig.8.There is deviation and misalignment.In Fig.8a,the welding torch deviates 0.34 mm to the right.Because the right workpiece is 0.2 mm higher than the left one and molten metal flows to the lower part,the left melt width is greater than that of the right,and the left weld pool is larger than the right.There is no deviation and misalignment in Fig.8b.Thus,the two sides of the weld pool are basically symmetrical.In Fig.8c,the welding deviation is 0.43 mm,leaning to the left.The two sides of the weld pool are basically symmetrical.
3.1 Groove center coordinates extraction
Using the proposed algorithm to extract the weld pool contour of Fig.8,we obtained Fig.9,which shows the most common frontal images of the three types of weld pools.All the weld pools have a common feature of having a unique tip.The tip is the center of the groove,and the pixel coordinates of the weld pool contour are contoured.Further,the largest ordinate pointPz(xz,yz) is the tip point of the weld pool,i.e.,the center of the groove.

Fig.9 Weld pool contour in the presence of deviations:(a)Torch on the right and unfitness defect (b) Ideal weld pool(c) Torch on the left (d) Binary image of a (e) Binary image of b (f) Binary image of c (g) Weld pool outline of a (h)Weld pool outline of b and (i) Weld pool outline of c
3.2 Welding wire center coordinate extraction
3.2.1 Analysis of the welding wire image
In this study,the horizontal deviation between the center of the welding wire and center of the groove is defined as the welding deviation.It can be seen in Fig.9 that the tip of the welding wire profile is irregular and hence the tip of the welding wire profile cannot be defined as the center of the welding wire.
3.2.2 Welding wire center coordinates extraction algorithm
The pixels of the weld pool image can be calibrated by using the diameter (1.2 mm) of the welding wire used in the welding process.It is about 14 pixels in width between the two edges of the welding wire,as shown in Fig.9.Therefore,the calibrationPper pixel value is

Ten rows from the tip of the weld pool were skipped over and the diameter of the welding wire was scanned.If the diameter of the welding wire image was 14 pixels,the contour center of the welding wire could be considered as the center of the welding torch.If it was not 14 pixels,scanning was continued upward line by line until the diameter of the welding wire was 14 pixels.Pl(xl,yl) is the point on the left of the welding wire,Pr(xr,yr) is the point on the right,andPs(xs,ys) is the welding wire center coordinate.
Whenxr-xl=14

3.2.3 Welding deviation algorithm
When the pixel coordinates of the welding wire centerxsand of the weld pool tipxzare evaluated from the weld pool contour,the pixel value Δ of welding deviation in thexdirection can be defined as

The real welding deviation ∆rcan be calculated as

Thus,the deviation in the weld pool in Fig.10 is calculated.
(1) Consider Fig.9g.The pixel coordinates of the welding wire centerxsare 33 pixels and the pixel coordinates of the weld pool tip centerxzare 29 pixels.The pixel value of the welding deviation in thexdirection,∆ is calculated by substituting the two values in Eq.(16):


Fig.10 Accuracy of the weld-deviation measurement algorithm
As ∆<0,the welding wire center is on the right side of the groove.The real welding deviation ∆rcan be calculated from Eq.(17):

This means that the welding wire is center-right for 4 pixels and the welding deviation is about 0.344 mm.
(2) Consider Fig.9h.The pixel coordinates of the welding wire centerxsare 33 pixels and the pixel coordinates of the weld pool tip centerxzare 33 pixels.It means that the welding wire center is in the middle.

(3) Consider Fig.9i.The pixel coordinates of the welding wire centerxsare 31 pixels and the pixel coordinatesxzof the weld pool tip center are 36 pixels.Therefore,
The real welding deviation ∆ris calculated as

This means that the welding wire is center-left for 5 pixels and the welding deviation is about 0.43 mm.
4 Experimental analysis
Butt welding experiments were conducted and weld pool images were obtained in the cases of no deviation,right deviation,left deviation,and some other than normal circumstances.The welding deviations were calculated by the proposed algorithm of weld pool contouring.Further,the accuracy,stability,and real-time applicability of the proposed algorithm were analyzed.The experimental conditions can be found in Section 1.
4.1 Error analysis
This test considers the position of the center of the Igroove as abscissa.The gap between the workpiece is less than 0.5 mm and the welding length is 160 mm.The angle between the welding path and groove isα;therefore,the welding path is a solid line with a slope ofk=tanα=0.025.Experiments with different welding speedsvwere conducted to weld multiple seams;a total of 155 frames of weld pool images and their respective weld deviations ∆rwere calculated from the weld pool images.When the image of the weld pool is collected in theithframe,the welding torch moves to the position,Pi=v×ti.The horizontal projection of the pointPisx=v×ti× cosαand the vertical projection is ∆t=y=v×ti× sinα.The theoretical welding deviation is∆t.The recognition accuracy of the algorithm reaches|∆t-∆r|≤0.17 mm,as illustrated in Fig.10.
4.2 Stability analysis of the proposed algorithm
There are many interference factors that affect welding stability.To verify the stability of the proposed algorithm,tests were designed as follows.
(1) The stability of the welding deviation algorithm was tested to extract the weld pool tip centerPz.When the Igroove gap is greater than 0.5 mm,the tip of the weld pool disappears and the algorithm fails.
(2) Detection range of the welding error recognition algorithm
The information of welding deviation comes from the horizontal deviation between the tip point of the weld pool image and the location of the welding wire center.The tip of the weld pool is formed by molten metal flowing into the groove.When the welding deviation increases gradually,the amount of molten metal flowing into the groove decreases gradually,resulting in the tip of the weld pool disappearing.In such a situation,the proposed algorithm cannot identify the groove center.This kind of welding is similar to surfacing,where welding deviation cannot be detected.
In the test,the center of the I-groove is considered as the abscissa;the gap between the grooves is less than 0.5 mm and the length of the groove is 160 mm.The path of the welding torch is a slanted solid line with a slope ofk=0.08.The maximum detection value of different weld pool widths and the welding deviation detection algorithm are obtained by changing the welding speed and welding current,as shown in Table 2.
As shown in Fig.11,the abscissa indicates the width ofthe weld pool,and the left vertical axis represents the maximum welding deviation that can be detected.It shows that the maximum welding deviation is related to the weld pool width.When the weld pool width is less than 7 mm,there is a positive correlation between the weld pool width and the welding deviation;in other words,the larger the width of the weld pool,the larger is the detected value of the welding deviation.When the width is greater than 7 mm,the influence of weld pool width on the welding deviation diminishes.The right vertical axis represents the ratio of maximum welding deviation to weld pool width.The ratio is greater than 0.3 and less than 0.5.The larger the weld pool width,the smaller the ratio.

Table 2 Weld pool width &maximum welding deviation

Fig.11 Maximum welding deviation value
4.3 Real-time analysis of the weld pool and image processing
The time for image acquisition was about 0.002 s.It mainly includes the falling edge triggered filter time of 0.001 s,the falling edge trigger delay time of 0.0008 s,and the exposure time of 0.000 2 s.It took about 0.083 s to execute the proposed welding deviation algorithm program.Therefore,capturing photographs and processing them took~0.085 s.This means that the system handles the weld pool image at a rate of no less than 10 frames per second.If the welding speed is 60 cm/min,the system can detect welding deviation after every 1 mm.With this system,the application of a monocular passive sensing system in the detection of weld pool deviation can be realized.
In the experiment,the projection point of the welding wire on the workpiece surface isP0(33,52).The weld pool image sets the length of the ROI by 80 pixels without taking into account the image distortion.The true length of the ROI is about 80×0.086≈6.9 mm,and the maximum distance from the projection point of the welding wire to the tip of the weld pool is less thand=(80 -52) × 0.086 ≈2.4 mm.With the slowest welding speed ofv=30 cm/min=5 mm/s in experiment,it takest=d/v=2.4/5=0.48 s to weld 2.4 mm.It can be seen from experiments that the system avoids the problem of time difference.The real-time detection is ideal.
5 Conclusions
In this study,we proposed a novel method to effectively detect welding deviations using a monocular passive vision system.
(1) The regularity of coincidence of the weld pool tip and weld groove center was found and verified.By experimental analysis,it was concluded that the mechanism of this characteristic phenomenon can be attributed to the melting and filling of the groove with welding wire due to gravity,arc force,and surface tension.Under the action of these forces,the bottom of the weld pool will have a lowest point,that is,the tip of the weld pool image.The method is also suitable for Y-groove and U-groove.
(2) A vision-based seam deviation detection system for CO2gas shield welding is presented.Clear weld pool images and I-groove images can be acquired using the proposed visual system.Moreover,it effectively avoids collecting images with serious pollution.
(3) A method for the real-time measurement of welding deviation from the CMOS images of the GMAW weld pool is proposed.The basic principle of this method is to extract the weld pool contour from the weld pool image and to use the tip position information of the weld pool image as the coordinate value of the groove center position.At the same time,the center position coordinates of the welding wire are calculated using a search algorithm.The horizontal difference between the center of the welding wire and center of the groove is defined as the welding deviation.
(4) The robustness and accuracy of the proposed welding deviation identification algorithm were verified experimentally.The results show that the accuracy of the welding deviation can be controlled to within ±0.17 mm.The algorithm is stable and reliable and meets the requirements for the real-time control of the welding of sheet metal.

- China Welding的其它文章
- Effect of heat treatment on microstructure and properties of single crystal copper cold-welded joints
- Extrusion process and property of AZ31 magnesium alloy
- Lap joining Al5052 to Ti6Al4V by GTAW with AlSi5 filler wire
- Performance study of a complex thermal barrier functional coating with an electro-spark deposited burn-resistant layer
- The microscopic mechanical performance for nonuniform welded joint of nickel-based alloy with nanoindentation
- Interface microstructure and properties of submerged arc brazing tin-based babbit