
Effect of Different Types of Structural Configuration on Air Distribution in a Compact Purification Device
2020-02-01 09:05YANGXuebinLIANGLe梁乐LIUHao刘浩LIULin刘琳LIANGZhen梁珍WANGFang王方
YANGXuebin,LIANGLe(梁乐),LIUHao(刘浩),LIULin(刘琳),LIANGZhen(梁珍),WANGFang(王方)
1 College of Environmental Science and Engineering, Donghua University, Shanghai 201620, China 2 College of Urban Construction and Safety Engineering, Shanghai Institute of Technology, Shanghai 201418, China 3 School of Energy and Environment, Zhongyuan University of Technology, Zhengzhou 450007, China
Abstract: In some old industrial plants, in order to meet the increasingly strict requirements of pollutant emission limits, it is necessary to install the compact filtration and/or purification devices in a given narrow machine room. Different types of structural configuration might influence air distribution inside these devices. The unreasonable air distribution might lead each part of filtration or purification media to operating at largely different air flow rates. Based on a computational fluid dynamics (CFD) model, this study explores the influence of different outlet positions and different upper heights on the flow field inside chamber. The porous medium model is employed to simulate the air flow in porous media. The changing structural configurations include three positioning cases of the outlet opening and eight height cases of the upper chamber. The root mean square is defined as the non-uniformity coefficient to evaluate the uniformity of air flow distribution. The results show that the farther distance between inlet and outlet openings will bring more uniform air distribution, and the increasing height of upper chamber totally trends to exhibit more uniform air distribution.
Key words: structural configuration; air distribution; uniform air distribution; compact purification device; coefficient of velocity inhomogeneity
Introduction
In order to deal with the particulate or gaseous pollutants produced in painting workshops, some filters or porous adsorbents are usually used to intercept or adsorb pollutants to meet the national or local emission standards. For the treatment process of gaseous pollutants, once the porous media reaches its saturation, the incoming hot air desorbs the pollutants adsorbed in media. The desorbed pollutants with high concentration is treated by thermal combustion or catalytic oxidation, and the relatively clean gas must meet the concentration emission limits specified in the standards before being discharged to the external atmospheric environment.
To effectively control the pollutants, some materials[1-2]or technologies[3]have been developed and applied to improve purification efficiency. In the treatment process, many materials possessed some disadvantages. It has been reported that the desorption temperature of zeolite molecular sieve[4]can increase to more than 180 ℃. The higher desorption temperature brings higher desorption efficiency and better operating safety. However, the price of zeolite is about five times higher than that of activated carbon. Higher initial investment cost requires more reliable operation of equipment.
Many researchers have investigated the uniformity of flow distribution in industrial equipment, involving the inlet structural configuration, various geometric parameters and so on.
Reviewed from the published literatures, some changes have been conducted in inlet structural configurations to improve flow characteristics.
The perforated plates emerging from a wide-angle diffuser have been used to improve the air flow in electrostatic precipitator systems. Also, the inlet velocity profiles could influence the air velocity distribution in the electrostatic precipitator. The flow pressure losses in pipes depend on the change of the attack angle[5]. Different configurations of an asymmetric wide-angle diffuser could change the velocity distribution downstream[6]. Bayazitetal.[7]studied the influence of plate geometry on air flow uniform distribution in wind tunnels. Choietal.[8]investigated the flow uniform distribution in a a two- dimensional channel based on non-uniform porosity distribution.
The box complex method was used to explore the optimal positioning of guide plates in flow manifolds[9]. The shape optimization of a tee guide vane was conducted to improve the air flow in ventilation ducts[10].
Huangetal.[11]investigated the effects of geometric structures of air deflectors on thermo-flow performances in air-cooled condensers. The flow-guide device has been used to adjust the pressure distribution of duct branches in the exhaust ventilation system[12]. Zhaoetal.[13]explored the effects of air deflectors on air flow mechanism in dry cooling towers.
A lot of literatures have investigated various geometric parameters to improve flow characteristics. Czetanyetal.[14]investigated the uniform air distribution on the outlets for rectangular ducts at a constant height and variable widths. For the steam ejector for recovery of waste heat, Wuetal.[15]analyzed the optimal structure parameters based on computational fluid dynamics (CFD) model and orthogonal tests. For the grooved channel with curved flow deflectors, Lorenzini-Gutierrezetal.[16]revealed the effect of different geometric parameters (deflector radius, deflector position and channel height) on the thermal and hydraulic behaviors. Nakhchi[17]researched the effects of geometric and flow parameters on pressure drop and thermal performance in sinusoidal wavy channels. Tahanietal.[18]investigated the geometrical parameters of chord, twist distributions and airfoils at different sections to capture the maximum amount of available power. Amanowicz[19]investigated the flow characteristics and total pressure losses to the change of multi-pipe exchanger geometry. For the heat exchanger tubes fitted with perforated conical rings, Nakhchi and Esfahani[20]explored the influence of different geometrical parameters of perforated conical rings on flow structure and heat transfer. For the S-type Pitot measuring the stack gas velocity, Nguyenetal.[21]investigated the effect of various geometries on velocity changes in actual smokestacks. For the subcooled flow boiling in confined microchannels, Hongetal.[22]analyzed the effect of the geometric parameters on bubble behaviors and heat transfer performance. For the throat-tapped flow nozzle, Furuichi and Terao[23]revealed the influence of geometric parameters on the discharge coefficient.
In this study, the air distribution inside a chamber is investigated by changing the structural configuration. Section 1 overviews the current devices to achieve uniform flow in the published literatures. Section 2 develops a CFD model and verifies the model computational accuracy. Section 3 establishes the simulation model of a purification device. Section 4 investigates the influence of different outlet positions and different upper heights on air distribution.
1 Numerical Calculation and Verification
CFD employs numerical methods to directly solve the main flow governing equations in order to discover the phenomena of air distribution. Compared with analytical and experimental fluid dynamics, CFD can provide detailed, visualized and comprehensive information. The ANSYS Fluent 19.2 software is employed as the numerical calculation tool.
The standardk-εmodel is effectively used to simulate different types of flows such as jets and mixtures. In view of the mixed pollutant gas simulated in this study, the standardk-εmodel is used without considering the heat exchange between gas and device walls.
Free outflow is selected as the boundary conditions of air inlet and outlet openings. The standard non-slip wall boundary conditions are selected for wall conditions. All surfaces except air inlet and outlet openings are set as wall conditions. Large meshes are used in the numerical model. The parameter settings of the control equation are shown in Table 1.
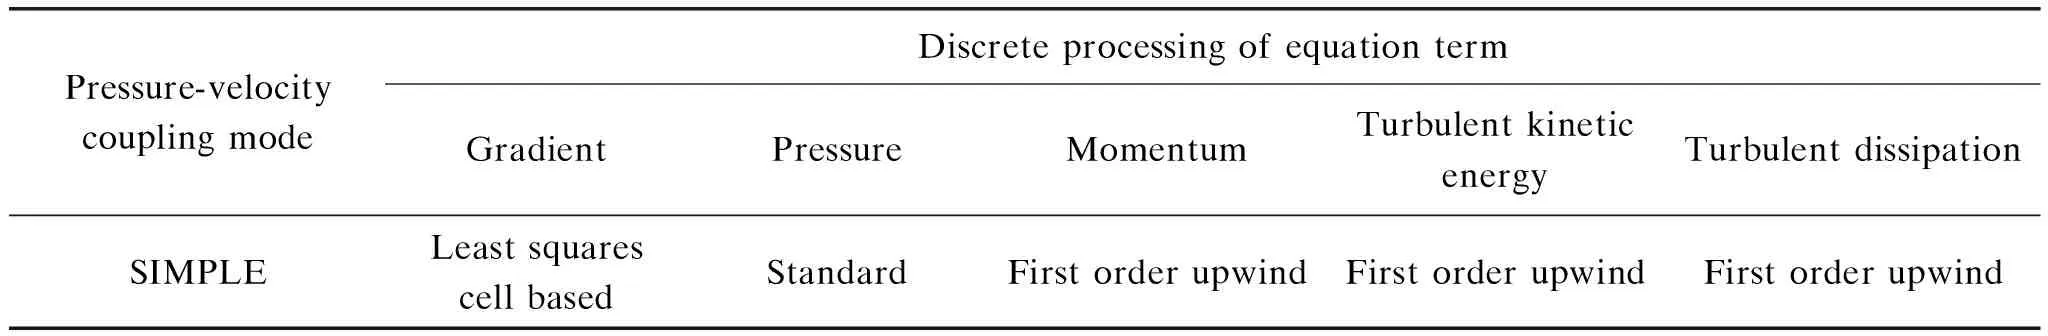
Table 1 Parameter settings of control equation in numerical simulation model
1.1 Verification of numerical calculation
The numerical calculation should be verified to identify and quantify the errors in solutions, and to assess how accurately the computational results meet with the experimental data[24]. The best way to check whether parameter settings of the control equation, boundary conditions and modeling process are correct or not, is to use the field measured data. In most cases, however, the field measurement of full-scale equipment is time-consuming and labor-intensive. In this study, the validated data are from Ref.[25]. The scale-reduction wind tunnel experiment is with a scaled ratio of 1∶30. A numerical model is developed under the same conditions. As shown in Fig. 1, the difference between simulated and experimental velocities at each measuring point is less than 0.5 m/s, and the average difference is 0.19 m/s. The correlation coefficientR2is 0.982. Some non-ideal factors in the simulating process, as well as the great difference between the finite element model and the actual flow scenario, might lead to a certain degree of deviation between the simulated and measured values.

Fig. 1 Comparison between simulated and measured value
1.2 Analysis of computational errors
The errors between numerical calculation and experimental values are from the approximate error of the physical model, the truncation error of difference equations, the discrete error, the iteration error and the rounding error of the solving region.
Generally, the discrete error decreases with the decrease of mesh size, but the number of discrete points increases with the decrease of the mesh size, and the rounding error increases with the increasing mesh size. More meshes are not always better, and too large or too small might lead to great calculating errors. The mesh number within a certain range will bring close calculated results to the experimental values.
This requires that the mesh should be roughly divided and solved according to the parameters of the existing model. The simulated results are compared with the experimental values. Then the mesh is partially encrypted or reduced according to the comparison. If the difference between two last calculation results is small, the computational results are considered acceptable.
2 CFD Simulation Model
In section 2, the parameter settings of the control equation, boundary conditions and modeling process in the numerical simulation model, have been checked by the experimental data from Ref.[25]. This section establishes the simulated model of a purification device.
2.1 Geometric structure
The geometric structure and spatial dimensions of an adsorbent device is shown in Fig. 2.His the distance from the adsorbent surface to the chamber top (mm), andLis the length of the adsorbent chamber (mm). The inlet opening is located atH=1 500 mm andL=50 mm on the top of the device, and the air outlet is located atH=0 andL=950 mm. The sizes of both inlet and outlet openings are 600 mm× 600 mm. The size of the upper chamber is 1 600 mm× 900 mm × 450 mm, the size of porous media is 1 600 mm × 900 mm × 600 mm, and the size of lower chamber is 1 600 mm × 900 mm × 450 mm.
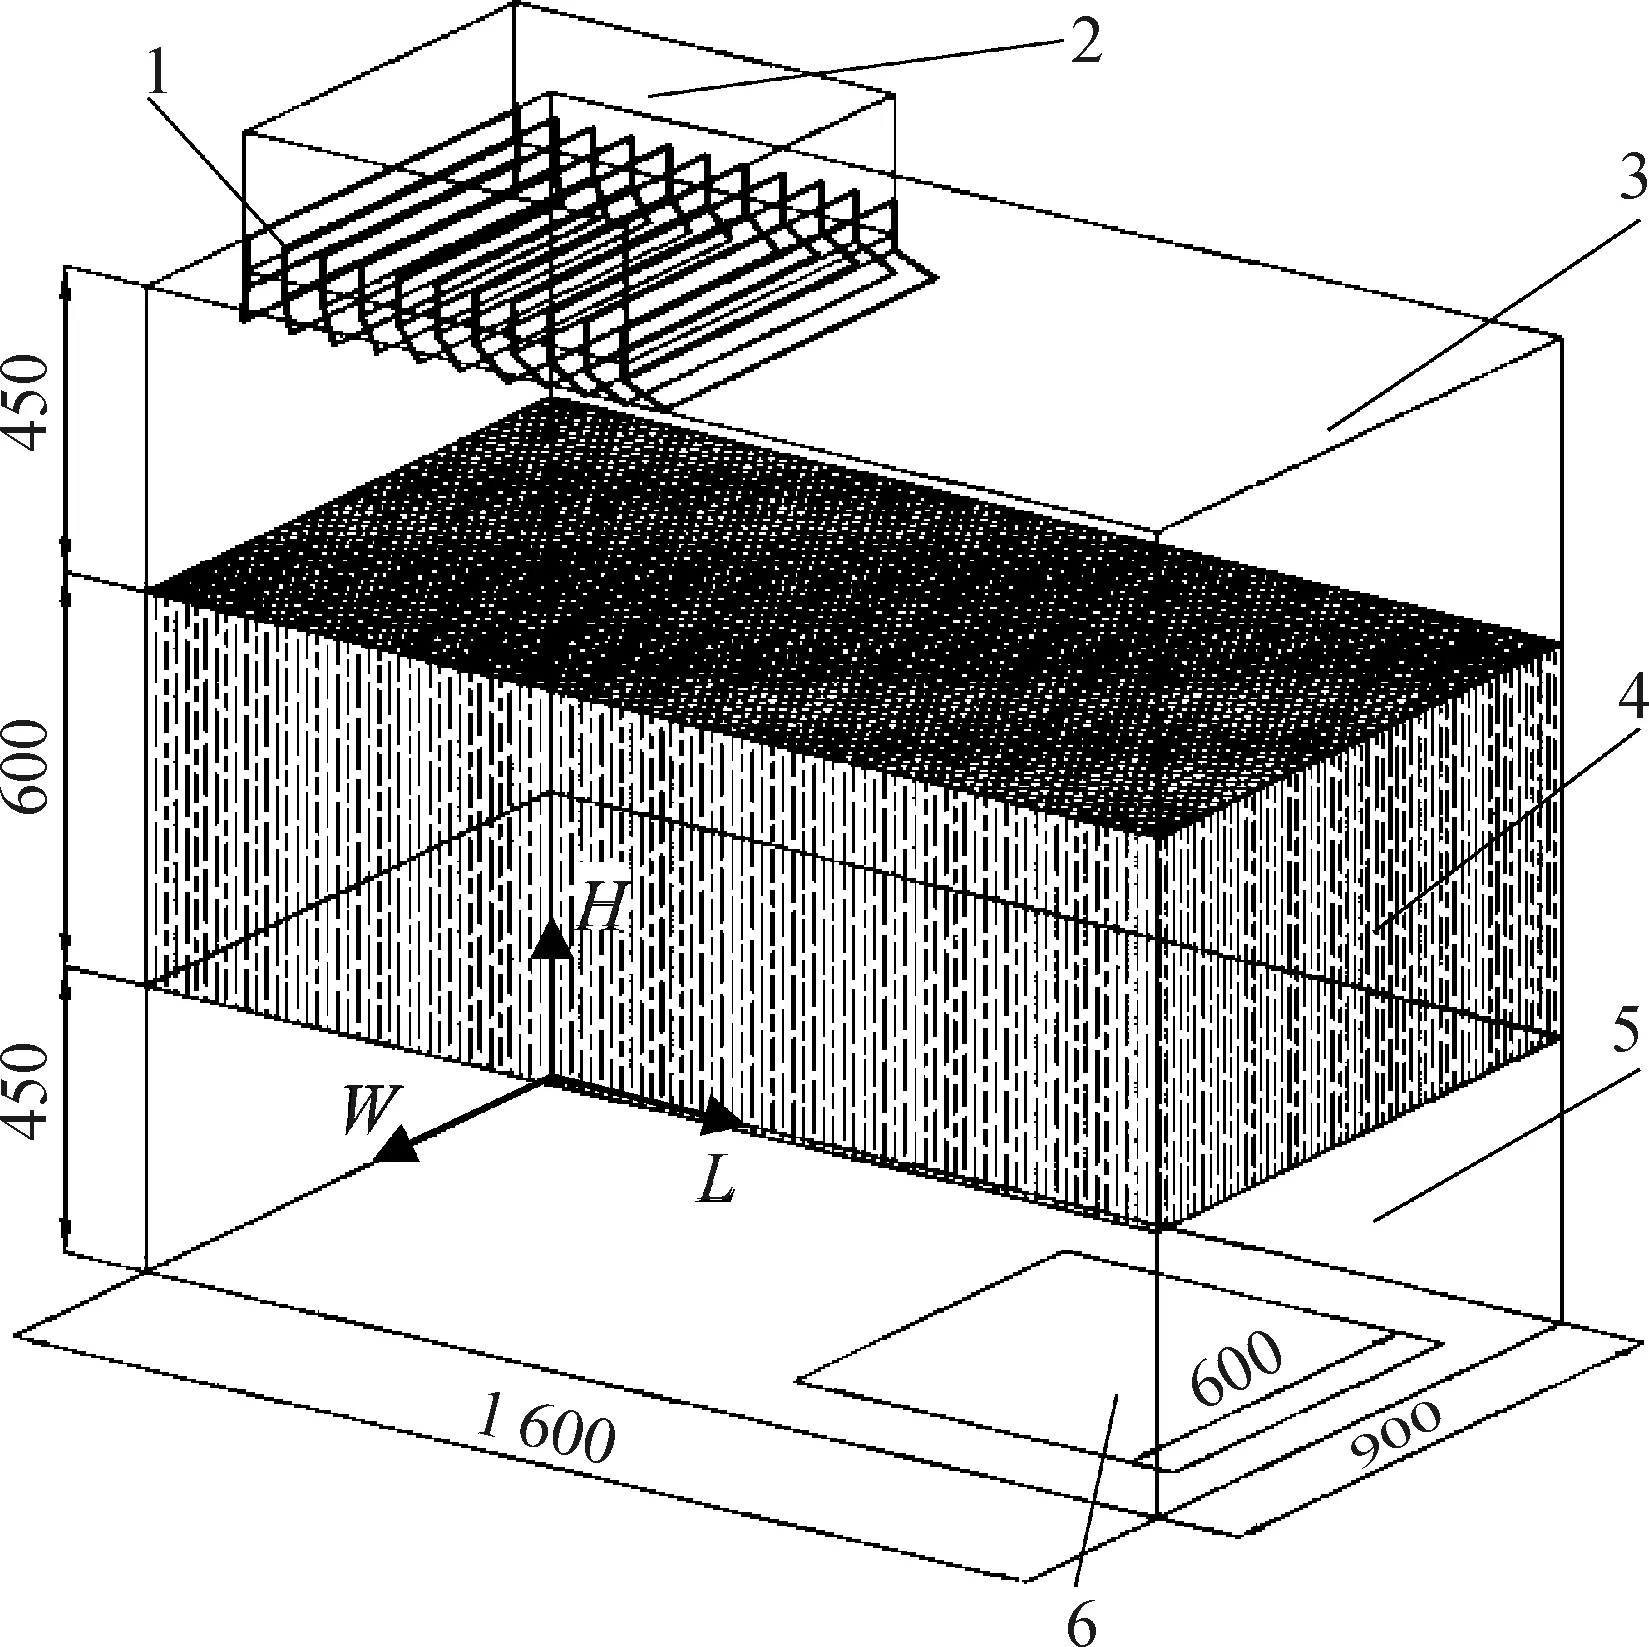
1-deflector; 2-inlet opening; 3-upper chamber; 4-purification material; 5-lower chamber; 6-outlet opening.Fig. 2 Geometric structure and spatial dimensions of purification device
2.2 Simulation model
Reynolds number is the criterion to judge whether the fluid flow belongs to laminar or turbulent flow. The calculated Reynolds number is 39 534 which is far greater than the critical value 2 320[26], and the air flow is turbulent. The air flow rate through the purification device is 5 000 m3/h, and thus the face velocity at the inlet opening is 3.86 m/s. The air temperature is nearly 20 ℃, and the working condition is much close to the normal atmospheric pressure. The air density is 1.293 kg/m3, and the aerodynamic viscosity coefficient is 1.79×10⁻⁵Pa·s.
Porous medium model (PMM) and porous jump model (PJM) are two theoretical models to deal with filtration, heat transfer and air flow related to porous media. PMM can simulate the internal flow in porous material and can reflect their main airflow characteristics. The calculating results of resistance coefficient are shown in Table 2.

Table 2 Calculating results of resistance coefficient
The air flow can be regarded as an incompressible and non-high-speed fluid, and thus the SIMPLE pressure-velocity coupling algorithm is employed in the solver algorithm. The hybrid meshes are used in the mesh generation, and the second order upwind discrete format is adopted for each item.
2.3 Mesh independence verification
The finite element model is used in the numerical computation. The mesh quality directly affects the computing accuracy. The lower mesh density will lead to larger errors and even lower computational accuracy. Too higher mesh density will improve the computational accuracy, but will lead to too much calculation.
The model using structured meshes has the advantages of fast calculation speed, good convergence and relatively higher computational accuracy. For the model with a complex geometric structure, unfortunately, it is difficult to divide all parts into structured meshes. On the contrary, the hybrid meshes combining unstructured meshes with structured meshes are used in some areas. In order to ensure that the simulated results are independent of the number of meshes, it is necessary to test the mesh independence in order to minimize the error between numerical calculation and experimental measurements.
Given the boundary conditions and solution parameters (the inlet velocity is 3.85 m/s, the number of deflectors is 7, and the deflector width is 50 mm), the model calculations are compared by three mesh cases including the mesh numbers of 1.4 million, 3 million and 6.4 million. The residual of each variable will converge at about 2 000 iterations. The calculated results show that the average velocity of the three mesh models is 4.31 m/s at the highest position planeH=1.3 m. Their maximum difference of the air velocity is 0.09 m/s and the error is 4.28%. The calculated results are basically independent of the number of meshes and thus 1.4 million meshes are employed in the subsequent numerical model.
3 Case Study
Three cross sections are atW=0.45 m,L=0.35 m andH=1.06 m in the adsorbent device, respectively. The cross sectionW=0.45 m is intercepted at the plane in the center of the device, the cross sectionL=0.35 m is at the plane in the center of the inlet opening, and the cross sectionH=1.06 m is located at the inlet airflow edge of porous media. The flow characteristic at sectionH=1.06 m represents the air distribution entering the porous media.
3.1 Different position of outlet openings
This section studies the influence of the outlet position on the internal flow field of the purification device. Given that the air volume is 5 000 m3/h, the average velocity at the inlet opening is 3.86 m/s, the deflector number is 11, the width of deflectors is 100 mm, and the upper chamber height is 0.45 m.
Three positioning cases of the outlet opening include: (1) right below the inlet andL=0.35 m; (2) center of bottom of the chamber andL=0.80 m; and (3) farthest below the inlet andL=1.25 m.
3.1.1Evaluationofairdistribution
Figure 3 illustrates the velocity distribution ofH-direction on the planeW=0.45 m at three different positions of the outlet opening, which includes right below, central bottom and farthest below. It can be seen from Fig. 3 (a) that the velocity on the surface of porous media changes obviously, and the velocity of the outlet position is the same as that of the inlet position. The air velocities in theL-axis region from 0 to 0.4 m are higher than those in other regions. This means that more polluting gas flows through the left side of the purification medium. After long-time operation, the left region will reach the service life earlier than other regions.
As depicted in Fig. 3(b), the position of the outlet is in the middle of bottom. The inconsistency of the airflow velocity on the upper surface of porous media is improved but there still exists small parts where the downward velocities are higher than those in other regions.

Fig. 3 Distribution of H-direction air velocity vector on the plane W=0.45 m at different central positions of outlet opening: (a) right below the inlet and L=0.35 m; (b) central bottom of the chamber and L=0.80 m; (c) farthest below the inlet and L=1.25 m
As shown in Fig. 3(c), the downward velocity near the surface of porous media is basically about 1 m/s. The air distribution is so even that each part of adsorbent is used equally and no parts are used excessively. In addition, the air velocity in the range of -1.5 m/s to -1.0 m/s is obviously larger than those at the outlet located on the left side and the middle of the bottom. The diffusion distance is much longer, and the air flow is more uniform.
Figure 4 shows the downward velocity distribution on the planeH=1.06 m at three different positions of the outlet opening, which includes right below, central bottom and farthest below. On the planeH=1.06 m, the air velocity in the range of -1.5 m/s to -1.0 m/s is gradually enlarged if the position of the outlet opening is getting farther from the inlet. In some regions near the chamber wall, the air velocities range from -0.5 m/s to 0. The main reason is that these regions exist some eddy currents which are formed by the deflected airflow when the air rushes into the chamber and collides into porous media.
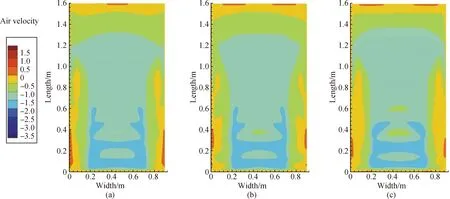
Fig. 4 Distribution of H-direction air velocity vector on the plane H=1.06 m at different central positions of outlet opening: (a) right below the inlet; (b) central bottom of the chamber; (c) farthest below the inlet
Generally speaking, in the upper chamber, the velocity at the surface of porous media tends to distribute more and more evenly if the distance between inlet and outlet openings is getting farther and farther. In the upper region far from the upper inlet, there are no obvious changes in the vortices with upward velocity. The closer the area is to the side of chamber, the faster upward speed is. The maximum velocity is more than 1.0 m/s. For the velocity ranging from -2.0 m/s to -1.5 m/s, theL-axis region of the right bottom outlet ranges from 0 to 1.1 m, while that of the farthest bottom is from 0 to 1.2 m.
In the lower chamber, the downward velocities are greater than 1.0 m/s at the region close to the outlet, and the maximum distance away from the edge of the outlet inLdirection is less than 0.2 m. Although the position of the outlet opening is various, the velocity distribution near the outlet is not changed obviously. This indicates that different outlet positions have little influence on air distribution in the lower chamber.
3.1.2Evaluationofairdistribution
The root mean square (RMS), which is more sensitive to the non-uniform response of the airflow field, is defined as the non-uniformity coefficient to evaluate the air distribution on the inlet plane of purification media. The RMS value is calculated by the standard deviation of individual air velocity to the average section velocity at the entrance section of purification media. Statistically, the RMS value represents the dispersion degree of the single airflow velocity from the average velocity. Greater RMS value means larger difference among the velocities and less uniformity. The RMS values less than 0.25 can be deemed as qualified, and those greater than 0.25 are unqualified.
The non-uniformity coefficient is formulated as
(1)

Table 3 shows the average surface velocity, the global velocity interval and the non-uniformity coefficient of the downward velocity on the planeH=1.06 m at various outlet locations. For the outlet openings located at the position (L=0.35, 0.80, 1.25 m), the RMS values ofH-direction velocities are 0.232, 0.217, and 0.180, respectively. The best airflow uniformity is the position where the inlet and outlet openings are arranged on the opposite side of the chamber, and the worst one is the position where the inlet and outlet openings are arranged in the same side.
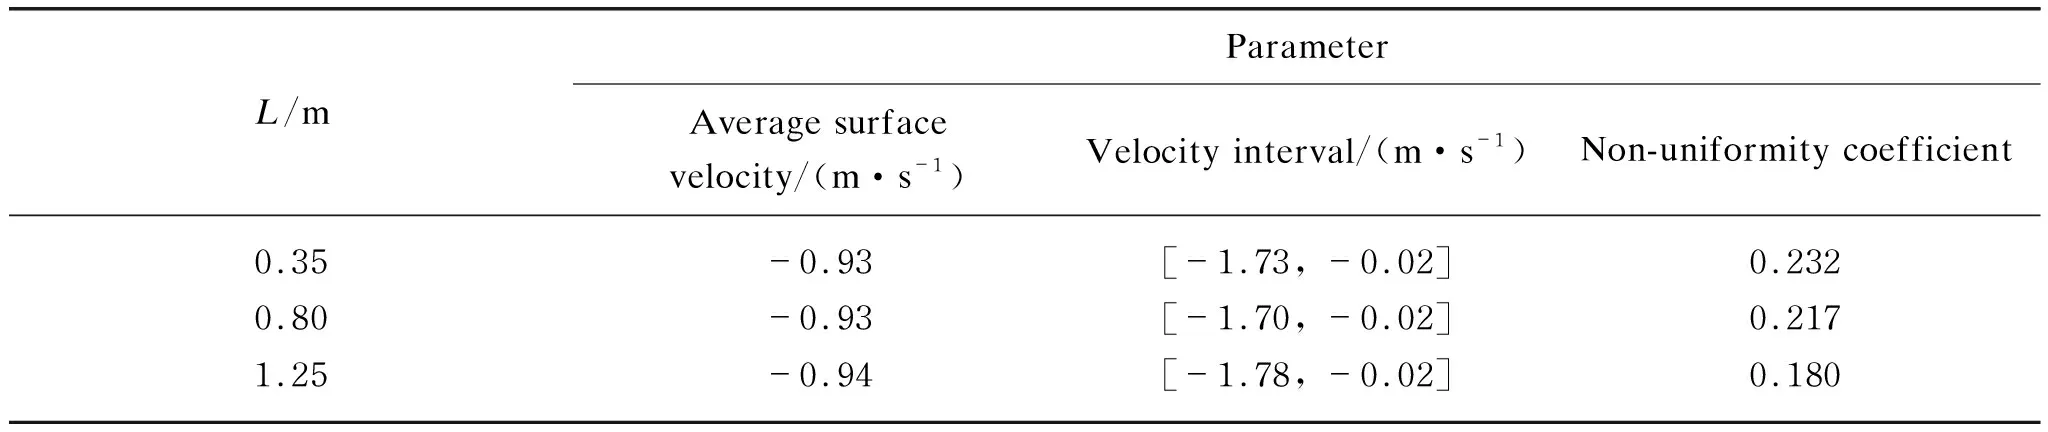
Table 3 Comparison of H-direction air velocity on the plane H=1.06 m with outlet openings at different positions of outlet openings
3.2 Different heights in upper chamber
Air deflectors can effectively improve the uniformity of air distribution in the purification device, but due to the limitation of chamber size, the flow distance in the chamber seems too short to limit the full diffusion of air flow. The whole air diffusion region can be enlarged by changing the height and the size of the upper chamber.
Given that the air flow rate through the purification device is 5 000 m3/h, thus the average velocity at inlet opening is 3.86 m/s. The outlet opening is on the bottom of the chamber and farthest below the inlet. And 11 deflectors with a width of 100 mm are set up on the inlet opening. As listed in Table 4, the height of the upper chamber is defined as eight cases from 350 mm to 700 mm with an interval of 50 mm.

Table 4 Different height cases of upper chamber
3.2.1Distributionofairvelocity
The ideal condition for the most uniform airflow distribution is that the number of deflectors or perforated plates should be as large as possible and each deflector is long enough to reach the entrance of filtering and purifying media materials. That is, there is enough chamber space between deflectors and media materials to fully diffuse the air, and thus the pressure and velocity distribution on the inlet surface of media materials can be as uniform as possible. The chamber space is enough to avoid the influence of the inlet flow.
Figure 5 indicates the distribution of theH-direction air velocity vector on the planeL=0.35 m at eight types of upper chamber heights. It is assumed that the velocity along the positiveH-axis direction is positive and the velocity along the negativeH-axis direction is negative.
Totally, higher chamber height leads to longer air flow path through deflectors towards the media materials. In the region (L=0-1.3 m), the air velocity is from -1.0 m/s to 1.6 m/s. This region tends to expand much more with the increasing chamber height. In the region (L=1.3-1.6 m), the air velocity at the inlet plane of filtration material is from -1.0 m/s to 0. In the upper part of the chamber, there exists a vortex region with upward airflow velocity, and the maximum value is even up to 2.0 m/s. This vortex region with upward flow velocity will increase with the increasing chamber height.
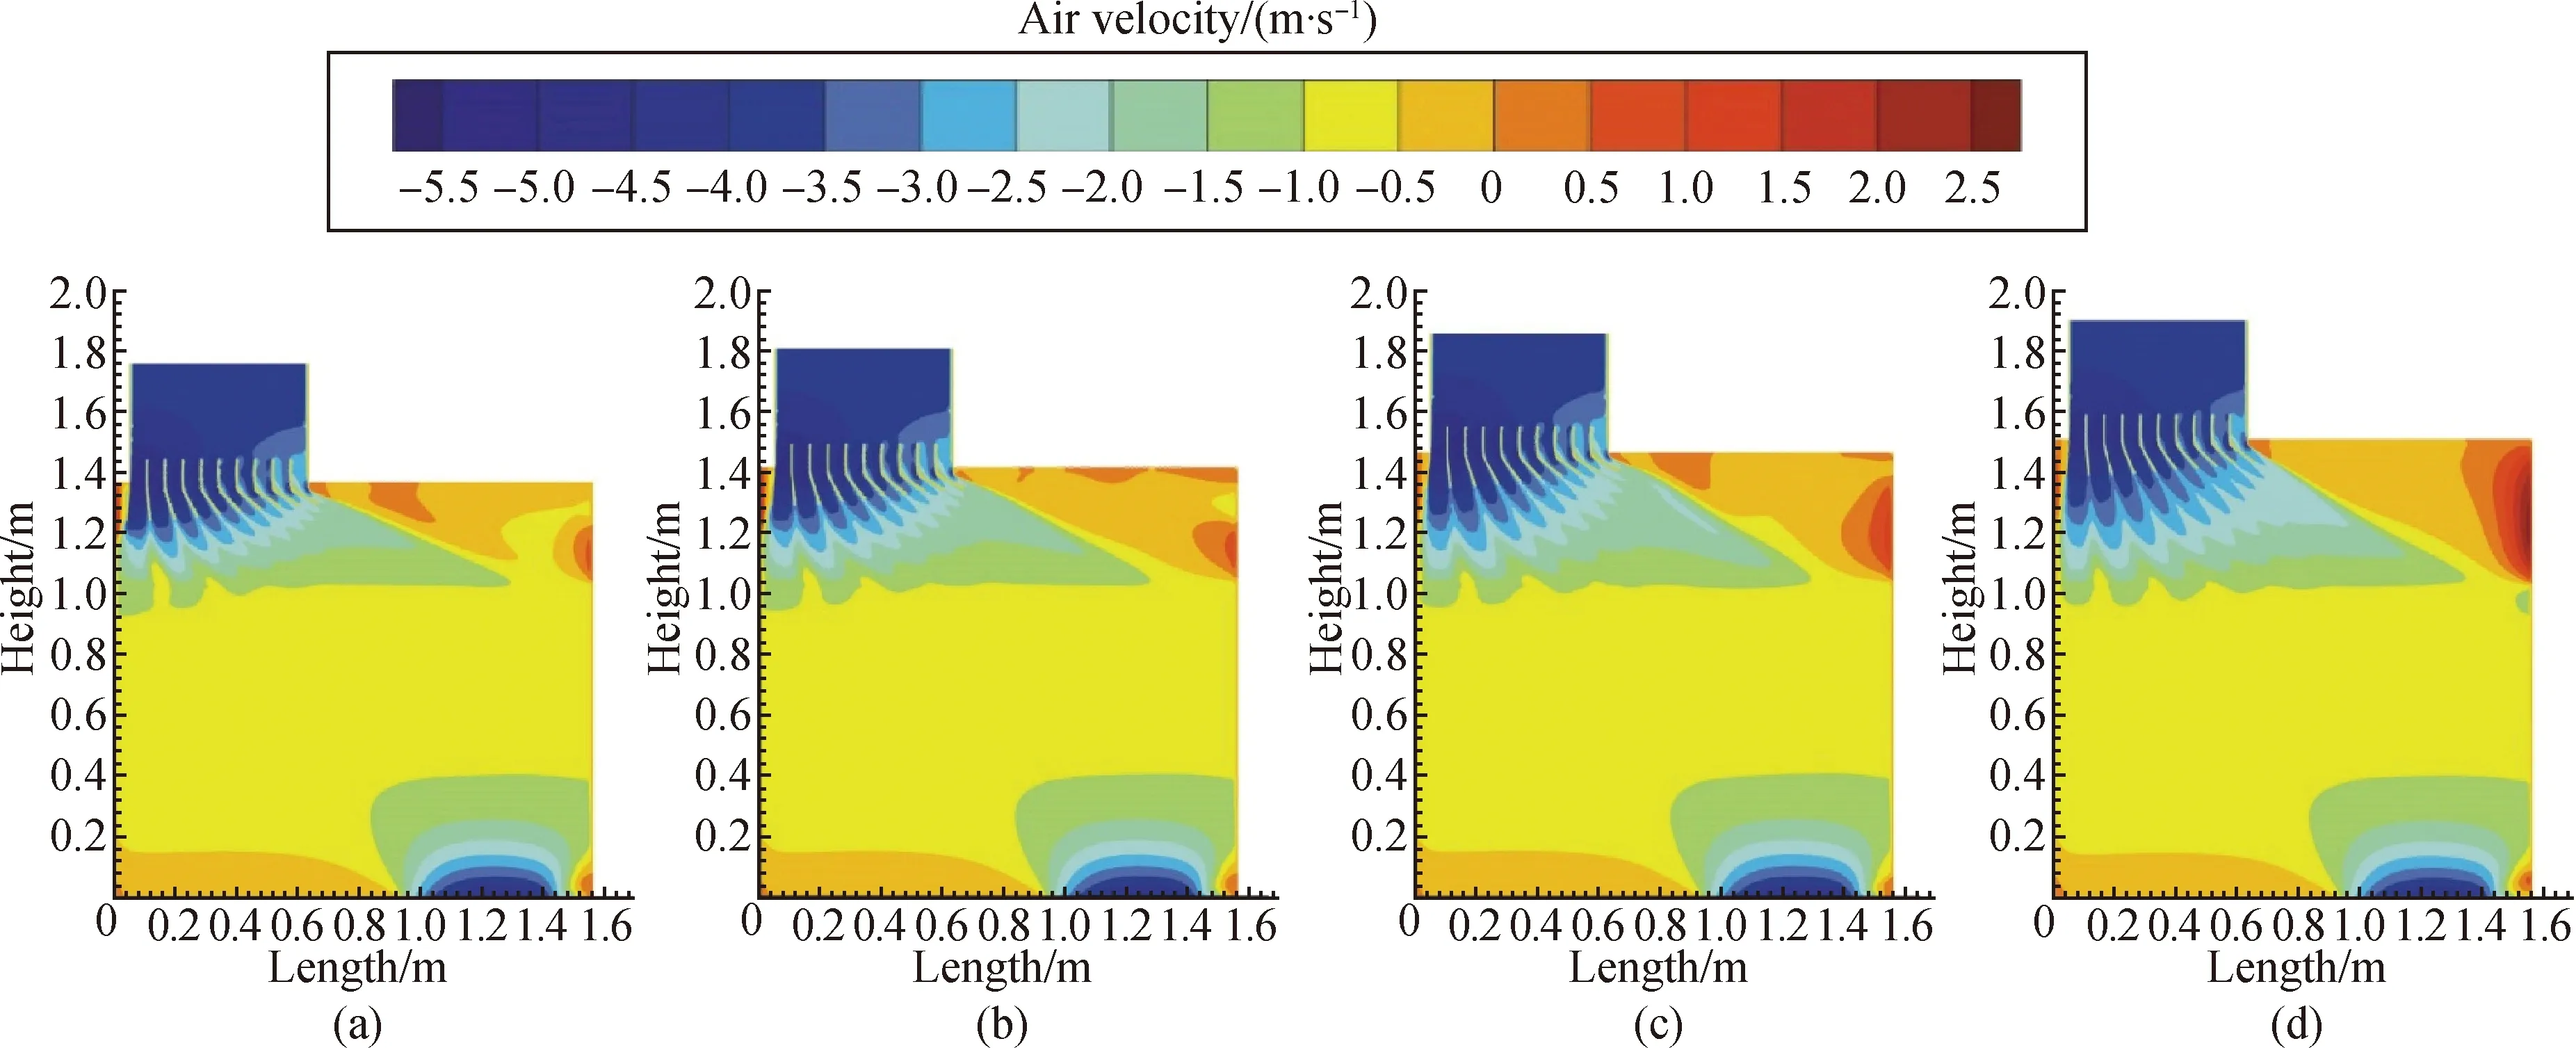

Fig. 5 Distribution of H-direction air velocity vector on the plane L=0.35 m at different upper chamber heights: (a) 350 mm; (b) 400 mm; (c) 450 mm; (d) 500 mm; (e) 550 mm; (f) 600 mm; (g) 650 mm; (h) 700 mm
Figure 6 illustrates the distribution of theH-direction air velocity on the planeH=1.06 m under different upper chamber heights. The negativeH-direction velocity in the range of -2.5 m/s to -1.3 m/s mainly concentrates in the region (L=0-0.6 m) where this velocity gradually enlarges with the increasing height of the upper chamber. The velocity in the region (L=0.6-1.4 m) is mainly in the range of -1.3 m/s to -0.4 m/s. In the region from 0 to 0.8 m/s near the chamber wall, the positiveH-direction velocity decreases with the increase of the chamber height. Generally speaking, the velocity distribution trends to be more uniform with the increasing height of the upper chamber.
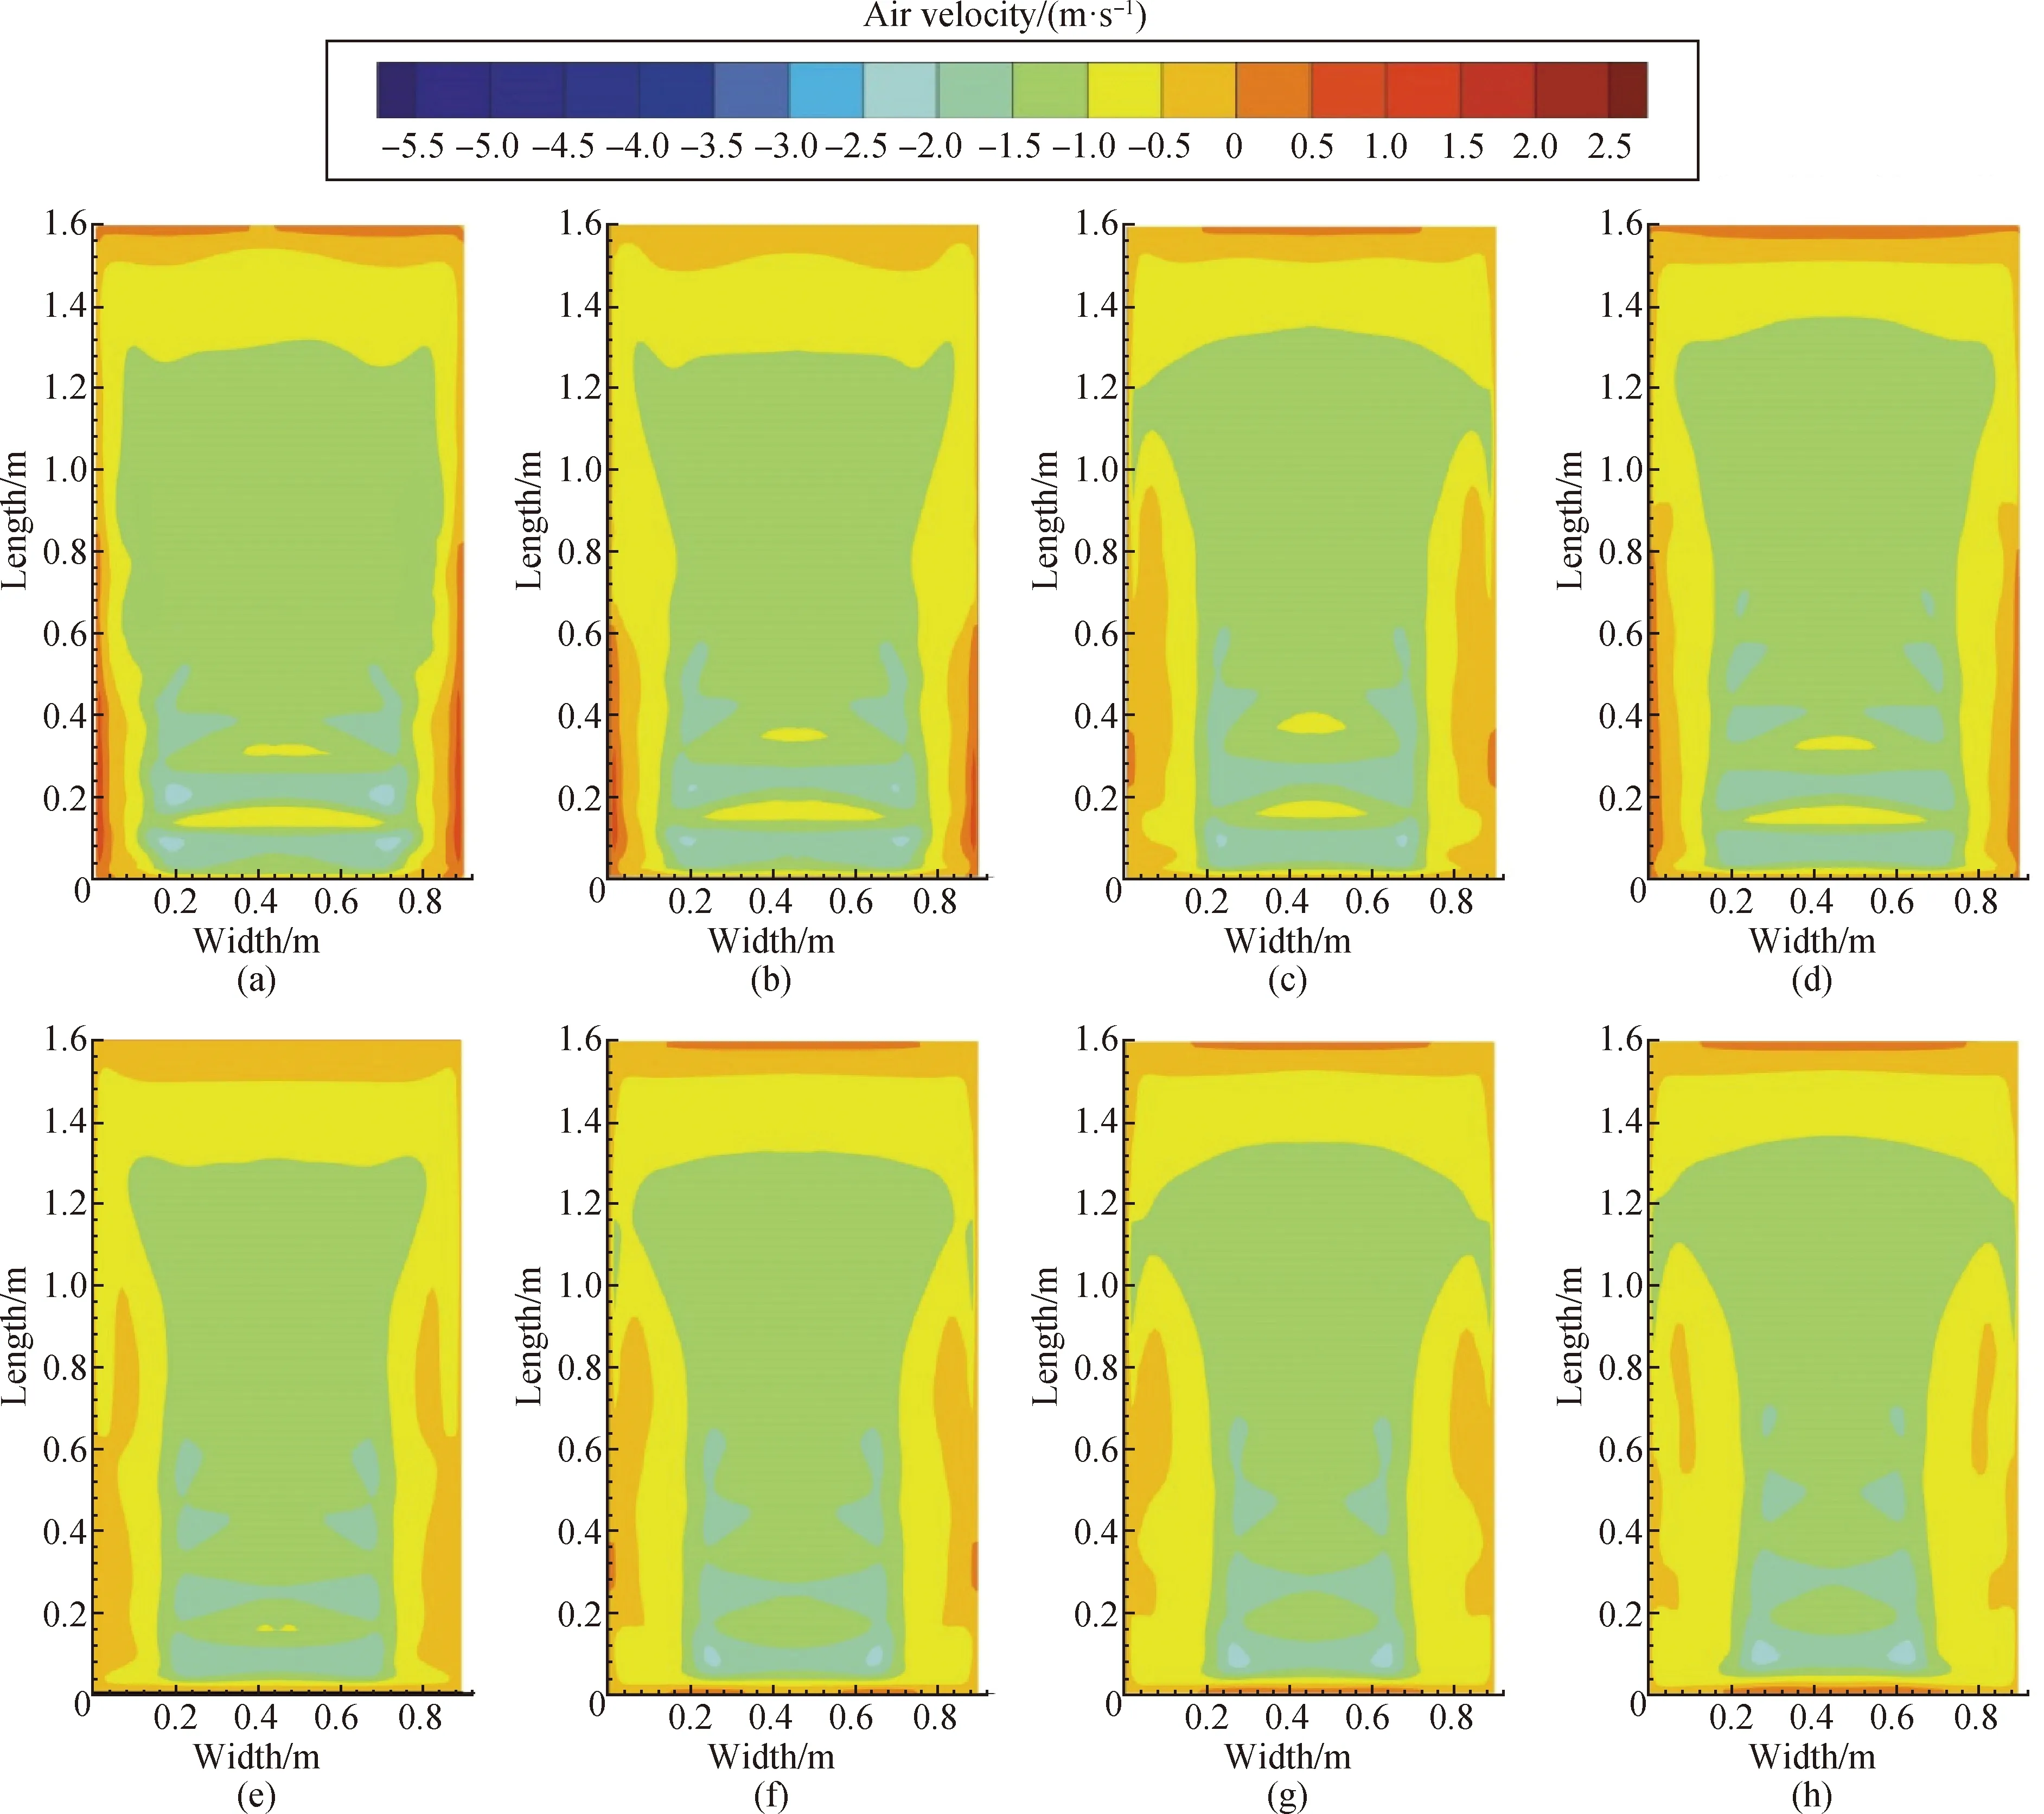
Fig. 6 Distribution of H-direction air velocity vector on the plane H=1.06 m at different upper chamber heights: (a) 350 mm; (b) 400 mm; (c) 450 mm; (d) 500 mm; (e) 550 mm; (f) 600 mm; (g) 650 mm; (h) 700 mm
The distribution of theH-direction air velocity vector on the planeL=0.35 m is shown in Fig. 7. In the upper chamber where the pollutant gas enters, the region of negativeH-direction velocity is mainly converged the regionW=0.2-0.7 m. In the vicinity ofH=1.06 m near the entrance surface of media materials, the velocity of the region (W=0.2-0.7 m) is from -1.5 m/s to -1.0 m/s. In the region near the chamber wall, there will be positiveH-direction velocity due to the existence of vortices. Totally, with the increasing heights of the upper chamber, the area of negativeH-direction velocity from -1.5 m/s to -1.0 m/s decreases, but the area of velocity from -1.0 m/s to -0.5 m/s increases. Similarly, in the region near the chamber wall, the vortices region increases and the maximum of the positiveH-direction velocity decreases.

Fig. 7 Distribution of H-direction air velocity vector on the plane L=0.35 m at different upper chamber heights: (a) 350 mm; (b) 400 mm; (c) 450 mm; (d) 500 mm; (e) 550 mm; (f) 600 mm; (g) 650 mm; (h) 700 mm
3.2.2Evaluationofairdistribution
Assuming that the direction of the air velocity is the same as that ofH-axis, the negative velocity means their direction along the negativeH-axis. Table 5 shows the average surface velocity, velocity interval and non-uniformity coefficient at different upper chamber heights. The average surface velocity is basically maintained at -0.94 m/s, because their total airflow rates are identical and given as 5 000 m3/h.
When the height of the upper box decreases gradually, the global velocity range shows a trend of increasing at first and then decreasing. When the height of the upper chamber increases gradually, the global velocity interval decreases firstly, then increases and finally decreases. At the same time, when the height of the upper chamber decreases, the non-uniformity coefficient decreases slightly. When the chamber height increases to 550 mm, non-uniformity coefficient reaches 0.225, which exhibits the most non-uniformity of the flow field inside the equipment. When the height of the box exceeds 550 mm, the non-uniformity coefficient begins to decrease gradually. When the height reaches 700 mm, the RMS value is 0.132, and 41.33% less than that at 550 mm.
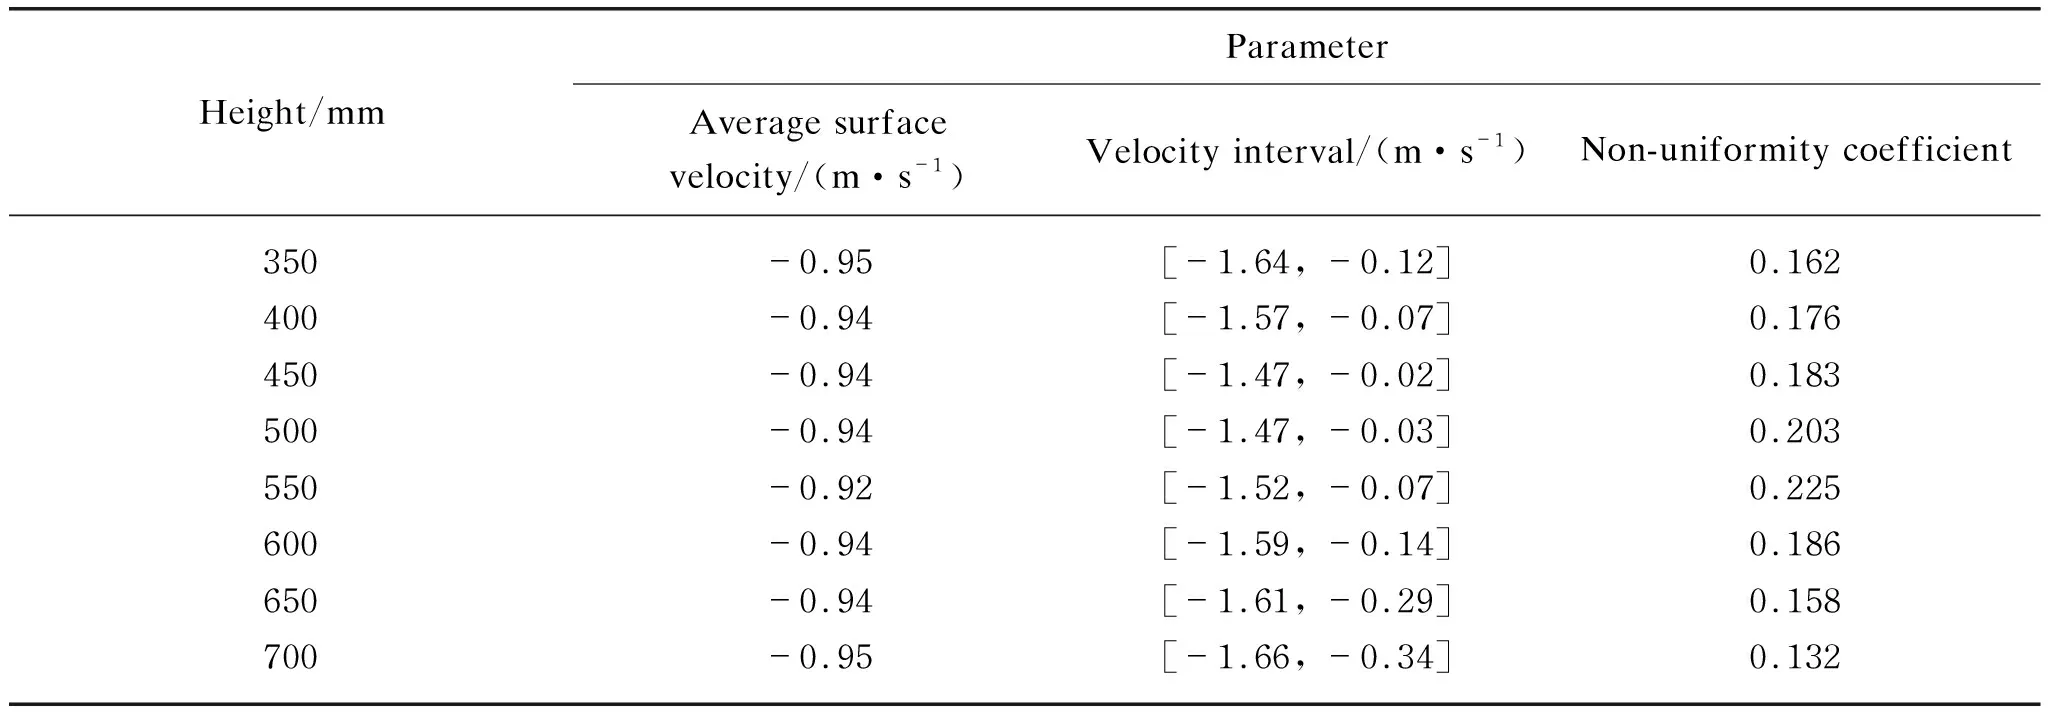
Table 5 Comparison of H-direction air velocity on the plane H=1.06 m at different heights
4 Conclusions
This study investigates the air distribution under different structural configurations, such as changing the position of the outlet opening and the height in the upper chamber. The non-uniformity coefficient is used to evaluate the air distribution.
(1) Farther distance between inlet and outlet openings will lead to more uniform air distribution. The case where inlet and outlet openings are arranged on the opposite side of chamber exhibits the best airflow uniformity.
(2) Increasing the height of the upper chamber properly can improve the uniformity of air flow field. With the increasing height of the upper chamber, the non-uniformity coefficient of velocity distribution totally trends to increase firstly and then decrease.
(3) The results can contribute to the selection of the compact structural configuration of purification devices. Farther distance between inlet and outlet openings, as well as the chamber height of 350 mm, are recommended in the studied cases.
猜你喜欢
江苏广播电视报·新教育(2022年3期)2022-05-16
Chinese Physics B(2022年2期)2022-02-24
经理人·中国保险家(2021年1期)2021-03-25
东西南北(2020年16期)2020-12-10
故事会(2018年20期)2018-10-17
赤水源(2018年2期)2018-04-21
校园英语·中旬(2017年6期)2017-07-13
Coco薇(2015年3期)2015-12-24
当代党员(2015年3期)2015-03-09
 Journal of Donghua University(English Edition)2020年6期
- Journal of Donghua University(English Edition)的其它文章
- Physicochemical Properties of Poly (Vinyl Alcohol)/Chitosan/Soluble Starch Composite Hydrogel
- Synthesis, Structure and Properties of a Novel Copolymer with Photochromic and Photoluminescence Functions
- Dynamic Modeling of Variable Stiffness and Damping for Spatial Linkage Weft Insertion Mechanism with Clearance
- Design and Lamination Process of Composite Fabric for Automobile
- Energy-Delay Tradeoff for Online Offloading Based on Deep Reinforcement Learning in Wireless Powered Mobile-Edge Computing Networks
- Optimization Method of Bearing Support Positions in a High-Speed Flexible Rotor System