
Mode transition induced by gas pressure in dusty acetylene microdischarges: twodimensional simulation
2020-05-06 05:59XiangmeiLIU刘相梅NingningZU祖宁宁HongyingLI李洪影andJingyaoLI李景尧
Plasma Science and Technology 2020年4期
关键词:宁宁
Xiangmei LIU (刘相梅),Ningning ZU (祖宁宁),Hongying LI (李洪影) and Jingyao LI (李景尧)
School of Science,Qiqihar University,Qiqihar 161006,People’s Republic of China
Abstract
Keywords:radio-frequency capacitive discharge,acetylene microplasma,nanoparticle dynamics
1.Introduction
Microdischarge has been widely studied by many researchers because of their extraordinary properties such as small physical size,high electron densities,stable operation at atmospheric pressure,and non-thermal characteristics[1,2].These properties result in the use of microplasma in a variety of material processing and biomedical applications,especially in thin film deposition and nanomaterials synthesis [2].Raballand et al [3] investigated the deposition of carbon-free silicon dioxide films by means of capillary plasma electrode discharges,and the residence time that is controlled by the distance between sample and plasma was confirmed to be able to adjust the polymerization sequence.Shortly afterwards,the silicon dioxide (SiOxHy) film deposition based on atmospheric pressure microplasma jet was reported by Reuter et al[4].In their studies,two jets are centered in front of a rotating substrate holder with a distance of 4 mm in parallel at a distance of 40 mm.The results show that SiOxHyfilm could be achieved and the main carbon loss mechanism from the film is a surface reaction with oxygen.Besides,because of the controllable deposition for microplasma,the properties of hydrogenated amorphous carbon (a-C:H) films are demonstrated in reference [5].It was shown that a-C:H film was deposited at the rate of approximately 7 nm s-1on the area of 1.7 × 10⁻³mm2.In addition,research has shown that compared with large-volume and low-pressure plasmas,microplasmas offer unique capabilities for the synthesis of nanomaterials,which includes nanostructured thin films,aerosol nanoparticles,and nanocomposites [1].Thus,a careful study of microplasma for thin film deposition is necessary.
In this article,we mainly focus on hydrogenated amorphous carbon film deposition from acetylene (C2H2) at atmospheric pressure microplasma.The hydrogenated amorphous carbon films have a low abrasive coefficient,infrared transparency,and high hardness properties,which can be widely used for passivation layers [6],field emission cold cathodes for future flat-screen displays [7],and tribological materials [8].Among these industrial applications,dust particle formation has especially been an important issue [9].Therefore,several attempts have been made to control dust particle formation and physical properties by using numerical simulations and experimental measurements.De Bleecker et al [10,11] provided a one-dimensional fluid model to describe the chemical kinetic scheme and revealed the important dust particle formation mechanisms and dust precursors.However,compared with the negative ion results with the experimental measurements [12,13],the agreement is unsatisfactory.On this basis,Mao et al[14]presented new negative ions that involve the vinylidene anion (H2CC-) and C2nH-2,which are important for dust particle formation.Their calculated results agree well with the experimental measurements by Benedikt et al[12]and Deschenaux et al[13].Thus,the initial dust particle formation mechanisms in low-pressure C2H2discharges are relatively well understood.However,so far few research studies have been devoted to dust particle behavior in acetylene microdischarge,in which some unique properties like non-equilibrium,discharge mode transition,and high energetic electron characteristics will seriously affect dust particle behavior.Hence,a deep and detailed investigation of dust particle formation and growth mechanisms in C2H2microplasma is expected.
In this work,dust particle formation and physical properties in capacitive radio-frequency C2H2microdischarge is carefully investigated by using a two-dimensional (2D)aerosol dynamics model and fluid model,which is described in detail in section 2.The aerosol dynamics model is used to study the particle generation while the fluid model is used to investigate the dusty plasma characteristics,in which the particles’ continuity equation,momentum balance equation,and electron energy balance equation are introduced.Section 3 presents the simulation results for acetylene microdischarge and discusses the effect of the process parameters on the dust particle and plasma characteristics.A conclusion is made in section 4.
2.Theoretical model
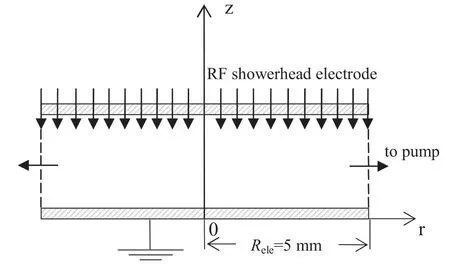
Figure 1.Schematic of cylindrically symmetric geometry in microdischarges for acetylene.
The 2D fluid model based on reference [9] is extended to investigate the acetylene microdischarge characteristics in a cylindrical discharge chamber.The reactor geometry is shown in figure 1,in which the radio-frequency (13.56 MHz)source is applied to the showerhead electrode with the voltageV=V0sinωt,while the bottom electrode is set to be grounded.The gas pumps across two opposing sidewalls and the pumping grid is assumed to be effectively transparent.In this study,the effect of the gas flow on dust particle behavior is negligible for the following two cases: first,in this study we put our focus on the process parameters effect on the dust particle property,especially for the 1 nm diameter particles.Under this condition,the electrostatic force and the ion drag force remain the most dominant forces.Second,based on the experimental studies by Deschenaux et al [13],the gas flow rate of 8 sccm is fed into the showerhead electrode,which is very small in the plasma region.Thus,a uniform gas temperature of 400 K is assumed.
Based on the experimental observations,a total of 50 different species are calculated in this plasma module,containing C2H2,C4H2,C6H2,C8H2,C10H2,C12H2,H2,CH,CH2,H,C2H,C4H,C6H,C8H,C10H,C12H,C8H6,C10H6,C12H6,H2CC-,C2H-,C4H-2,C4H-,C6H-2,C6H-,C8H-2,C8H-,C8H-4,C10H-,C12H-,C10H-4,e,C2H+2,H+2,H+,C2H+,CH+,C+2,C+,C4H+2,C6H+2,C8H+2,C4H+,C6H+,C8H+,C6H+4,C8H+4,C8H+6,C10H+6,and C12H+6. For each species j (electrons,ions,molecules,and dust particles),the continuity equation is taken into account to study the particle density nj,
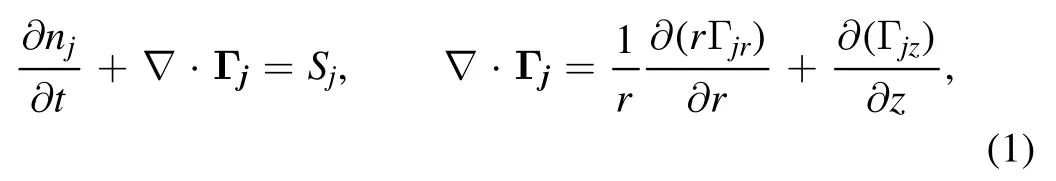
where Γjis the particle flux and Sjrepresent the sink and source terms of particle j.The momentum balance equation is estimated by a drift-diffusion approximation,which suggests that the small species (electrons,ions,and molecules) flux terms consist of a drift and a diffusion term [15,16],
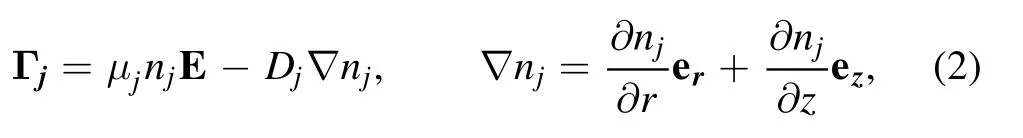
where Djand μjare the diffusion coefficient and mobility of particle j,respectively.Due to the lower momentum transfer frequency,ions cannot follow the actual electric field E,and thus an effective electric field Eeffinstead of an electric field is adopted in the momentum balance equation to compensate for the effects of inertia.The momentum balance equation for nanoparticles is quite complicated and calculated by assuming that the damping neutral drag balances the sum of electrostatic force,ion drag force,and thermophoretic force,
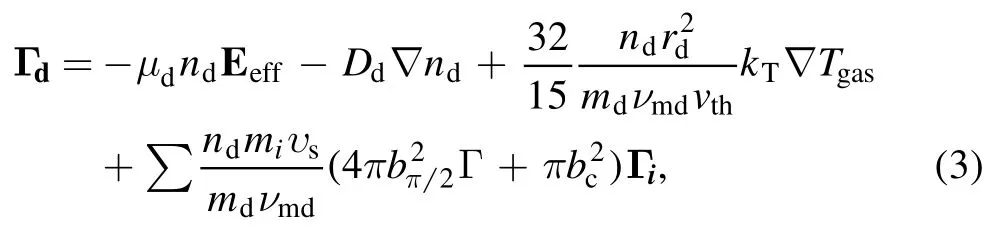
wherend,Γd,rd,mdare the nanoparticle’s density,flux,radius,and mass,νmdrepresents the momentum loss frequency,vththe gas average thermal velocity,and vsthe ions’mean speed.Tgasand kTare the neutral gas temperature and thermal conductivity.Γ is the Coulomb logarithm,bcthe collection impact parameter,and bπ/2the impact parameter corresponding to a deflection angle π/2.miand Γiare the ion’s mass and flux.To make the model fully self-consistent,the Poisson’s equation is coupled to the balance equations to calculate the electric field E and the potential φ,

where e is the elementary charge and ε0the permittivity of vacuum space.ni,ne,and ndare the ion,electron,and nanoparticle densities,respectively.The nanoparticle charge Qdcan be obtained from the charge build-up equation.Finally,the electron energy balance equation is introduced to obtain electron temperature Te,which is calculated from the second moment of the Boltzmann equation:

Here,Γwis the electron energy density flux and Swthe electron energy loss due to electron impact collisions.No energy balance for neutrals and ions due to the local gas temperature is assumed.
Equations (1) and (2) for the ions are solved explicitly with the FCT scheme[17],and equations(1),(2),(4),and(5)for the electrons and nanoparticles are solved by an implicit iterative solution with the Scharfetter–Gummel scheme [18].With the help of C programming language,the behavior of each species(electrons,ions,molecules,and dust particles)is carefully investigated.Since the mass of nanoparticles is much bigger than that of electrons and ions,a longer time step is adopted for the nanoparticle module.
It is well known that the nanometer-size particle is primarily formed through successive reactions between acetylene molecules and anions[10].The small anions C2H-and H2CC-are generated by the electron induced dissociative attachment of the C2H2feed gas,
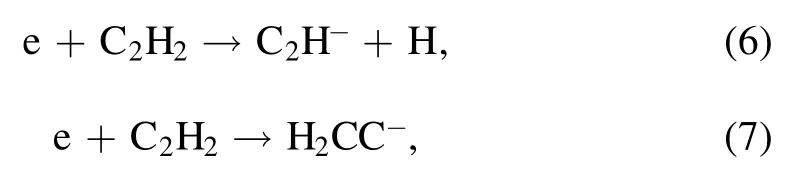
with 95% leading to the formation of H2CC-and 5% to the formation of C2H-.The larger anionsCn2H-andCn2H-2(n >1) are generated by two parts: (1) the electron induced dissociative attachment ofCn2H2(similar to the equations(6)and (7)),and (2) a consecutive chain of polymerization reactions,
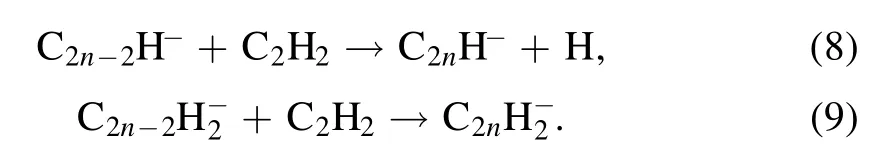
Similar to reference[10],C12H-is used for the starting point of the fast coagulation phase.During coagulation,the particle size quickly grows from a few nanometers to 50–60 nm,whereas the density of the particle number sharply decreases[19].Thus,aerosol dynamics model is introduced and described by
where n(v)is the particle density in the volume range(v,v +dv),β(u,v) represents the coagulation frequency between the particles with volumes u and v.The first term on the righthand side of equation (10) represents the smaller particle formation,where the factor of 1/2 is introduced in the integral since collisions are counted twice.The second term describes the particle loss because of coagulation with any volume particles.δ(v-v0)equals zero whenv≠v0and is unity when v = v0,and thus Jo(v) in the third term represents the rate of new particle formation with volume v0by nucleation.
3.Results and discussion
Here we present selected calculation results for the acetylene microdischarge,with a radio frequency of 13.56 MHz,an ion temperature of 400 K,and an initial voltage of 80 V.We have studied the effects of different secondary electron emission coefficients on the plasma density,and found that the difference is rather small,thus the secondary electron emission(SEE) coefficients are set at 0.1,which is consistent with the simulation of Zhang et al [20].To evaluate the effect of discharge parameters on the electron heating mode and nanoparticle behavior,the gas pressure is varied from 100–500 Torr,the voltage is varied from 80–150 V,and the gap between the powered electrode and grounded electrode is varied from 400–1000 μm.
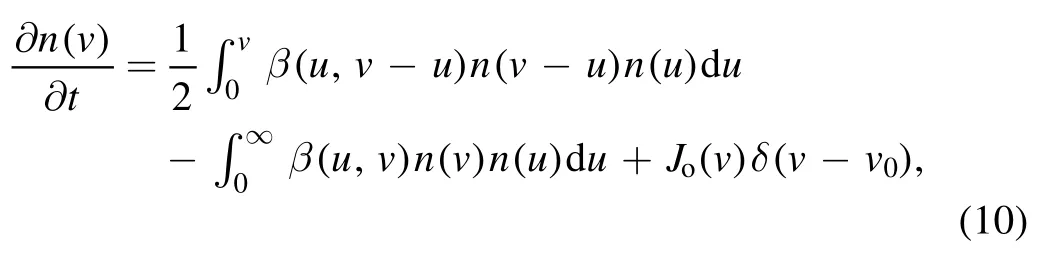
Figure 2 presents an axial profile of the electron density at different electrode gaps of 400,500,800,and 1000 μm,corresponding to the variation in pressure from 100–500 Torr.As is well known,the electric field is weak in the bulk of the discharge,but much stronger in the sheaths.Therefore,the electron density exhibits two prominent peaks at the bulksheath boundaries and gets lower in the center of the discharge.We can observe from figure 2(a) that the electron density is proportional to the electrode gap at the gas pressure of 100 Torr for the power effect,showing properties of the α mode.As the gas pressure increases,the electron density shows a complicated transformation,which is mainly reflected in those two aspects:
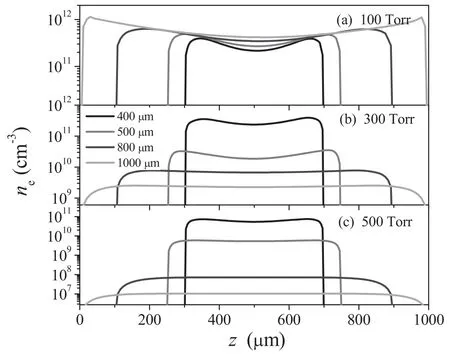
Figure 2.Calculated electron density profiles for different electrode gaps,with the gas pressures (a) 100 Torr,(b) 300 Torr,and (c)500 Torr.

Figure 3.An axial profile of electron temperature versus electrode gap at the pressures of (a) 100 Torr,(b) 300 Torr,and (c) 500 Torr,and the mean power density at (d).
(1) As is clear from figures 2(b)and(c)(300 and 500 Torr),the electron density shows a abrupt decrease with the increase of electrode gap,by 4 orders of magnitude,which is quite different from that in figure 2(a).
(2) When the gas pressure increases,the electron densities in the whole electrode gap range decrease instead of increase,which is not an α discharge characteristic.
These variations suggest that the plasmas may exist in two different discharge modes.As is well known [21,22],a radio-frequency discharge can burn in the α mode and γ mode.In the α mode,plasma is sustained by bulk ionization,while in the γ mode it is sustained by secondary electron emission.Based on the medium pressure glow discharges[23],the mode transition from α to γ is accompanied by abrupt decreases in the plasma density and the electron temperature.Considering that the electron density in figure 2 and the electron temperature in figure 3 decrease with the pressure,we can conclude that the mode transition from α to γ occurs.
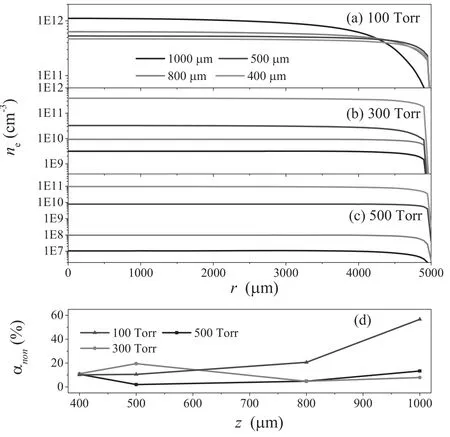
Figure 4.A radial profile of the electron density versus electrode gap at the pressures of (a) 100 Torr,(b) 300 Torr,and (c) 500 Torr,and the degree of the nonuniform variation at (d).
For a better understanding of the mode transition,the axial profile of electron temperature versus electrode gap at different pressures is shown in figures 3(a)-(c),while the mean power density p is shown in figure 3(d).We can clearly see that the electron temperature is mainly distributed in the bulk of the discharge at the pressure of 100 Torr(figure 3(a)),showing properties of an α mode.When going to larger pressure (figures 3(b) and (c)),two peaks of equal magnitude on both sides of the electrodes are formed,showing properties of the γ mode.Thus,we can believe that the mode transition from α to γ occurs when the pressure increases.Furthermore,as we can see in figure 3(d)the mean power density at the pressure of 100 Torr remains nearly constant,suggesting that the power is proportional to the electrode gap.This results in a linear increase of the electron density with the electrode gap,as shown in figure 2(a).As the pressure increases,the mode transition from α to γ occurs [21,22],in which the plasma is sustained by the secondary electron emission.In the γ mode(>100 Torr),the sheath thickness decreases with the increase of the electrode gaps,and thus the mean power density decreases sharply,as shown in figure 3(d).This results in a exponential decrease of the electron density with the increase of the electrode gap,as shown in figures 2(b) and (c).
The radial profiles of the electron density are plotted in figure 4 as a function of the electrode gap at different pressures.As shown in figures 4(b) and (c),the electron density has changed by 4 orders of magnitude,and then the variation in its radial profile shape is not significant.Therefore,the degree of nonuniformity αnonis introduced and defined as follows:
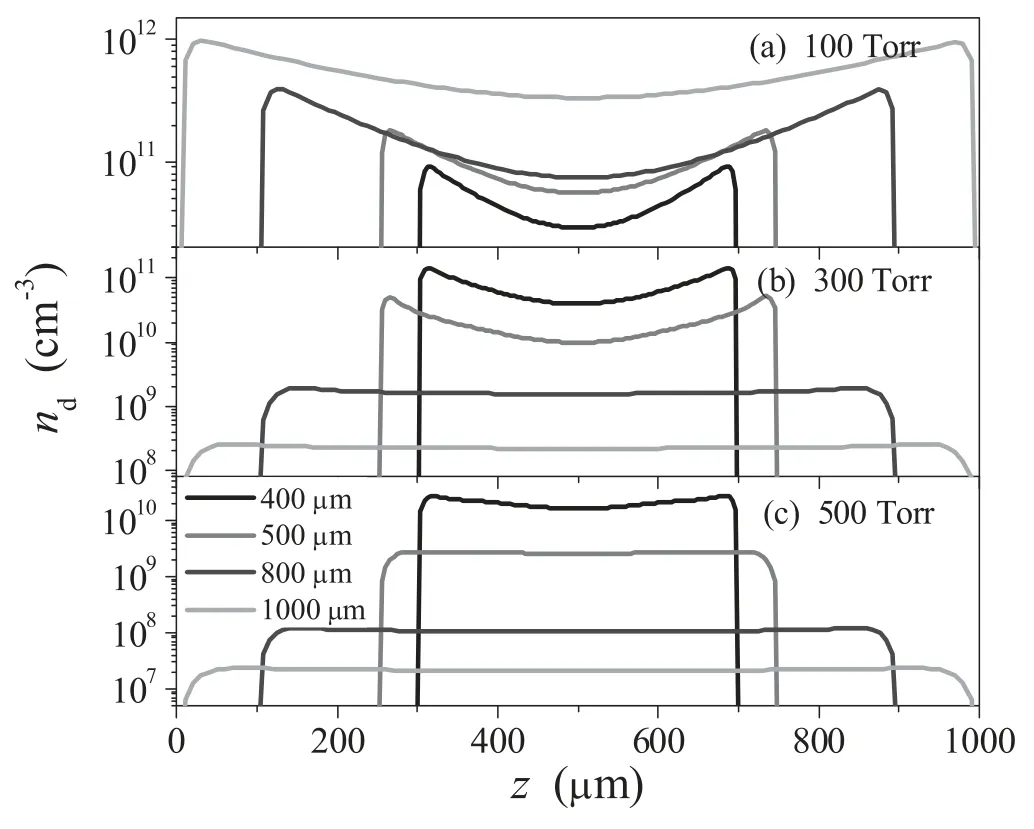
Figure 5.Calculated nanoparticle density profiles for different electrode gaps,with the gas pressures: (a) 100 Torr,(b) 300 Torr,and (c) 500 Torr.

where nav,nmax,and nminrepresent the average,maximum,and minimum values,respectively,of electron density neat the center of the discharge above the bottom electrode [24](r ≤ 4 mm).Note that according to the definition,the minimum value of αnoncorresponds to the most uniform plasma.Figure 4(d) shows the degree of nonuniform αnonvariation with the electrode gap.It can be seen from figure 4(d) that αnonincreases sharply with the increase of the electrode gap at the gas pressure of 100 Torr,and a minimum of 10 is achieved at the electrode gap of 400 μm.As the pressure increases,a higher degree of nonuniformity is observed at the value of 1000 μm,and a minimum at some intermediate value of electrode gap,which depends on the gas pressure.Therefore,the control of the electrode gap can be considered as an effective tool for improving the plasma uniformity.Furthermore,the plasma uniformity for higher pressure is considerably better than that in the 100 Torr case in most of the electrode gap range,since the degree of nonuniformity decreases generally with the increase of gas pressure.Therefore,it is believed that by properly increasing the gas pressure,the plasma uniformity can be greatly improved,while the plasma density has no significant change.This is important for the deposition of hydrogenated amorphous carbon films.
The axial density profiles of the most important nanoparticles for different electrode gaps are shown in figure 5,with the pressure of 100–500 Torr.A diameter of 1 nm for the nanoparticles is chosen to obtain the details of the axial variation,since these particles have a higher number density in the coagulation phase.Similar to the variation in electron density,the nanoparticle density increases gently with the electrode gap at the pressure of 100 Torr,but decreases significantly in the range of 300-500 Torr.These results show once more that two different electron heating modes,α mode and γ mode,appear in acetylene microdischarge.Furthermore,as shown in figure 5(a) the nanoparticle exhibits two prominent peaks on the sheath boundaries,and becomes much lower within the bulk plasma.As is we known,the location of the nanoparticle in the discharge reactor mainly depends on the competition between the ion drag force arising from the positive ion acceleration to the top and bottom electrodes and the electric field force arising from the sheath regions [9].When the gas pressure is 100 Torr,the ion drag force seems to take a leading position,which pushes the particles to the wall surfaces at both sides of the reactor vessel and decreases the particle density at the bulk plasma.As the gas pressure increases,it seems that the peak values of nanoparticle density decrease significantly,and then the profiles vary continuously from an edge high to a center high.This can be explained by the fact that the increase of gas pressure makes the competitiveness of the ion drag force weak,and then the electric field force plays a leading role,which forces the nanoparticle to the bulk plasma regions.Hence our model predicts that a nanoparticle can be suspended in some well-defined regions of the plasma by varying the gas pressure.
Since two different electron heating modes may appear in this study,a comparison between the results obtained at 100 and 500 Torr seems to be possible.Figure 6 shows the variation in electron density with the electrode gap at different voltages,with the pressures of 100 and 500 Torr.It can be observed from figure 6 that at the gas pressure of 100 Torr,the electron density increases linearly with the increase of applied voltage,in agreement with the Townsend discharge property.However,at a pressure of 500 Torr,the electron density shows a sharp increase with the increase of applied voltage (increase by about 20 times),which is also in agreement with the γ mode discharge property.Moreover,when P = 500 Torr the electron density at L = 400,500 μm increases much faster than that at L = 800,1000 μm.This finding suggests the necessity of fine tuning of the electrode gap in order to achieve higher plasma density in the γ mode.
The effect of the voltage on the profile of the axial variation of the nanoparticle density is shown in figure 7,with the gas pressures of 100 and 500 Torr.We can clearly observe that when P = 100 Torr,the nanoparticle increases by about 2 times with the increase of voltage while when P = 500 Torr,the nanoparticle increases by about 2 orders of magnitude with the increase of voltage,especially when L = 400 μm.That means that the voltage effect on the nanoparticle density in the α mode is much less than that in the γ mode.When comparing these results with the electron density in figure 6,we can observe that the nanoparticle density increases much faster,especially at the electrode gaps of 400 and 500 μm.
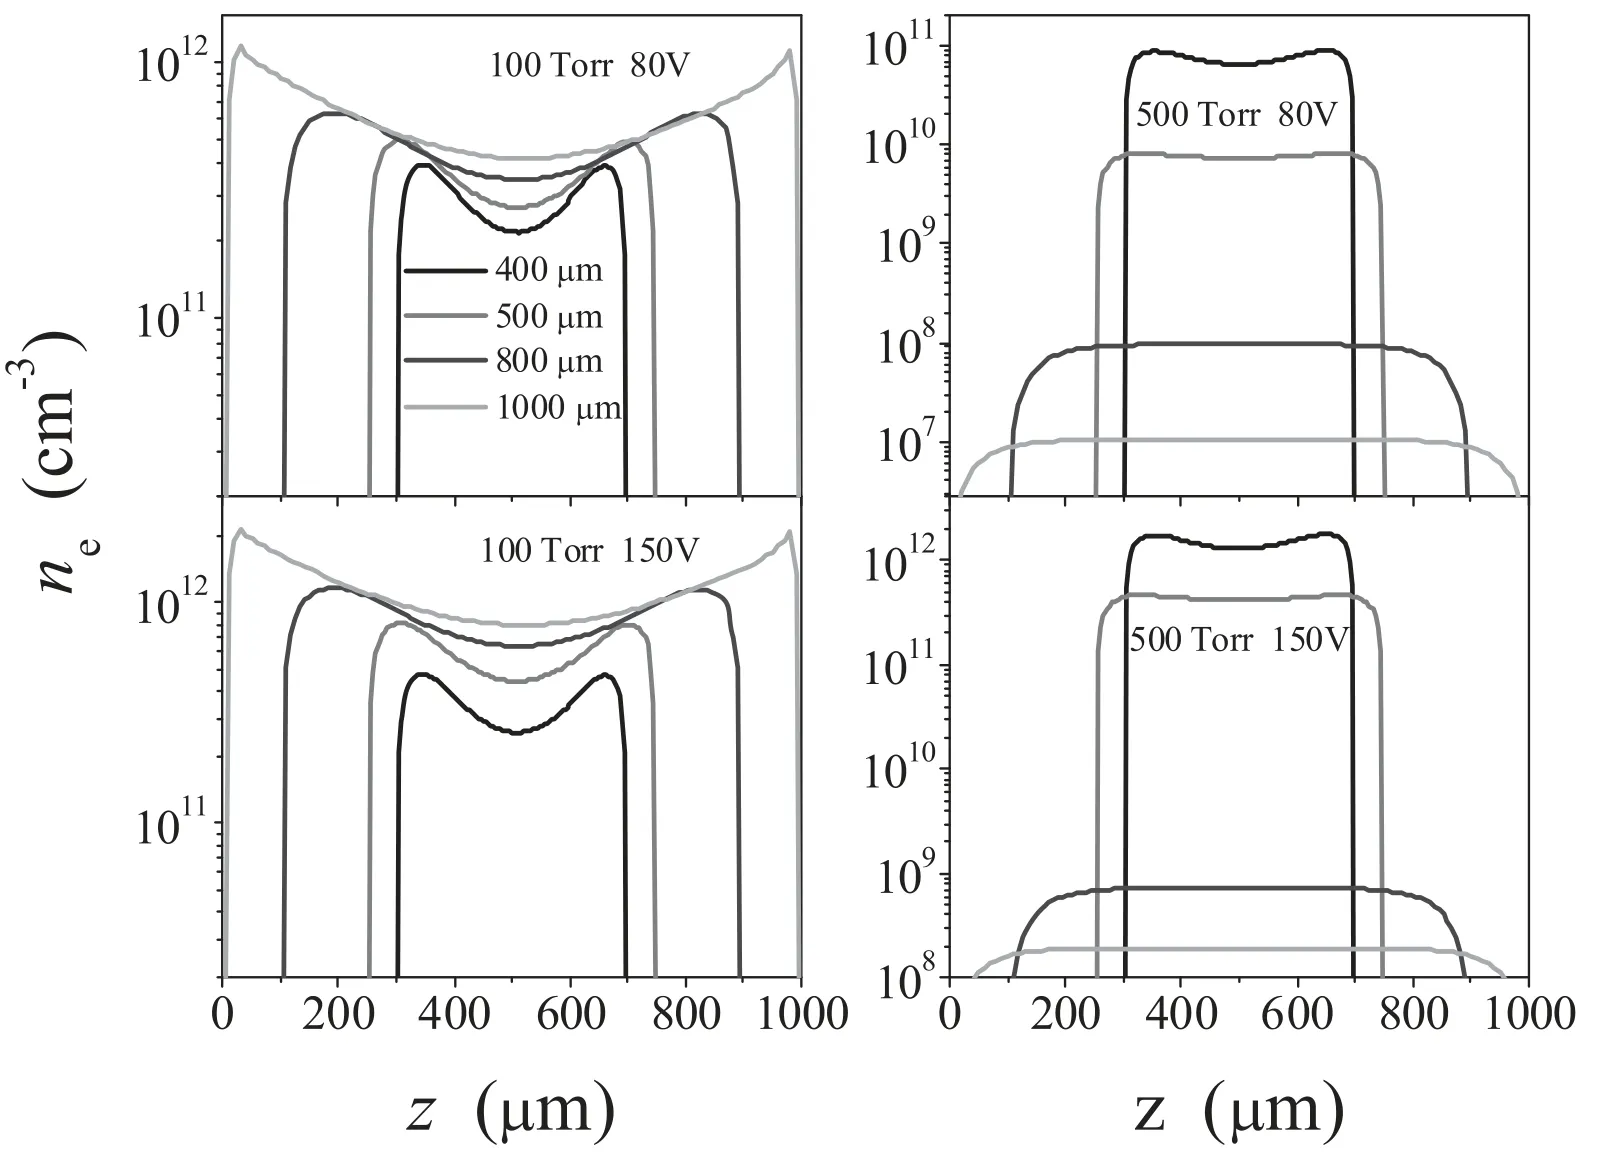
Figure 6.Calculated electron density profiles for different electrode gaps,with the gas pressures of 100 and 500 Torr and applied voltages of 80 and 150 V.

Figure 7.Calculated nanoparticle density profiles for different electrode gaps,with the gas pressures of 100 and 500 Torr,and applied voltages of 80 and 150 V.
Since the variation in the plasma density’s radial profile shape is not obvious,the variation in the degree of nonuniformity αnonwith the electrode gap at different voltages for 100 Torr (α mode) and 500 Torr (γ mode) is shown in figure 8.We can observe from this figure that αnonmonotonically increases with the electrode gap both at the voltages of 80 and 150 V in the α mode,meaning that good plasma uniformity can be achieved at the electrode gap of 400 μm.It is also shown that αnonfor 150 V is larger than that in the 80 V case,implying that the plasma uniformity for 80 V is considerably better than that in the 150 V case in most of the electrode gap range.In the γ mode,the degree of the variation in nonuniformity with the electrode gap at 150 V is similar to that of 80 V,with the minimum at the value of 500 μm and the maximum at the value of 1000 μm.Therefore,the plasma uniformity is poor at the electrode gap of 1000 μm both in the α mode and γ mode.
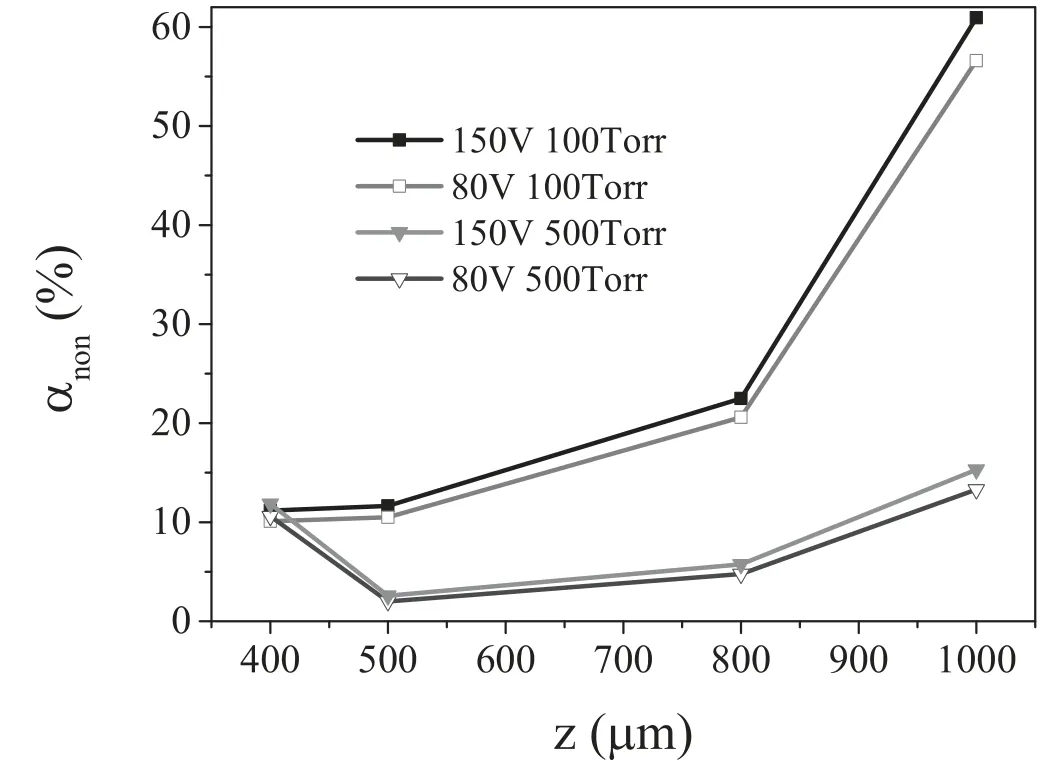
Figure 8.The degree of the variation of nonuniformity with the electrode gap,with the gas pressures of 100 and 500 Torr,and applied voltages of 80 and 150 V.
4.Conclusion
The property of the dust plasmas in microdischarges for acetylene has been investigated in detail by use of a 2D fluid model and an aerosol dynamics model.The model is used to predict the electrode gap,gas pressure,and radio-frequency source voltage effects on the axial distributions of electron density and nanoparticle density,and it is more important that these effects on the plasma uniformity are also studied,which is closely related to the performance of hydrogenated amorphous carbon films.
It has been shown that gas pressure can strongly influence the axial profiles of electron temperature,as well as the electron density values.The abrupt decreases of electron density and electron temperature imply that two different electron heating modes(α mode and γ mode)appear in C2H2microplasma.To confirm the existence of these two modes,the applied voltage effect on the plasma density is taken into account,and it has been shown that the effect of voltage on the plasma density in the α mode is much less than that in the γ mode.
Furthermore,it has also been shown that controlling the gas pressure can greatly influence the axial profiles of nanoparticle density.The profiles vary continuously from an edge high to a center high with the increase of gas pressure.
It has been shown that plasma uniformity could be considerably improved by optimizing the electrode gap and gas pressure.The necessity of fine tuning of the electrode gap in order to obtain better plasma uniformity has also been demonstrated.
In summary,gas pressure control can considerably improve the electron density and plasma uniformity,as well as the nanoparticle density axial profiles in capacitive radiofrequency C2H2microdischarge and thus it will be extremely useful in industrial applications.
Acknowledgments
This work was supported by National Natural Science Foundation of China(Nos.11805107 and 21703112)and the Fundamental Research Funds in Heilongjiang Provincial Universities of China (No.135209312).
猜你喜欢
延河·绿色文学(2022年4期)2022-05-10
延河(下半月)(2022年4期)2022-05-07
故事会(2022年7期)2022-04-03
作文中学版(2020年1期)2020-11-25
摄影与摄像(2020年10期)2020-09-10
课堂内外(小学版)(2019年10期)2019-12-30
课堂内外(小学版)(2019年9期)2019-12-30
作文评点报·低幼版(2018年25期)2018-09-27
新少年(2015年12期)2015-12-15
中学生数理化·七年级数学北师大版(2008年2期)2008-07-23
 Plasma Science and Technology2020年4期
- Plasma Science and Technology的其它文章
- Study on influencing factors of ion current density measurement in corona discharge of HVDC transmission lines
- Trap distribution of polymeric materials and its effect on surface flashover in vacuum
- Improvement of the electrical resistivity of epoxy resin at elevated temperature by adding a positive temperature coefficient BaTiO3-based compound
- Controlling fine particles in flue gas from lead-zinc smelting by plasma technology
- Kinetic simulation of an electronegative plasma with a cut-off distribution and modified Bohm criterion
- Suppression of a spontaneous dust density wave by modulation of ion streaming