Image-based assessment of growth vigor for Phalaenopsis aphrodite seedlings using convolutional neural network
2020-06-20 03:00ZhuFengleZhengZengwei
农业工程学报 2020年9期
Zhu Fengle, Zheng Zengwei,2※
Image-based assessment of growth vigor forseedlings using convolutional neural network
Zhu Fengle1, Zheng Zengwei1,2※
(1.,,310015,;2.,,310015,)
In theindustry, the growth vigor of seedlings when reaching their minimum growth time of vegetative cultivation plays an important role in the subsequent production chain and the final economic profits. The current manual assessment taking place in the commercial large-scale greenhouse is time-consuming and labor-intensive. Related studies based on RGB image for plant growth assessment relied on extracting hand-crafted features from images, affecting the effectiveness and generalization ability of machine learning models. In this study, the Convolutional Neural Network (CNN) was employed to explore its feasibility in assessing the growth vigor ofseedlings grown in the greenhouse in an end-to-end manner. Seedling images were collected in the greenhouse conditions with complex image background. Baseline models on the greenhouse dataset were established using different CNN architectures (VGG, ResNet, Inception-v3) coupled with various training mechanisms (training from scratch, fine-tuning, feature extraction), in which fine-tuning achieved the best classification results. Considering the target task of morphological classification for individual greenhouse seedlings with complex image background, to further boost model performance, additional seedlings images were acquired in controlled laboratory conditions. The segmented laboratory images were used to assist in model learning, namely building the augmented models. Two approaches were adopted, achieving an overall improvement in the testing F1-score of 0.03-0.05 compared with baseline models. The VGG model with augmentation method II achieved the highest performance in this study (F1-score of 0.997 on the test set), its feature maps were also visualized. In higher-level feature maps, regions of the target seedling were activated while filtering out most background including leaves from adjacent seedlings, proving the effective morphology characterizing using CNN for greenhouse seedlings. The overall results demonstrated the potential of deep learning models for image-based assessment of growth vigor forseedlings and maybe other kinds of plants in greenhouse conditions.
growth; image processing; convolutional neural network; seedling; fine-tuning; feature visualization; assessment
0 Introduction
, commonly known as “moth orchid”, are among the most valuable and popular potted flowering plants and cut flowers due to their outstanding floral appearance, longevity, and year-round availability[1]. Nowadays,has been widely cultivated as ornamental flowering plants thanks to recent improvements in the propagation and cultivation techniques as well as in the efficiency of supply chains[2]. Large-scale pottedproduction with considerable commercial returns is now taking place in various regions around the world, such as the Netherlands, United States, Germany, southern China, etc. In the United States, 75% of all orchids purchased are[1].
The modern propagation ofis generally carried out through tissue culture under laboratory conditions. Then the further cultivation process of the tissue culture seedlings in the greenhouse is divided into three stages: vegetative cultivation, spike induction, and flowering[3]. The vegetative growth is the basis of high-quality flower production,seedlings in this stage play an important role in the whole production chain, affecting the final economic benefits of flower growers.seedlings must be healthy or mature enough before they can be moved to a separate greenhouse for the second stage of being induced to spike[4]. Thus, growers are deeply concerned about the growth vigor status (healthy or weak) of seedlings at the end of vegetative cultivation, each seedling must be assessed individually to pick out the healthy ones. The growth vigor ofseedlings is assessed in many aspects primarily considering the plant phenotypic morphology, including the number of leaves, the leaf span, the morphology of leaves (if the new leaf is larger than the previous one)[4], the height of plants, etc. Currently, the assessment of growth vigor mainly relies on manual inspection for eachseedling, which may vary with the inspector’s experience. Measuring the morphological properties of seedlings by instruments is an alternative[5], but this approach is labor-intensive and time-consuming, limiting its feasibility for large-scale greenhouse production. Therefore, research on the application of a fast and non-destructive approach to assessing the growth vigor of seedlings is important for theindustry, to improve productivity while alleviating labor costs.
Visible light images (e.g. Red-Green-Blue, RGB) with commercial digital cameras or cell phones are highly affordable and beneficial in evaluating the phenotypic growth traits of plants in a non-destructive and high-throughput manner. The targeted task in the present study belongs to plant level phenotyping in the controllable environment (e.g. greenhouse) according to the comprehensive review of multi-scale plant phenotyping[6]. Related publications with RGB image on the growth vigor of plants/seedlings focused on extracting the phenotyping features derived from image analysis, such as projected leaf area, convex-hull area, plant height and width, plant aerial density, etc.[2,7-13]. Linear regression analyses were commonly carried out to correlate the image-extracted features and measured morphological and physical traits, including biomass, leaf area, height[7,10-11]. Besides the linear regression, Back Propagation Neural Network (BPNN) was also adopted in the study of flask seedlings ofto calibrate 6 measured physical properties with 16 image features[2]. Statistical analysis was performed to examine the relation between the growth ofleaves (in terms of calculated leaf area) and the greenhouse environmental factors, to identify the optimal cultivation conditions for[8]. A more recent study approached the plant growth problem by classifying the growth stages of bean plants using fuzzy logic based on features extracted from RGB images[13].
The above researches have been conducted to explore the feasibility of assessing the growth vigor of seedlings using conventional image processing techniques based on hand-crafted features (user-defined prior features) extracted from images followed by statistical analysis or machine learning algorithm. The feature extraction procedure in the traditional image analysis involves time-consuming trial-and-error steps and its effectiveness may depend on the experience of the data scientist[14]. Recent advances in deep learning have remarkably impacted the machine learning domain and have been reported to achieve state-of-the-art performance on many computer visions tasks[15-16]. One of the fundamental advantages of deep learning lies in the automatic hierarchical feature extraction process via learning a stack of multiple linear and nonlinear layers before performing decision-making. Thereby deep learning models can leverage raw data, trained in an end-to-end approach without the requirement to manually design a suitable feature extractor[17]. Over the past few years, major research efforts on computer vision focused on convolutional neural networks, commonly referred to CNNs, due to their capability to hierarchically abstract representations with local operations[15].
The objective of the present study was the image-based assessment of growth vigor forseedlings, focusing on their morphological classification using CNN. Through the research, this was the first study using deep learning models to explore its feasibility for the growth assessment of orchid seedlings from a commercial greenhouse in an end-to-end manner. Different CNN architectures (VGG, ResNet, Inception-v3) coupled with various training mechanisms were evaluated. Considering that the target task focused on the morphological classification of individual seedlings in greenhouse conditions with complex image backgrounds, adding images depicting the holistic plant morphology with the segmented background as augmenting samples might boost the learning performance of models. Hence additional seedlings images were acquired in a controlled laboratory environment, which was used to augment the classification models in two approaches. Moreover, feature maps were visualized to reveal the learning process of the CNN model.
1 Material and methods
A general overview process for seedlings growth assessment was illustrated in Fig.1. The whole procedure mainly included image acquisition, image preprocessing, the establishment of baseline models and augmented models.

Fig.1 A general overview process for seedlings growth assessment
An overview of the greenhouse dataset and laboratory dataset including number, proportion, and purpose was displayed in Table 1. The detailed procedure of dataset acquisition and splitting for the model establishment was provided in the following sections.

Table 1 Overview of the greenhouse dataset and laboratory dataset
Note: Number in the () represents the proportion of the whole image set, %.
1.1 Image acquisition
Seedlings ofsubsp.‘Zi Shan’ were grown in translucent plastic pots in a commercial greenhouse located in Hangzhou, China. In August 2019, seedlings reaching their minimum growth time of vegetative cultivation were manually assessed by experienced botanists for their growth status, labeling each one as healthy or weak. The manual labeling was primarily concerned with the plant phenotypic morphology, healthy seedlings were characterized with larger total leaf area, larger averaged leaf area and larger leaf area for newer leaves than older ones.
RGB images were acquired using the camera of iPhone XS with a spatial resolution of 3 024 × 4 032 pixels.seedling was asymmetric in shape, its leaves were grown mainly along the long axial direction with overlapping in the short axial direction. Oblique-view from the top facing the long axial direction provided the best site for observing the morphological characteristics of whole seedlings. Thus, each seedling was imaged from the two opposite long axial directions with the diagonal field of view of approximate 45°, yielding two oblique-view images.
Image collection was first conducted for 450 healthy seedlings and 470 weak seedlings in greenhouse conditions (captured with seedlings on the cultivation bed), producing 1 840 images (900 for healthy seedlings, 940 for weak seedlings). The camera was mounted on a movable tripod, situated plumb 0.6 m over the cultivation bed. The temperature and relative humidity of the greenhouse was maintained at 28.5 ℃-33.4 ℃ and 69.3%-86.7%, respectively, suitable for the vegetative growth of. The collection of greenhouse dataset was taken across four different days (9:00-12:00 and 14:00-17:00 per day), with varying circumstances and weather conditions. Hence, image background was complex due to the presence of some leaves from surrounding seedlings, different illumination conditions, various greenhouse settings (e.g. cultivation bed, water pipeline), and irrelevant objects (e.g. gloves, shoes).
Since the task under consideration was a morphological classification problem for individual plants, images of holistic seedlings without complex background might help the learning process of deep learning models. Besides the greenhouse dataset, a portion of the labeled seedlings was randomly selected for image acquisition under a controlled environment, using similar imaging angle and distance as above, regarding the laboratory dataset (480 images for healthy seedlings, 480 images for weak seedlings) in this study. The controlled environment mainly referred to a uniform background and consistent lighting intensity without obvious shadows, to facilitate background segmentation in the processing of laboratory dataset. Fig.2 showed representative images in the greenhouse dataset and laboratory dataset, with obviously increased complexity in the image background in the former dataset.
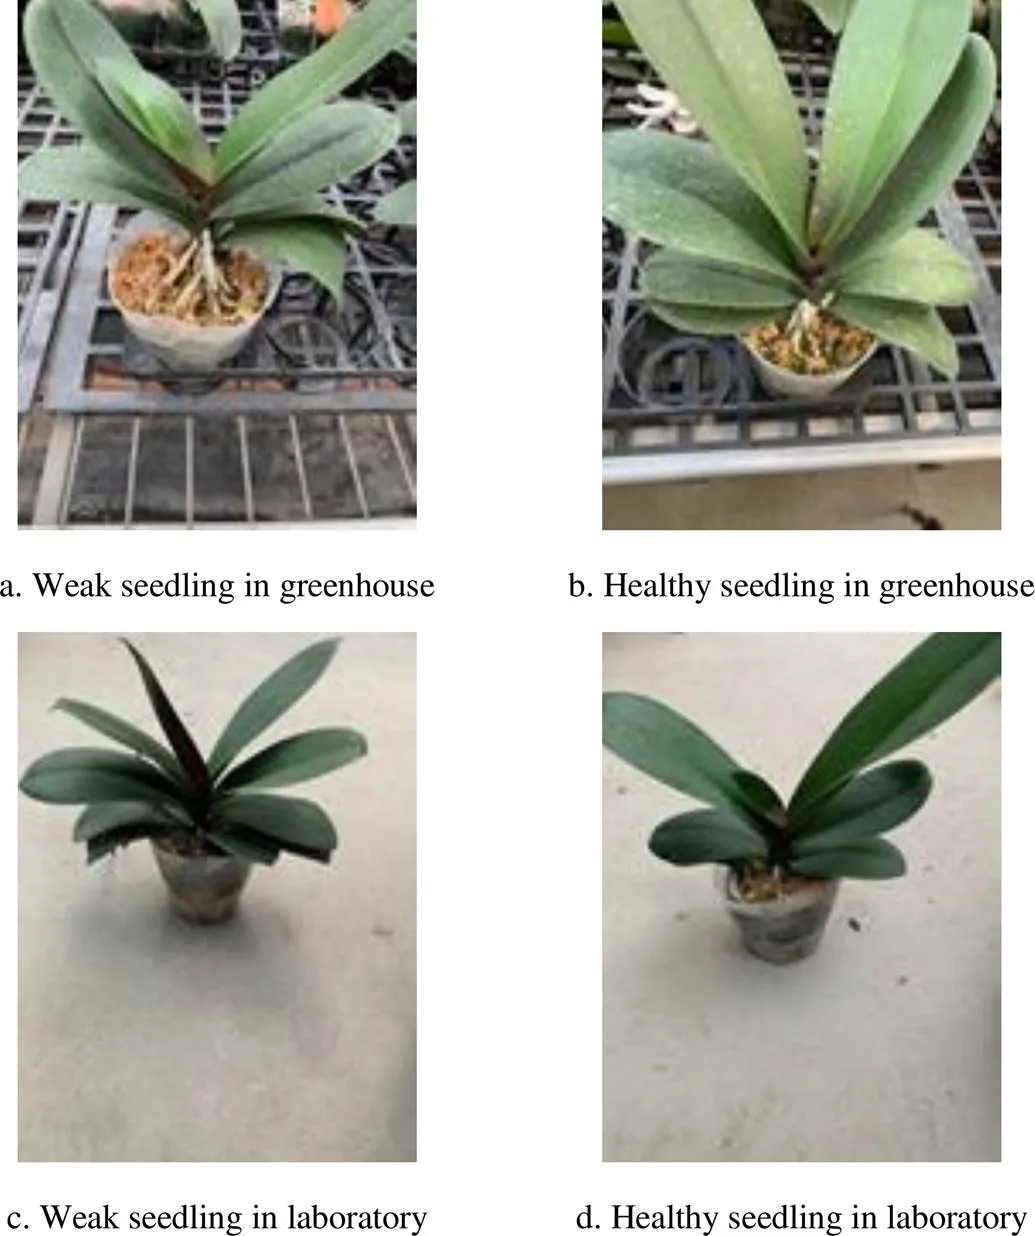
Fig.2 Representative images of weak and healthy seedlings in greenhouse dataset and laboratory dataset
1.2 Image preprocessing and basic data augmentation
For all models in this study, the following image preprocessing and basic data augmentation were implemented.
All captured images were first resized to 604 × 806 pixels and cropped to 604 × 604 pixels by removing the bottom part of the image, to improve the efficiency of image processing while eliminating unnecessary background information. To conform to the input requirement of CNNs, three basic image preprocessing steps were then carried out for all images. Firstly, images were resized to 224 × 224 pixels size for ResNet and VGG, 299 × 299 for Inception-v3. Secondly, all pixel values were divided by 255 to be compatible with the network’s initial values. Finally, normalization was performed for each channel to improve training efficiency[18].
Current CNNs heavily rely on learning and very large labeled datasets, to achieve high performance[15]. In the case of an insufficient dataset, which often happens in plant science, a very useful and practical approach is to augment the dataset. The basic and most widely employed data augmentation technique is geometric transformations in studies regarding plants/seedlings[18-21]. The following geometric transformations were adopted as basic data augmentation techniques in this study: horizontal axis flipping, slight rotations (between -15°-15°), and Gaussian noise injection. These applied transformations could occur in images captured under practical greenhouse conditions while not much altering the holistic morphology of seedlings in images. Only training images were subjected to the basic data augmentation in an online manner. Specifically, the train set was not augmented before training, and during training, transformations were applied to each training image at each epoch[22]. The online augmentation advantaged over offline augmentation in terms of saving storage space.
1.3 Model architectures
The three basic CNN architectures being investigated in this work concerning the growth assessment of seedlings from their images were the following: (i) VGG[23], (ii) ResNet[24], (iii) Inception-v3[25]. The basic building blocks of a classical CNN included a convolution layer, a nonlinearity or rectification layer, a normalization layer and a pooling layer[26]. VGG was the first deep CNN architecture focusing on the investigation of increasing network depth using very small convolution filters[23]. VGG16, the 16 weight layers version of the network, was applied in this study. ResNet stood for the residual network, highlighted in its residual learning via the use of skip connections[24]. The 34-layer ResNet was employed. The Inception-v3 was an improved inception architecture, consisting of stacked inception modules, in which convolution operations at various scales and spatial pooling happen in parallel[25].
For all these three CNN architectures, the final layer was a fully connected layer with Softmax output. To adapt to the present classification task, the final layer of each network architecture was reshaped to maintain the same number of inputs as before and to have the same number of outputs as the number of classes in the present study (2 classes). Then the weights of the final layer were randomly initialized to be trained toward the present task.
Training of each model was carried out by optimizing the cross-entropy loss using mini-batch gradient descent with 0.9 momenta[27], experimented with empirically best learning rates chosen from {10−2, 10−3, 10−4, 10−5}. The batch size was set to 16. The maximum number of epochs used for training was set to 100. The training, validation, and testing of these models were implemented using Pytorch V1.0.0, programmed in Python 3.7. The GPU of an NVIDIA® GTX1080 card, with the CUDA® parallel programming platform, was employed in a Linux environment (Ubuntu 16.04.6 LTS operating system).
For the present binary classification (weak samples as positive, healthy samples as negative), the following metrics were used to measure the performances of classifier: Accuracy, Recall, Precision, and F1-score[28]as the following expression (1), (2), (3) and (4) respectively.


where merely emphasizing recall value would tend to predict all samples as weak, increasing unnecessary cultivation costs; while merely emphasizing precision value would tend to predict all samples as healthy, inducing additionally lost due to inferior blooming quality of the misclassified seedlings. Thus, the F1-score was also used, which was the harmonic mean of recall and precision.
1.4 Baseline models on greenhouse dataset
Models built merely on the greenhouse dataset, without the help of laboratory dataset, were regarded as baseline models.
The entire greenhouse dataset was divided into three sets of training, validation, and test by randomly splitting the 1 840 images in the ratio of 5:3:2. The training and validation sets were used to perform the training process and parameter selection, respectively, and the test set was used to evaluate the model on unknown data. In specific, the model training proceeded on the training set for multiple epochs and after each epoch, a full validation was performed. When expected results were achieved on the validation set, the model weights were kept, which were evaluated finally on the new, previously “unseen” images in the test set. For the sake of clarity, the training and validation sets of the greenhouse dataset were named as training I and validation I, respectively.
In building the baseline models based on the greenhouse datasets, the performances of the above three model architectures were evaluated with different training mechanisms. One case was training from scratch, in which the network weights were randomly initialized, followed by updating throughout all layers in each iteration. Since the size of the dataset in this study was not very large, transfer learning, a machine learning technique where a learned model from one problem was transferred to a dissimilar but allied problem[14], was also adopted. The key difference between these two learning approaches (training from scratch vs. transfer learning) lied in the initial state of network weights, where transfer learning approach started with weights initialized from a pretrained model (trained on the 1 000-class large ImageNet dataset) and could exploit the large amount of visual knowledge already learned by the pretrained models from ImageNet dataset[29]. Also, two types of transfer learning techniques were adopted for comparison: fine-tuning and feature extraction[29]. In the case of fine-tuning, the weights of the pretrained model were updated throughout the entire network based on the present data, in essence, retraining the whole model. While in feature extraction, all the transferred layers were left frozen during training, and weights of only the final layer which was reshaped to derive predictions were updated. Thus, for baseline models, three CNN architectures coupled with three training mechanisms (training from scratch, fine-tuning, feature extraction) were evaluated.
1.5 Augmented models using laboratory dataset
To further boost the model performance in recognizing plant morphology, the laboratory dataset was utilized for augmenting the greenhouse dataset, in essence establishing the augmented models.
The laboratory dataset was first subjected to image background segmentation, to obtain purer plant morphology without any interference from the background. The HSV (Hue, Saturation, Value) color space was used for background segmentation after many trials. The image hue values ranged from green to dark brown due to the diverse leaf color ofseedlings. Saturation values of the brown leaf and the stem area were higher whereas that of the peripheral green leaf was much lower. Thus, the whole plant could not be segmented within one operation. Targeted at the particular dataset of this study, preprocessed RGB images were partitioned into the central region and peripheral region. For the central region, which contained the seedling stem and brown leaves, the background could be removed by excluding pixels that had a saturation value below a carefully selected threshold (35 in this case). For the peripheral region, a minimum requirement of saturation value (25) coupled with a predefined hue range for green (30-90), could segment the green leaves effectively. Then these two masks were assembled to be applied to the preprocessed RGB images. This combined thresholding adapted for different regions of the image ensured a robust segmentation process. Recent works on plant science using deep learning tended to avoid the step of background segmentation due to the decreased automation and unexpected complex background conditions in practical application[18,30-31]. To approximate to the practical situation as much as possible, throughout this study, the test images from the greenhouse dataset remained the same, without performing background segmentation. Only the laboratory dataset which was used for data augmentation in model training was subjected to background segmentation, automated by the means of a Python script.
The segmented laboratory dataset (480 for healthy seedlings, 480 for weak seedlings) was randomly split into two sets in the ratio of 7:3, named as training II and validation II. For training the augmented models, only fine-tuning was used since it was the best training mechanism in the above baseline models. Two approaches to using the laboratory dataset to help with the training process were compared. Adding them straightforwardly to the greenhouse dataset was the most natural way of augmenting (augmentation method I), specifically, models were built with training I set + training II set, as well as validation I set + validation II set, then evaluated with the test set. For augmentation method II, models were first trained on the segmented laboratory dataset (with sets of training II and validation II), then transferred to remodel the greenhouse dataset using fine-tuning (with sets of training I and validation I). This derived from the hypothesis that the segmented laboratory dataset might perform well on morphological classification, providing better initial network weights for fine-tuning, considering its closeness to the target task compared with the more generic task on ImageNet.
2 Results and discussion
For each model in this study, different learning rates had experimented, only the one that achieved the best F1-score on the test set was kept, which usually derived from either 10−3or 10−4. During training for multiple epochs, model achieving the best validation performances was retained, with training epoch usually fluctuated around 80-90, taking approximately 20 mins and 30 mins for the training baseline model and augmented model respectively.
2.1 Baseline models on greenhouse dataset
The validation and testing results of baseline models on the greenhouse dataset, including models trained from scratch and models performing transfer learning (fine-tuning and feature extraction), were presented in Table 2. It could be seen that though Inception-v3 models performed the worst in all three training mechanisms, in general, all models achieved acceptable classification results with the F1-score higher than 0.85. The three CNN architectures of VGG, ResNet and Inception were the most prevalent and widely studied models in computer vision as well as in agriculture application. Their universal good performances proved the feasibility of applying CNN models to the image-based assessment of growth vigor forseedlings in an end-to-end manner. All models should not overfit much since the results in validation and testing were similar. Also, the accuracy and F1-score of each model were close because of the even class distribution in this study as well as the predicted low number of both false negatives and false positives.
About the comparison among training from scratch, fine-tuning, and feature extraction, earlier discussion[29]stated that the choice of different training mechanism depended on the size of the target dataset and the number of weights in the transferred layers. In their generic image classification task on ImageNet dataset, transferring even from a distant task was better than training from scratch, but for feature extraction, the transferability gap was larger for dissimilar tasks than similar tasks when using more frozen transferred layers. This could explain the slightly worse results of models using feature extraction than those trained from scratch in Table 2. Specifically, although models using feature extraction had good starting points of weights for classifying the 1 000-class ImageNet dataset, the particular fine-grained image classification task of this study was very different from the generic image classification task on ImageNet, merely updating the final layer weights was not sufficient for learning the small inter-class variations. While, the models trained from scratch, even with randomly initialized weights, could learn this fine-grained image classification task more sufficiently using an appropriate learning rate with a large number of epochs, leading to slightly better results compared with feature extraction. Moreover, the fine-tuning models possessed the merits of the above two kinds of mechanisms, in specific, they could update weights of all layers for sufficient training based on relatively good initialized weights. Thus, the training mechanism of fine-tuning among the baseline models achieved the best classification results on the greenhouse dataset, with the F1-score on the test set reaching around 0.95 for all three model architectures. Recent works also demonstrated the performance improvement of fine-tuning, especially when the network got deeper[32]or the training data was limited[33]. Moreover, the effectiveness of fine-tuning conformed to the previously demonstrated perspective that the lower-level features of pretrained networks were fairly general and useful even after fine-tuning for a wide variety of applications[22,29], such as the plant growth vigor classification in this study.

Table 2 Classification results on validation and test sets of baseline models
2.2 Augmented models using laboratory dataset
Sine fine-tuning was the best strategy for baseline models, all the following augmented models were trained using fine-tuning. The purpose of augmentation was to investigate the possibility of further boosting model results by using the segmented laboratory dataset. Table 3 and Table 4 showed the classification results of augmented models using augmentation methods I and II, respectively.
It could be seen that both augmentation method I and method II obtained better results than fine-tuning baseline models, with improvement in F1-score on test set being 0.034, 0.030 and 0.037 for VGG, ResNet and Inception-v3 models respectively using augmentation method I, 0.048, 0.033 and 0.045 for VGG, ResNet and Inception-v3 models using augmentation method II. The laboratory dataset assisted in the model learning of plant morphology in different approaches. With augmentation method I, the model simultaneously learned “theoretical” and practical information, the enlarged training and validation datasets indeed resulted in better deep learning models, which was a generally accepted notion[34]. While with augmentation method II, the model first learned “theoretical” information then adapted the learned knowledge to the practical situation. The almost perfect validation results on laboratory dataset (Table 4), as well as the closeness of the target task to the laboratory task (compared with the generic ImageNet task), provided relatively better initializing network weights for retraining on greenhouse dataset, helping in leading training of weights “on the right tracks”. Therefore, boosted performances were achieved due to that good initialization of the network weights played an important role in the effective and stable updating of weights[23]as well as the final generalization ability[33]. This was in line with a recent study by Douarre et al.[22]that better results were achieved on the plant disease segmentation task when pretraining on a task (simulated disease images in their case) closer to the final objective instead of on ImageNet.
For comparison between augmentation method I and method II, overall, models performed slightly better with method II. However, in the abovementioned plant disease study, with simulated images for data augmentation, the pretraining approach was superior to direct data aggregation to a much larger degree, since their simulated images were too different from real images to benefit the latter approach[22]. Results of the three model architectures were similar using augmentation method I or II, and method II just assisted little more in the learning performance of the VGG model, reaching the F1-score of 0.997 on the test set, the highest performance in this study.

Table 3 Classification results of augmented models using augmentation method I

Table 4 Classification results of augmented models using augmentation method II
2.3 Feature visualization
To better understand the internal working mechanism of CNN for morphological classification, feature visualization was implemented to reveal the feature maps of CNN. For two weak (Fig.3a and Fig.3b) and two healthy (Fig.3c and Fig.3d) seedlings with complex image background, their corresponding feature maps of the first convolution layer, the third convolution layer and the last convolution layer of the VGG model trained using augmentation method II were displayed in Fig.4, Fig.5 and Fig.6 respectively. The brighter the pixel in feature maps, the greater activation value it represented.
According to Yosinski et al.[29], features extracted in CNN usually evolved from general and simple in the lower-level layers to specific and complex in the higher-level layers. The feature extraction process in Fig.4-Fig.6 also demonstrated this phenomenon. Features like edges, contours, and colors were primarily extracted from lower-level layers, producing discernable feature maps in Fig.4 and Fig.5. Irrelevant objects in image background could be segmented for samples Fig.3a and Fig.3c, but similar leaves from adjacent seedlings could not be separated for samples Fig.3b and Fig.3d with these lower-level filters. Whereas with higher-level filters (Fig.6), feature maps became abstract and complex, more importantly, specific to the target task. After enlarging and placing them on the preprocessed RGB images (on the right side of the feature maps), the areas of seedlings that were activated by the higher-level filters could be visualized. As can be seen, the higher-level feature extraction focused more on the leaf regions of target seedling while filtering most background regions, even leaves from adjacent seedlings in Fig.6b and Fig.6d for samples in Fig.3b and Fig.3d, respectively. These feature maps further proved the high effectiveness of the augmented model for fine characterizing seedling morphology for their growth assessment.

Fig.3 Preprocessed RGB images (size 604 × 604) for two weak and two healthy seedlings with complex image background

Fig.4 Feature maps (size 224 × 224) outputted by the first convolution layer of VGG model trained using augmentation method II for two weak and two healthy seedlings with complex image background

Fig.5 Feature maps (size 112 × 112) outputted by the third convolution layer of VGG model trained using augmentation method II for two weak and two healthy seedlings with complex image background

Fig.6 Feature maps (size 14 × 14) outputted by the last convolution layer of VGG model trained using augmentation method II for two weak and two healthy seedlings with complex image background
2.4 Further discussion
Despite the significantly high score in assessing the growth vigor ofseedlings using CNN, it was far from being applied in practical growth conditions.
According to Zhao et al.[6], to develop the high-throughput plant phenotyping platforms (HTPPs) in the greenhouse, there were generally two kinds of overall designs. One was the plant-to-sensor manner, in which plants were transported through a conveyor to a stationary imaging station; another was the sensor-to-plant manner, in which a mobile machine vision system moved to each of the fix positioned plants. The present preliminary study should be adequate for the former design, as displayed in previous studies on plant phenotyping[35-36]. But to develop the latter design which might cost lower, more investigations should be carried out to tackle the substantial presence of adjacent seedling individuals in image background caused by the very intensive cultivation of potted seedlings in the commercialgreenhouse. Possible solutions might include fetching out the target single seedling using a mechanical arm, devising more complicated algorithms for segmenting the target forefront seedling in images (instance segmentation from the viewpoint of computer vision) or combining depth sensors[37]to distinguish the target forefront seedling. Adding images depicting holistic plant morphology captured under laboratory conditions should also help, as explored in the present study.
Moreover, for better generalization ability of models, a much wider variety of images should be collected, including variouscultivars under different cultivation conditions and image capturing modes. Besides, the proposed approach might be extended to assess the growth vigor of other kinds of plants with branched structures (e.g. pepper seedlings) at the plant level in greenhouse conditions.
Furthermore, as the present study focused on exploring the feasibility of CNN models for qualitative assessment of seedling growth vigor, quantitative assessment in terms of predicting leaf area and biomass of seedlings should be investigated in future work.
3 Conclusions
This study explored the feasibility of applying CNN for image-based assessment of growth vigor forseedlings. For the baseline models established on the greenhouse dataset, fine-tuning achieved the best classification results among the three training mechanisms (training from scratch, fine-tuning, feature extraction), with the F1-score on the test set reaching around 0.95 for all three CNN architectures (VGG, ResNet, Inception-v3). Augmented models were built with the aid of a laboratory dataset using two approaches, achieving an overall improvement in the testing F1-score of 0.03-0.05 compared with baseline models. Compared with augmentation method I, models built with method II performed slightly better, among which the VGG model achieved the highest performance in this study (F1-score of 0.997 on the test set), and its feature maps were also visualized. The feature extraction process focused more on the leaf regions of target seedling while neglecting the most unimportant background information, demonstrating the effectiveness of the CNN model in learning the morphology of greenhouse seedlings for growth assessment. Various limitations that should be addressed in future work were also discussed, including the obstacles in developing the high-throughput plant phenotyping platforms (HTPPs) in the greenhouse in the sensor-to-plant manner, a much wider variety of images needed for more robust models, and the necessity for quantitative assessing of seedling growth vigor.
[1] De L C, Pathak P, Rao A N, et al. Commercial Orchids[M]. Berlin, Boston: De Gruyter, 2015.
[2] Hsieh C L, Weng S F. Prediction of physical properties of orchid seedlings “Sogo Vivien F819” in a flask by digital imaging[J]. Canadian Biosystems Engineering, 2005, 47(3): 23-32.
[3] Blanchard M, Lopez R, Runkle E, et al. Growing the best Phalaenopsis[J]. Orchids, 2007, 4: 266-271.
[4] Runkle E, Wang Yintung, Blanchard M, et al. Growing the best Phalaenopsis[J]. Orchids, 2007, 76: 24-28.
[5] Chen Chiachung, Chien M. The leaf growth model and influencing factors inorchid[J]. African Journal of Agricultural Research, 2012, 7(28): 4045-4055.
[6] Zhao Chunjiang, Zhang Ying, Du Jianjun, et al. Crop phenomics: Current status and perspectives[J]. Frontiers in Plant Science, 2019, 10: 714.
[7] Arend D, Lange M, Pape J M, et al. Quantitative monitoring ofgrowth and development using high-throughput plant phenotyping[J]. Scientific Data, 2016, 3: 160055.
[8] Liao Minsheng, Chen Shifang, Chou Chengying, et al. On precisely relating the growth ofleaves to greenhouse environmental factors by using an IoT-based monitoring system[J]. Computers and Electronics in Agriculture, 2017, 136: 125-139.
[9] Tomé F, Jansseune K, Saey B, et al. RosettR: Protocol and software for seedling area and growth analysis[J]. Plant Methods, 2017, 13: 13.
[10] Armoniené R, Odilbekov F, Vivekanand V, et al. Affordable imaging lab for noninvasive analysis of biomass and early vigour in cereal crops[J]. BioMed Research International, 2018: 5713158.
[11] Nguyen G N, Norton S L, Rosewarne G M, et al. Automated phenotyping for early vigour of field pea seedlings in controlled environment by colour imaging technology[J]. PLOS One, 2018, 13(11): e0207788.
[12] Choudhury S D, Bashyam S, Qiu Yumou, et al. Holistic and component plant phenotyping using temporal image sequence[J]. Plant Methods, 2018, 14: 35.
[13] Correa P, Bautista P, Lopez M, et al. An approach of beans plant development classification using fuzzy logic[J]. Journal of Sensors, 2019: 4232536.
[14] Singh A K, Ganapathysubramanian B, Sarkar S, et al. Deep learning for plant stress phenotyping: Trends and future perspectives[J]. Trends in Plant Science, 2018, 23(10): 883-898.
[15] Hadji I, Wildes R P. What do we understand about convolutional networks[Z]. 2018, https://arxiv.org/abs/1803.08834.
[16] Zhao Zhongqiu, Zheng Peng, Xu Shoutao, et al. Object detection with deep learning: A review[J]. IEEE Transactions on Neural Networks and Learning Systems, 2019, 30(11): 3212-3232.
[17] Liu Ziyi, Gao Junfeng, Yang Guoguo, et al. Localization and classification of paddy field pests using a saliency map and deep convolutional neural network[J]. Scientific Reports, 2016, 6: 20410.
[18] Wang Guan, Sun Yu, Wang Jianxin. Automatic image-based plant disease severity estimation using deep learning[J]. Computational Intelligence and Neuroscience, 2017: 2917536.
[19] Pawara P, Okafor E, Schomaker L, et al. Data augmentation for plant classification[C]// Proceedings of the International Conference on Advanced Concepts for Intelligent Vision Systems. Antwerp, Belgium, 2017: 615-626.
[20] Liang Qiaokang, Xiang Shao, Hu Yucheng, et al. PD 2 SE-Net: Computer-assisted plant disease diagnosis and severity estimation network[J]. Computers and Electronics in Agriculture, 2019, 157: 518-529.
[21] Jiang Peng, Chen Yuehan, Liu Bin, et al. Real-time detection of apple leaf diseases using deep learning approach based on improved convolutional neural networks[J]. IEEE Access, 2019, 7: 59069-59080.
[22] Douarre C, Crispim-Junior C F, Gelibert A, et al. Novel data augmentation strategies to boost supervised segmentation of plant disease[J]. Computers and Electronics in Agriculture, 2019, 165: 104967.
[23] Simonyan K, Zisserman A. Very deep convolutional networks for large-scale image recognition[Z]. 2014, https://arxiv.org/abs/1409.1556.
[24] He Kaiming, Zhang Xiangyu, Ren Shaoqing, et al. Deep residual learning for image recognition[C]//Proceedings of the IEEE Conference on Computer Vision and Pattern Recognition. Las Vegas, USA, 2016: 770-778.
[25] Szegedy C, Vanhoucke V, Ioffe S, et al. Rethinking the inception architecture for computer vision[C]//Proceedings of the IEEE Conference on Computer Vision and Pattern Recognition. Las Vegas, USA, 2016: 2818-2826.
[26] LeCun Y, Kavukcuoglu K, Farabet C. Convolutional networks and applications in vision[C]//Proceedings of 2010 IEEE International Symposium on Circuits and Systems. Paris, France, 2010: 253-256.
[27] Sutskever I, Martens J, Dahl G, et al. On the importance of initialization and momentum in deep learning[C]//Proceedings of the 30thInternational Conference on Machine Learning. Atlanta, USA, 2013: 1139-1147.
[28] Cruz A, Ampatzidis Y, Pierro R, et al. Detection of grapevine yellows symptoms inL. with artificial intelligence[J]. Computers and Electronics in Agriculture, 2019, 157: 63-76.
[29] Yosinski J, Clune J, Bengio Y, et al. How transferable are features in deep neural networks[C]//Proceedings of the Advances in Neural Information Processing Systems, 2014: 3320-3328.
[30] Brahimi M, Boukhalfa K, Moussaoui A. Deep learning for tomato diseases: Classification and symptoms visualization[J]. Applied Artificial Intelligence, 2017, 31(4): 299-315.
[31] Ferentinos K P. Deep learning models for plant disease detection and diagnosis[J]. Computers and Electronics in Agriculture, 2018, 145: 311-318.
[32] Lee H, Eum S, Kwon H. Is pretraining necessary for hyperspectral image classification[C]//IEEE International Geoscience and Remote Sensing Symposium. Yokohama, Japan, 2019: 3321-3324.
[33] Peng A Y, Koh Y S, Riddle P, et al. Using supervised pretraining to improve generalization of neural networks on binary classification problems[C]//Proceedings of the Joint European Conference on Machine Learning and Knowledge Discovery in Databases. Dublin, Ireland, 2019: 410-425.
[34] Sun Chen, Shrivastava A, Singh S, et al. Revisiting unreasonable effectiveness of data in deep learning era[C]//Proceedings of the IEEE International Conference on Computer Vision. Venice, Italy, 2017: 843-852.
[35] Chen Dijun, Neumann K, Friedel S, et al. Dissecting the phenotypic components of crop plant growth and drought responses based on high-throughput image analysis[J]. The Plant Cell, 2014, 26(12): 4636-4655.
[36] Moriyuki S, Fukuda H. High-throughput growth prediction forL. seedlings using chlorophyll fluorescence in a plant factory with artificial lighting[J]. Frontiers in Plant Science, 2016, 7: 394.
[37] Hu Yang, Wang Le, Xiang Lirong, et al. Automatic non-destructive growth measurement of leafy vegetables based on Kinect[J]. Sensors, 2018, 18(3): 806.
基于图像和卷积神经网络的蝴蝶兰种苗生长势评估
朱逢乐1,郑增威1,2※
(1. 浙江大学城市学院智能植物工厂浙江省工程实验室,杭州 310015;2. 浙江大学城市学院计算机与计算科学学院,杭州 310015)
在蝴蝶兰()产业中,种苗在达到最短营养栽培时长时的生长势在其后续的栽培链和最终的经济利润中起着重要的作用。当前在商业大型温室中主要采取人工方式对每株种苗进行评估,既费时又费力。基于RGB图像进行植物生长评估的相关研究依赖于从图像中手动提取人工定义的特征,从而影响了机器学习模型的有效性和泛化能力。该研究使用卷积神经网络(Convolutional Neural Network,CNN)来探讨其以端对端方式评估温室中蝴蝶兰种苗生长势的可行性。对在温室中采集的图像数据集,采用不同的CNN架构(VGG、ResNet和Inception-v3)结合不同的训练机制(从头训练、微调、特征提取)建立基准模型,其中微调取得了最佳的分类结果。考虑到该研究的目标任务是对具有复杂图像背景的单个温室种苗的形态分类,为进一步提高模型性能,在可控的实验室条件下采集了更多的种苗图像。实验室图像进行背景分割后,用于协助模型更好地学习植株的形态,即建立增强模型。与基准模型相比,2种增强方式总体上在温室测试集的F1-score取得了0.03~0.05的提升。采用增强方式II的VGG模型取得了最高的性能(温室测试集上的F1-score为0.997),并对该模型的特征图进行可视化。在高层特征图中,目标种苗区域被激活,同时滤除了大部分背景(包括相邻种苗的叶片),进一步证明了能够采用CNN对温室种苗进行有效的形态学习和刻画。总体结果表明,深度学习模型可用于基于图像的蝴蝶兰种苗生长势评估,并且可扩展用于温室下其他植物类型的生长评估。
长势;图像处理;卷积神经网络;种苗;微调;特征可视化;评估
Zhu Fengle, Zheng Zengwei. Image-based assessment of growth vigor forseedlings using convolutional neural network[J]. Transactions of the Chinese Society of Agricultural Engineering (Transactions of the CSAE), 2020, 36(9): 185-194. (in English with Chinese abstract)doi:10.11975/j.issn.1002-6819.2020.09.021 http://www.tcsae.org
朱逢乐,郑增威. 基于图像和卷积神经网络的蝴蝶兰种苗生长势评估[J]. 农业工程学报,2020,36(9):185-194. doi:10.11975/j.issn.1002-6819.2020.09.021 http://www.tcsae.org
2020-01-18
2020-04-14
Natural Science Foundation of Zhejiang Province, China (LGN20F020003)
Zhu Fengle, Lecturer, research interests: digital agriculture, plant phenotyping, image processing, machine learning. Email:zhufl@zucc.edu.cn
Zheng Zengwei, Professor, research interests: internet of things, wireless sensor network, location-based service, digital agriculture, pervasive computing. Email:zhengzw@zucc.edu.cn
10.11975/j.issn.1002-6819.2020.09.021
A
1002-6819(2020)-09-0185-10
猜你喜欢
园艺与种苗(2022年3期)2022-05-13
园艺与种苗(2022年2期)2022-04-09
园艺与种苗(2021年11期)2021-12-30
云南农业(2021年10期)2021-10-22
云南农业(2021年9期)2021-09-24
云南农业(2021年8期)2021-09-06
园艺与种苗(2021年5期)2021-06-30
小学生优秀作文(低年级)(2020年12期)2021-01-14
英语文摘(2019年2期)2019-03-30
中华诗词(2017年3期)2017-11-27