
A novel strategy for quantitative analysis of soil pH via laser-induced breakdown spectroscopy coupled with random forest
2020-07-09 04:19MingjingZHAO赵明静ChunhuaYAN闫春华YaozhouFENG冯耀州JiaXUE薛佳HongshengTANG汤宏胜TianlongZHANG张天龙andHuaLI李华
Plasma Science and Technology 2020年7期
Mingjing ZHAO (赵明静),Chunhua YAN (闫春华),Yaozhou FENG (冯耀州),Jia XUE (薛佳),Hongsheng TANG (汤宏胜),Tianlong ZHANG (张天龙),3 and Hua LI (李华),,3
1 Key Laboratory of Synthetic and Natural Functional Molecular Chemistry of Ministry of Education,College of Chemistry & Materials Science,Northwest University,Xi’an 710069,People’s Republic of China
2 College of Chemistry and Chemical Engineering,Xi’an Shiyou University,Xi’an 710065,People’s Republic of China
3 Authors to whom any correspondence should be addressed.
Abstract
Keywords:laser-induced breakdown spectroscopy (LIBS),random forest,soil pH,quantitative analysis
1.Introduction
Soil as a complex and independent ecosystem can exchange material and energy with the surrounding environment,and its quality is closely related to the health of plants,animals and humans.In recent years,with the expanding population and social economy development,the degree of land exploitation and utilization has been increasing,which leads to an increasingly serious degradation of land,especially in agriculture.The quality of soil is severely affected by some human production and living activities,such as large-scale application of pesticides and chemical regulatory substances,excessive and unreasonable use of chemical fertilizers,as well as the use of sewage irrigation practices,and so on.These human activities lead to a large number of pollutants entering soil through various channels.Moreover,the destruction of soil acid-base balance leads to severe decline in agricultural production.The pH of soil can reflect the degree of acidity and alkalinity,and performs a critical role in the fertility of soil.Almost all soil processes are related to acid-base equilibria,such as the decomposition of soil organic matter,the transformation of soil nutrients,anion-cation balance and plant growth [1].Excessive acidity of soil will not only reduce the efficiency in the crop absorption process of phosphorus,potassium,calcium,magnesium and other nutrients,but also reduce the number of beneficial organisms and their activity.Therefore,an effective pH measurement method of soil is significant necessary to accurate fertility judgment of soil,which contributes to understanding the biochemical process of soil as well as its relationship with soil and vegetation.
The conventional analytical methods of pH in soil mainly include the potentiometric method and colorimetric method[1–3].Colorimetric method is quite convenient to measure the pH,but its analytical result is easily affected by the subjective feeling of tester.The potentiometric method is commonly used to determine pH due to its advantage of accuracy.However,this method requires a complex sample preparation and a longer analytical time,which hinders its application for rapid analysis.Therefore,a rapid and effective detective method is urgently needed to analyze soil pH.Laser induced breakdown spectroscopy(LIBS)is a novel element analytical technique based on atomic emission spectroscopy (AES)[4,5],and shows several obvious advantages,such as without complex sample preparation,simultaneous multi-element detection,rapid analysis,in situ and remote detection [6–8].In recent years,LIBS technique has been continuously developed and improved,especially in Asia [9–11].Currently,this technique has been widely applied in environmental monitoring [12–14],food analysis [15],scientific archaeology[16],medical diagnosis[17],geological resource exploration [18],space exploration [19],industrial detection[20–22]and many other fields,particularly in the field of environmental monitoring.The LIBS technique was applied in environment monitoring field including soil [23–26],atmosphere particulates [27],ocean [28]and so on.The research work of LIBS technology applied in soil analysis mainly focuses on the quantitative analysis of heavy metal elements [23,24]and nutrients [25,26].Yi et al [23]employed LIBS technique combined with solid–liquid–solid transformations to quantitatively analyze the concentration of Cd and Pb elements in soil,and the results showed that R2of calibration curves reached to more than 0.98,and the limits of detection for available Cd and Pb elements in soil were 0.067 and 0.94 ppm,respectively.Rühlmann et al [25]quantified the Ca element in soil by the LIBS technique coupled with partial least squares(PLS),and a good quantitative predictive result (the root mean square error of cross-validation(RMSECV) was 0.314 wt.%,the R2achieved 0.99) was obtained.However,there are few works on the application of LIBS technology in soil pH determination.Ferreira et al[29]proposed LIBS combined with PLS to predict pH of soil,and received a well predictive result.
Theoretically,the pH of soil can be determined primarily by measuring its hydrogen ion concentration,which is usually a univariate quantitative method.For the quantitative analysis of pH of soil samples with the LIBS technique,it can be carried out by a calibration curve obtained from a single characteristic spectral line of H element and according to their reference pH value.However,the quantitative results of the univariate method are easily affected by some interference factors caused by the inhomogeneity of chemical composition on soil sample surface,matrix effects and uncontrollable fluctuation of experimental parameters,which fails to meet the rapid and accurate analysis requirements for pH of soil samples.In addition,the pH of soil is also related to the amount of acid-induced ion (Al3+) adsorbed on soil colloid,alkaline-earth metals cations(Mg2+and Ca2+)and the acidic oxide (SiO2) [1,2].Thus,the multivariate analytical method is an effective way to improve the quantitative analysis results of the univariate method.In the study of Ferreira et al [29],the multivariate method PLS was used to quantify the pH of soil,and the results showed that mean absolute error (MAE)and RMSEP were 0.3 pH units and 0.4,respectively.However,the R2after optimizing the latent variables was not ideal.PLS is a basic multivariate linear regression model that combines the advantages of principal component analysis,multiple linear regression,and canonical correlation analysis[30].However,for complex soil samples,there is a nonlinearity between the spectral variables and the concentration or properties,and PLS as a linear regression method cannot obtain a better predictive result [30,31].Therefore,a nonlinear multivariate method is needed to obtain a more stable calibration model.Random forest (RF) as a new regression algorithm based on multiple regression trees,was proposed by Leo Breiman in 2001 [32].It has several obvious advantages of a good tolerance for noise,preventing over-fitting and a high predictive precision.The combination of LIBS technique with RF method has been applied to the quantitative analysis of some metal elements [33]and non-metal elements [34,35]in steel samples,and satisfactory results have been obtained.From this point of view,RF has great potential for quantitative analysis.However,there is no literature on quantitative analysis of soil pH using LIBS combined with RF method.
In this study,the feasibility of the LIBS technique combined with the RF method for quantitative analysis of soil pH was explored.First of all,LIBS spectra of soil samples were collected,and the National Institute of Science and Technology (NIST) database was used to identify some common elements in soil.Then,the influence of different input variables on the predictive performance of the RF calibration model was explored,and the optimized RF calibration model was constructed based on the optimal input variables and model parameters.Finally,the RF calibration model was applied to quantitative analysis of soil pH,and the corresponding results were compared with the PLS calibration model.

Table 1.The source and pH reference values of soil samples.
2.Materials and methods
2.1.Determination of soil pH reference values
There were 21 soil samples in this work.The samples of 1#–11# were soil standard samples provided by the Institute of Geophysical and Geochemical Exploration of the Chinese Academy of Geological Sciences,and samples of 12#–21#were collected from different regions.In order to remove impurities and achieve full mixing,these soil samples were thoroughly ground and placed in an oven at 100°C for 6 hours,then passed through a sieve(200-mesh).About 2 g of each soil sample was weighed into a small beaker,and 4 ml of distilled water was added to each small beaker,and then sonicated for 15 min.The pH of soil was measured by a pH electrode(PHS-3C,Shanghai Yidian Scientific Instrument Co.,Ltd),and each soil sample was measured three times repeatedly,the three detective results were averaged to obtain a reference pH value for each soil sample.The pH reference values of 21 soil samples were given in table 1.Besides,the measurement uncertainty of the pH reference value of each sample was calculated to verify the reliability of the reference value.A small value of measurement uncertainty means a higher reliability,and vice versa.It can be seen from table 1,the measurement uncertainty of pH reference values are small,which proves that the pH reference values in this work are reliable.
2.2.LIBS measurements
LIBS measurement was carried out by an 8 ns Q-switched Nd:YAG laser (Dawa 300,Beijing Beamtech,China) with a wavelength of 1064 nm,the energy of 150 mJ and a repetition rate of 5 Hz.The thin slice made of soil samples was placed directly on an X-Y-Z manual micrometric stage,and the laser beam was focused onto soil sample surface via a plano-convex lens with 100 mm focal length to produce the plasma.The plasma radiation was coupled to a three-channel optical fiber spectrometer (MX2500+,Ocean Optics,USA,wavelength range:200–500 nm,resolution:0.07 nm).All the LIBS measurements of soil samples were carried out in air at atmospheric pressure.In this work,the gate width of the spectrometer was set to 1 ms,the delay time of the detector was set to 3 μs to avoid the detection of the pulsed laser Bremsstrahlung radiation and increase the signal-to-noise ratio (SNR).Before the LIBS measurements,Hg-Ar lamps were used to calibrate the wavelength of the LIBS spectrum.
For the LIBS analysis,each soil sample was compressed to a pellet with a pressure of 18 MPa for 4 min.In order to obtain a reasonable spectral intensity of each soil sample,LIBS spectra were obtained at 30 different positions for each soil sample surface.Besides,in order to improve the SNR,each measured spectrum was obtained by the accumulation of five laser pulses,the total spectra for the 21 samples was 630.The calibration set and test set were randomly selected based on the ratio of the calibration set to the test set sample 2:1.Finally,fourteen samples (1#,2#,4#,5#,7#,8#,9#,10#,15#,16#,17#,18#,19# and 20#) were set as the calibration set to construct the RF calibration model,and seven samples (3#,6#,11#,12#,13#,14# and 21#)were selected as test set to evaluate the predictive performance of RF calibration model.The RF quantitative codes were obtained from the[36].The quantitative analysis of soil pH was carried out using MATLAB (R2016a).
2.3.Random forest
RF is a new integrated learning algorithm based on multiple regression trees[37,38].A bootstrap resampling method was used to extract multiple samples from the original sample to form the bootstrap sample set.In RF modeling,the bootstrap sample set is applied to construct the multiple decision trees,the average of predictions of all the individual decision tree from the forest is determined as the predictive result.In the present work,the RF model was constructed by integrating the relationship between the spectral integrated intensity and the pH of each regression tree of each sample.
In general,the RF algorithm for regression works as follows:
(1) From the training data of n soil sequences,draw the ntreebootstrap sample (i.e.,randomly sample,with replacement,n soil sequences).
(2) For each bootstrap sample,grow a tree with the following modication:at each node,choose the best split among a randomly selected subset of mtry(rather than all) features.The tree is grown to the maximum size (i.e.,until no further splits are possible) and not pruned back.
(3) Predict new data by aggregating the predictions of the ntreetrees.
At each bootstrap iteration,nearly 37%of samples in the original sample set do not appear in the bootstrap sample,these data are called out-of-bag(OOB)data.The performance of the RF model was evaluated by cross-validation in parallel with the training steps using the OOB data.In RF modeling,the number of trees in the forest (ntree) and the number of peaks randomly selected as the candidates for splitting at each node of the tree (mtry) are two important parameters that are critical to optimizing soil pH quantification.These two parameters can be optimized by OOB error estimation.In general,the default mtryis M/3 (M represents the number of the spectral points in a spectrum) [32].
3.Results and discussion
3.1.LIBS spectral analysis
Figure 1 shows the LIBS spectrum and the characteristic lines of four elements Ca,Mg,Si,and Al in the range of 200–400 nm for sample 6#.Due to the complexity and diversity of chemical composition,there are many chemical elements in soil.As shown in table 2,14 elements were identified based on the NIST database.In general,elemental content is related to its line intensity.Therefore,pH value of soil can be directly computed by the line intensity of relevant element.However,the calculation of soil pH does not just involve only one element.Therefore,in order to obtain a better predictive result,multivariate analysis methods were selected to quantify the pH of soil.
3.2.Selection and optimization of input variables of RF calibration model
In order to obtain a better predictive result,it is necessary to explore the influence of different input variables on the performance of RF calibration model.In this study,the optimal input bands were first selected.As can be seen from figure 1,the LIBS spectral information of the soil sample is mainly concentrated in the range of 200–400 nm.So the input variables based on the regions of 200–300 nm,300–400 nm and 200–400 nm were first optimized by cross-validation based on OOB estimation,theand RMSECV were used as evaluation indicators.The cross-validation results with differentinput bands were shown in figure 2.As can be seen from figure 2,the results obtained with 200–300 nm as input variables are not very satisfying.This may be due to the lack of some feature information in this spectral range.For the regions of 300–400 nm and 200–400 nm,theand RMSECV values are very similar to those of the full spectrum model and the number of variables is also reduced.However,some redundant information is still included in the selected spectral regions,which affects the accuracy of the quantitative results.Therefore,in order to further improve the quantitative performance of the model,it is necessary to eliminate the peaks of LIBS spectra which interfere with the quantitative results,and to screen out the spectral peaks that are related to the quantitative analysis of soil pH for modeling.
Considering that the acidity of soil is closely related to the acid-induced ion Al3+adsorbed on soil colloid,the exchangeable aluminum ions on the colloid are exchanged into the solution to make soil acidic.The carbonate and bicarbonate of alkaline-earth metals Ca and Mg are the main sources of OH-in soil,which affect the alkalinity of soil.The oxide of Si is an acidic oxide.Therefore,the intensities of characteristic bands and characteristic lines of Al,Ca,Mg and Si identified based on the NIST database were optimized and compared by cross-validation based on OOB estimation.As can be seen from figure 2,compared to other input variables,the RF model with the intensity of characteristic bands of Al,Ca,Mg and Si as input variable received a highestand the smallest RMSECV(=0.9993,RMSECV=0.0213).This is because the characteristic bands contain abundant characteristic information.Finally,the intensities of characteristic bands of Al,Ca,Mg and Si were selected as the optimal input variables to construct RF calibration model.The parameters of RF model were optimized by OOB error estimation (ntree=500,mtry=105).
3.3.Verification of RF calibration model
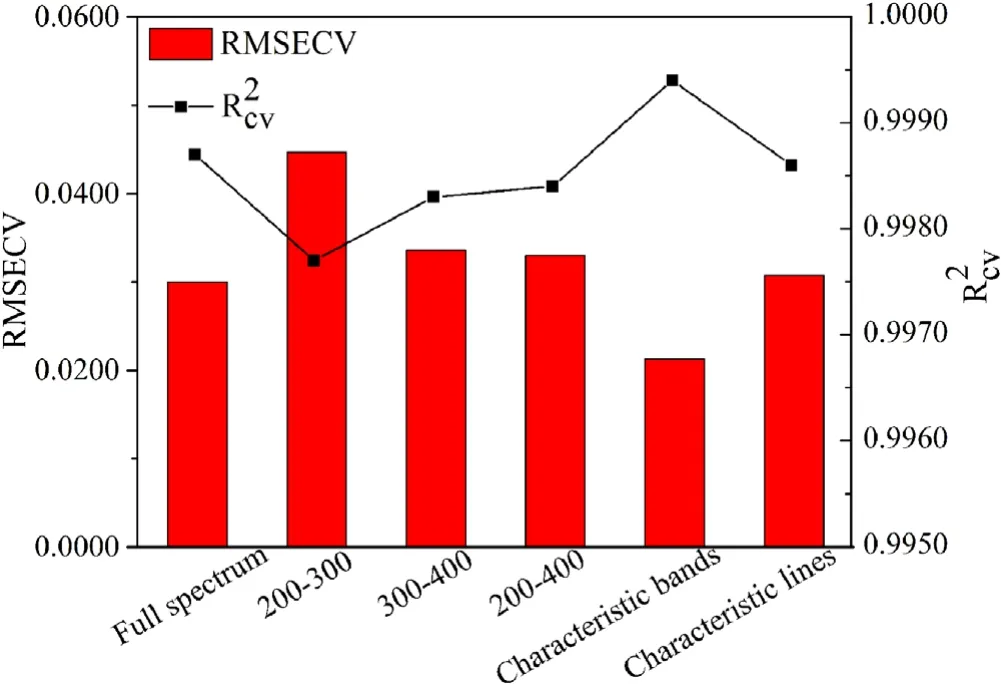
Figure 2.Effect of different input variables on prediction performance of the RF calibration model.
Based on the optimal input variables and model parameters,an RF calibration model was constructed for predicting the pH of soil samples.Here,the test set and the calibration set were used as external validation and internal validation,respectively.The predictive values of soil pH obtained by the RF calibration method were averaged and then plotted.In order to verify the predictive performance of RF model,PLS model was established with the same input variables.The optimized latent variables of the PLS model obtained by the five-fold cross validation (CV) were 5.Based on the optimal PLS calibration model,the soil pH of the test set and the calibration set were predicted.As can be seen from figure 3,the,RMSEP,,and RMSEC of RF model (Rp2=0.9687,RMSEP=0.1285,Rc2=0.9995,RMSEC=0.0201) are better than those of PLS model (Rp2=0.9294,RMSEP=0.2218,Rc2=0.9897,RMSEC=0.1123).Moreover,the error bars in figure 3 reflect the repeatability of the predictive results.A small value of error bar means a better repeatability,and vice versa.It can be found from figure 3 that the error bar of the RF model is smaller than that of the PLS model,indicating that the predictive result of the RF model has better repeatability.Table 3 shows the relative errors of RF and PLS model.It can be seen that the mean relative error (MRE) of the RF model was significantly lower than that of the PLS model.These indicators mean that RF calibration model shows a better predictive performance than PLS model for pH of soil.In addition,the RMSEP,MRE,and MAE obtained by RF and PLS in this work,and the RMSEP and MAE obtained by PLS in the study of Ferreira et al [29]were given in table 4.It can be seen from table 4 that the RF calibration model showed the optimal predictive performance(RMSEP=0.1285,MRE=0.0136 and MAE=0.1114)compared with the PLS calibration model in this work and[29].It is proved that using the intensity of characteristic bands of Al,Ca,Mg,and Si for input variables to construct an RF calibration model is a feasible method for predicting soil pH.
4.Conclusions
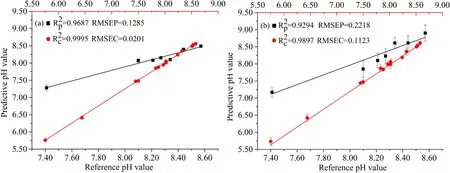
Figure 3.Predicted results of two different calibration models.(a)RF calibration model,(b)PLS calibration model.The horizontal axes of the calibration set and test set are at the top and bottom,respectively.

Table 3.Soil pH prediction and relative error of RF model and PLS model.

Table 4.Comparison of predictive results for RF,PLS and PLSa models.
In this study,the LIBS technique combined with the RF method was successfully applied to predict the pH of soil.LIBS spectra of 21 soil samples were acquired by the LIBS technique,and 14 common elements in soil samples were identified based on the NIST database.Then,different spectral ranges (full spectrum,different spectral ranges,characteristic bands and intensity of characteristic lines) were selected as input variables to explore the predictive performance of the RF calibration model with the evaluation indicators of RMSE and R2,and the intensities of characteristic bands of four elements (Al,Ca,Mg and Si) were determined as the optimal input variables.Finally,based on the optimal input variables and model parameters,the two calibration models of PLS and RF were constructed and compared to predict the pH of soil samples.Compared with PLS calibration models obtained in this work and in the study of Ferreira et al [29],RF calibration model showed a better predictive performance (Rp2=0.9687,RMSEP=0.1285,MAE=0.1114 and MRE=0.0136).Based on the results obtained in this work,it could be concluded that four elements (Al,Ca,Mg and Si) were closely related to the pH of soil.To sum up,the LIBS technique coupled with the RF method is an effective tool for quantitative analysis of soil pH.The present work provides a technical support for rational fertilization of soil.
Acknowledgments
We are grateful for the support of National Natural Science Foundation of China (Nos.21873076,21675123,21605123,21375105),Natural Science Basic Research Plan in Shaanxi Province of China (No.2018JQ2013),and Scientific Research Plan Projects of Shaanxi Education Department(No.17JK0780).
猜你喜欢
疯狂英语·新阅版(2022年7期)2022-07-07
作文大王·低年级(2020年12期)2020-12-31
小天使·一年级语数英综合(2020年3期)2020-12-16
作文大王·低年级(2020年11期)2020-11-23
百花(2020年2期)2020-09-10
黄河之声(2020年5期)2020-05-21
作文周刊·小学二年级版(2020年4期)2020-04-23
作文大王·低年级(2019年9期)2019-10-11
读友·少年文学(清雅版)(2019年2期)2019-06-12
小溪流(画刊)(2017年6期)2017-07-10
 Plasma Science and Technology2020年7期
- Plasma Science and Technology的其它文章
- Influence of target temperature on femtosecond laser-ablated brass plasma spectroscopy
- Spectral characteristics of underwater laserinduced breakdown spectroscopy under high-pressure conditions
- Quantitative analysis of the content of nitrogen and sulfur in coal based on laserinduced breakdown spectroscopy:effects of variable selection
- Geographical authenticity evaluation of Mentha haplocalyx by LIBS coupled with multivariate analyzes
- Quantitative analysis of saindha salt using laser induced breakdown spectroscopy and cross-validation with ICP-MS
- Temporal and spatial evolution measurement of laser-induced breakdown spectroscopy on hydrogen retention in tantalum