
Typical and atypical COVID-19 computed tomography findings
2020-09-10 02:57DamianoCarusoTizianoPolidoriGisellaGuidoMatteoNicolaiBenedettaBracciAntonioCremonaMartaZerunianMichelaPoliciFrancescoPucciarelliCarlottaRucciChiaraDeDominicisMarcoDiGirolamoGiuseppeArgentoDanielaSergiAndreaLaghi
World Journal of Clinical Cases 2020年15期
Damiano Caruso, Tiziano Polidori, Gisella Guido, Matteo Nicolai, Benedetta Bracci, Antonio Cremona, Marta Zerunian, Michela Polici, Francesco Pucciarelli, Carlotta Rucci, Chiara De Dominicis, Marco Di Girolamo,Giuseppe Argento, Daniela Sergi, Andrea Laghi
Damiano Caruso, Tiziano Polidori, Gisella Guido, Matteo Nicolai, Benedetta Bracci, Antonio Cremona, Marta Zerunian, Michela Polici, Francesco Pucciarelli, Carlotta Rucci, Chiara De Dominicis, Marco Di Girolamo, Giuseppe Argento, Daniela Sergi, Andrea Laghi, Department of Surgical and Medical Sciences and Translational Medicine, “Sapienza”-University of Rome,Sant'Andrea University Hospital, AOU Sant’Andrea, Rome 00189, Italy
Abstract
Key words:SARS-CoV-2;COVID-19;Chest computed tomography;Interstitial pneumonia;Ground-glass opacities
INTRODUCTION
In December 2019, several cases of pneumonia of unknown origin have emerged in Wuhan city, Hubei Province of China, manifesting as respiratory symptoms like fever,cough and dyspnea[1-4].A novel coronavirus, named severe acute respiratory syndrome coronavirus 2 (SARS-CoV-2) was identified and the disease associated was consequently named coronavirus disease 2019 (COVID-19).In a few weeks, the World Health Organization declared COVID-19 as pandemic with more than 2 million cases,with United States, Spain and Italy mostly affected.
Clinical symptoms are characterized by fever, cough, myalgia, fatigue associated to dyspnea.According to the latest guidelines, real-time reverse transcription polymerase chain reaction applied on respiratory tract specimens is considered the reference standard for the diagnosis of SARS-CoV-2[5].On the other hand, chest computed tomography (CT) may be extremely helpful for the diagnosis, management and follow-up of COVID-19 due to the high sensitivity as described by Aiet al[6]and Carusoet al[7]where both studies reported a sensitivity of 97%.
The typical pattern is characterized by bilateral posterior ground glass opacities(GGOs)[8,9], misdiagnosed at chest X-ray, as described by Yoonet al[10], where a considerable proportion of patients with COVID-19 pneumonia had normal chest radiographs.In a recent study[7], GGO with bilateral and peripheral distribution characterized by multilobe involvement were described as the typical CT features in patients affected by COVID-19 pneumonia, associated to subsegmental pulmonary vessels enlargement.Despite the typical pattern, other CT features were observed with a relative frequency;thus, the aim of this review is to illustrate typical and atypical CT findings of COVID-19.
GROUND GLASS OPACITY
GGO is characterized by an increased area of attenuation of the lung, with recognizable bronchial and vascular structures, remaining less opaque than consolidation, in which bronchovascular margins are obscured[11](Figure 1).Histologically, GGO represents an area of alveolar septal inflammation and intraalveolar cellular desquamation with a small amount of granulation tissue in the terminal air spaces[12].GGO can be observed in three typical patterns:Crazy paving,rounded or linear.
In a systematic review of 919 patients in China, Salehiet al[13]reported GGOs in 88%of COVID-19 patients, while Baiet al[14]reported GGOs in only 46% of the study population.In a longitudinal study performed by Wanget al[15], GGO was described as the predominant pattern of abnormalities after symptom, while consolidation was the second most seen feature in the first 11 d.When combined together, ground-glass opacity and consolidation constituted about 83% to 85% of all CT findings found in the early stage of the disease.CT examination may be effective in the baseline evaluation of patients affected by COVID-19, especially in those with symptoms of dyspnea and respiratory distress and it can be considered as an early sign of the damage to the alveolar epithelium caused by the virus[16].
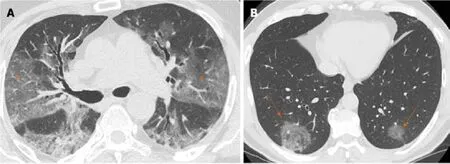
Figure 1 Computed tomography images of ground glass opacity.
CRAZY PAVING
Crazy paving is characterized by GGOs associated with interlobular and intralobular septal thickening (Figure 2).These CT findings are non-specific since they can be found in numerous pathologies, such as non-specific alveolar proteinosis, acute respiratory distress syndrome and other interstitial pneumonia[17-19].
In a recent study, Guanet al[20]estimated that the incidence of the crazy-paving pattern in Chest CT of COVID-19 patients is approximately 89% (42/47 of the patients examined by them), with predominant subpleural distribution (93.6%).Similarly,Chenet al[21]reported a high incidence of crazy-paving pattern (48.8% of cases),distributed mainly to the peripheral areas of the lung.Therefore, based on their analysis, it emerges how the crazy paving pattern is a frequent feature in pulmonary involvement from COVID-19, with typical peripheral distribution.This finding is probably caused by SARS-CoV-2 tropism for terminal bronchioles and surrounding lung parenchyma.
VESSEL ENLARGEMENT
Vascular enlargement is defined as the hypertrophy of the subsegmental pulmonary vessels increased in size (>3 mm) particularly in areas with more pronounced interstitial impairment[7,22](Figure 3).Albarelloet al[22]firstly described subsegmental vessels increasing in the baseline CT, with an additional increase from 5% to 14% at the sixth day during follow up.Baiet al[14]described subsegmental vascular enlargement in 59% of patients, whereas Carusoet al[7]reported 89% of patients with CT findings of subsegmental vascular enlargement.
This new radiological evidence suggested a different pattern of lung involvement compared to those observed in other known severe coronavirus infections (Severe Acute Respiratory Syndrome and Middle East Respiratory Syndrome), where pulmonary vessel vasoconstriction was possibly related to the presence of vasoactive substance within the lesions[23].Vascular injury consisted in edema of pulmonary vessel’s wall and fibrous thrombi with or without pulmonary infarction.
In COVID-19 these findings might be attributed to damage and swelling of the capillary wall caused by pro-inflammatory factors[24].Indeed, a systemic vasculitis was mostly observed in autopsies and this could be caused by autoantibodies against pulmonary epithelial and endothelial cells[25].Coronavirus binds to the zinc peptidase angiotensin converting enzyme, a surface molecule that is localized on the endothelial cells of arteries, and the suppression of angiotensin converting enzyme expression during SARS-CoV-2 infection has been proposed to play a role in pathologic changes in the lungs[26].
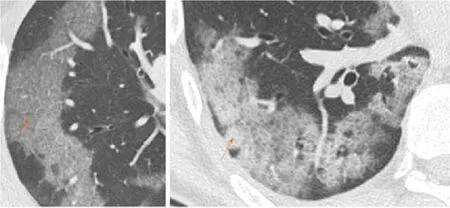
Figure 2 Computed tomography Images of crazy paving.

Figure 3 Computed tomography images of vessel enlargement.
HALO SIGN
Halo sign is a non-specific sign defined as a circular zone of ground glass attenuation surrounding a pulmonary nodule or mass (Figure 4A and B), classically used to describe hemorrhagic nodules, in pathologies as angioinvasive fungal infections,hypervascular metastases and Wegener granulomatosis vasculitis;Nevertheless, halo sign could be also detected in interstitial pneumonia, such as viral infections and cryptogenic organizing pneumonia[27,28].
Recently, the halo sign was described also in COVID-19 patients as reported by Liet al[29]describing pulmonary nodules with a halo sign in 9 patients (17.6%), while Chenet al[21]observed it in 7 patients (11.3%), considering the halo sign as a feature of the early stage of the disease[21].
Considering the halo sign’s frequency in COVID-19 patients, some differences in literature are emerging, but it can be considered as an uncommon CT finding.
REVERSED HALO SIGN
Reversed halo sign (or atoll sign) is a focal rounded ground glass opacity surrounded by a more or less complete ring-like consolidation (Figure 4C).It was initially reported to be specific for cryptogenic organizing pneumonia, but it was subsequently described in a variety of pulmonary diseases, in particular infective pneumonia,tuberculosis and other pathologies such as sarcoidosis and pulmonary infarction[30,31].
Recently, this sign was reported in few cases of COVID-19, which probably may represent a disease progression to initial consolidation around GGO or absorbed lesion leaving a decreased intensity in the center[32].Bernheimet al[18]investigated CT findings changes based on time lapse incurred between initial CT scan and symptom onset,reporting the absence of reverse halo sign in the early group of patients (0-2 d), and present in 4% of patient in the late group (6-12 d).Reverse halo sign still remained an atypical CT feature of COVID-19.
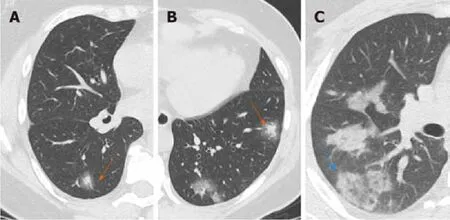
Figure 4 Computed tomography Images of halo sign-reversed halo sign.
CONSOLIDATION
Consolidation appeared as a homogeneous increase in pulmonary parenchymal attenuation with an obscuration of the margins of vessels and airway walls (Figure 5).It appears in pathological situations where an exudate or other product of disease replaces alveolar air, making the lung solid (as in infective pneumonia)[11].Histologically, consolidation is due to intra-alveolar fibroblastic granulation tissues,also known as Masson bodies[12].
Jinet al[33]reported that large light consolidative opacities with air bronchograms in the rapid progression stage of the disease (3–7 d of symptomatic presentation), while during the consolidation stage (second week of symptomatic presentation), reduction in density and size of the consolidative opacities may be observed.Leiet al[9]defined consolidation as a common sign of COVID-19 associated to GGO reported in 96% of patients, while Liet al[29]reported the presence of consolidation in 63.9% of population.
Interestingly, during follow-up studies, CT showed increased consolidation suggestive for progression of the disease[9];However, the appearance of lung consolidation on ground glass area is not related to a worsening of clinical and laboratory data.
AIR BRONCHOGRAM
Air bronchogram is a pattern of air-filled bronchi on a background of opaque air-less or consolidated lung (Figure 6).The sign implies patency of proximal airways and evacuation of alveolar air by means of absorption (atelectasis) or replacement(pneumonia) or a combination of these processes.Air bronchogram is usually a sign of alveolar involvement[34].
Chenet al[21]described the presence of air bronchogram in 56.2% of COVID-19 cases,mostly in the middle-aged patients who present a more severe lobar involvement.Similarly, Zhouet al[35]in their meta-analysis described the air bronchogram sign as one of the most common signs in COVID-19 patients (44.7%), often in patients with bilateral and multilobe involvement.Lyuet al[36]showed that air bronchogram was a common sign (63%) and increased in severe and critical patients compared to the ordinary cases.Again, according to these authors, air bronchogram could be related to a central representation of disease from COVID-19.
INTERLOBULAR SEPTAL THICKENING
Interlobular septal thickening is usually found on chest radiographs as thin linear opacities at right angles in contact with the lateral pleural surfaces near lung bases(Kerley B lines);this sign commonly occurred in lymphangitic cancer spread or pulmonary edema.Kerley A lines are predominantly situated in the upper lobes,described as fine linear opacities radially oriented toward the hila[37].In recent years,the anatomically descriptive terms septal lines and septal thickening have gained favor over Kerley lines[38](Figure 7).
The SARS-CoV-2 usually attacks the components of the septa, thus it may reflect the interlobular septal thickening visible in the CT images.On thin-section CT scans,septal thickening may be smooth or nodular, which may help refine the differential diagnosis[39].Interlobular septal thickening is also often associated with GGOs in more advanced disease frameworks, in which there is a widespread involvement of all the lobes.
In the study described by Zhuet al[16]the CT sign of interlobular septal thickening was appreciable in 61.6% of COVID-19 cases.Most refer to advanced cases of disease,where, as the inflammatory response progresses, the GGOs gradually tend to consolidate and the signs of interlobular thickening become more evident.Chenet al[21]also showed that interlobular septal thickening was one of the most frequent CT signs from COVID-19, especially in patients with bilateral lung involvement (about 50%).

Figure 5 Computed tomography images of consolidation.
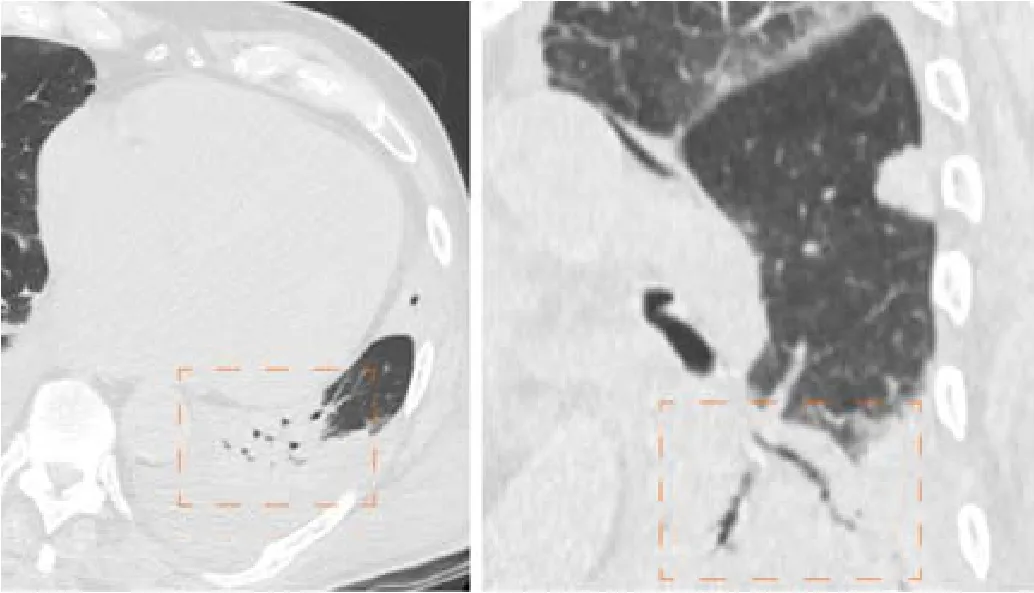
Figure 6 Computed tomography images of air bronchogram.
BRONCHIECTASIS
Bronchiectasis is a progressive and irreversible dilatation of the airways, with or without thickening of the corresponding bronchial walls;dilation frequently involves the more distal subsegmental bronchial branches, up to the bronchioles[40](Figure 8).The causes of bronchiectasis are manifold:Inflammatory processes, specific disease (i.e.cystic fibrosis) and idiopathic forms.
The study performed by Salehiet al[13]showed that bronchiectasis are not a frequent radiological sign in early stage of COVID-19 but they resulted visible in the advanced stages of pathology, whereas Zhaoet al[41]reported that traction bronchiectasis is an identifiable finding in almost half of the cases (52.5%).Therefore bronchiectasis,especially traction ones, could be considered as a radiological sign of progression of SARS-CoV-2 lung infection found in the most advanced stages of pathology.

Figure 7 Computed tomography images of interstitial septal thickening.

Figure 8 Computed tomography images of bronchiectasis.
CAVITATION
Cavitation or cavity is a circumscribed area of the lung filled with gas visible on CT as a low-density area within a consolidation, mass or nodule;In addition the cavitation is not synonymous of lung abscess and occurs when a necrotic part of a lung injury is drained or expelled through the bronchial tree.It often represents the evolution of a lung consolidation, which regresses leaving only a thin wall[42].
In COVID-19 cavitation is visible especially in the later stages of lung involvement,as described by Salehiet al[13]showing a transition over time from area of pure ground glass to area of ground glass associated with signs of cavitation, indicating the latter progress of the inflammatory involvement.Therefore, cavitation is one of the least frequent CT findings in COVID-19.
LYMPHADENOPATHY
The term lymphadenopathy refers to an enlargement of the lymph nodes.On CT scans, the normal nodes size ranges between sub-CT resolution and 12 mm for mediastinal and hilar stations;The upper limit of normal lymph node can be arbitrary consider of 10 mm in short axis diameter for mediastinal nodes and 3 mm for most hilar nodes (Figure 9).However, measuring method does not allow to differentiate healthy from pathologic lymph nodes[11].In addition, during inflammation, necrosis or neoplasia, the inflammatory cells drain into lymph nodes leading them to enlarge,without the possibility discriminate the specific etiology, by visual assessment on imaging[43].

Figure 9 Computed tomography images of lymphadenopathy.
This feature is rarely present in the early stage of COVID-19 on chest CT, but it may be observed during disease progression[13].Liet al[29]observed that severe and critical patients showed higher incidence of lymph nodes enlargement, pericardial effusion and pleural effusion than ordinary patients.
PLEURAL AND PERICARDIAL EFFUSION
Pleural effusion is defined as the accumulation of fluid in the pleural space usually when the fluid formation exceeds the rate of fluid removal[44].This may happen with an elevated net hydrostatic pressure gradient (transudation) or an increased permeability of the pleural vessels (exudation).Pleural effusion is a quite rare manifestation in SARS-Cov2 pneumonia (Figure 10).
Compared with early stage of disease, advanced stage is associated with a significantly increased frequency of pleural changes as subpleural line, subpleural transparent line, and pleural effusion as commented by Zhouet al[35].Further, this manifestation is quite rare and documented in the 7% of COVID-19 patients in the later stage disease by Wanget al[15].
Pericardial effusion occurs when excess fluid collects in the pericardial space (a normal pericardial sac contains about 30 to 50 mL of fluid).Pericardial effusion causes include a wide variety of etiologies as follows:Inflammatory, infectious (both viral and bacterial), tumoral, iatrogenic and post-traumatic.
Salehiet al[13]and Liet al[29]showed in their studies that pericardial effusion is one of the rarest CT features in COVID-19 patients, but it represents an expression of disease progression;In particular, Liet al[29]reported pericardial effusion in all critical patients(4.8% of total population).
CONCLUSION
The most frequent chest CT findings are GGO, consolidations, vascular enlargement,crazy paving, interlobular septal thickening and air bronchogram.Chest CT has a central role in the initial diagnosis and management of COVID-19 patients.Radiologists need to recognize high suspicious findings of COVID-19 on chest CT,both typical and atypical ones.
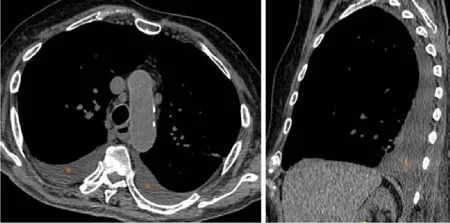
Figure 10 Computed tomography images of pleural effusion.
ACKNOWLEDGEMENTS
The authors would like to acknowledge the entire Radiological Medical, Technical and Nursing Staff for skillful technical assistance.
 World Journal of Clinical Cases2020年15期
- World Journal of Clinical Cases的其它文章
- Impacts and challenges of United States medical students during the COVID-19 pandemic
- Recent advances in the management of gastrointestinal stromal tumor
- Medical research during the COVID-19 pandemic
- Progress of intravoxel incoherent motion diffusion-weighted imaging in liver diseases
- Review of possible psychological impacts of COVID-19 on frontline medical staff and reduction strategies
- Overexpression of AMPD2 indicates poor prognosis in colorectal cancer patients via the Notch3 signaling pathway