
Hierarchical Visualized Multi-level Information Fusion for Big Data of Digital Image
2020-09-23 05:16LILanLINGuoliang蔺国梁ZHANGYunDUJia
LI Lan(李 岚),LIN Guoliang(蔺国梁),ZHANG Yun(张 云),DU Jia(杜 佳)
School of Digital Media,Lanzhou University of Arts and Science,Lanzhou 73000,China
Abstract: At present,the process of digital image information fusion has the problems of low data cleaning unaccuracy and more repeated data omission,resulting in the unideal information fusion. In this regard,a visualized multicomponent information fusion method for big data based on radar map is proposed in this paper. The data model of perceptual digital image is constructed by using the linear regression analysis method. The ID tag of the collected image data as Transactin Identification (TID) is compared. If the TID of two data is the same,the repeated data detection is carried out. After the test,the data set is processed many times in accordance with the method process to improve the precision of data cleaning and reduce the omission. Based on the radar images,hierarchical visualization of processed multi-level information fusion is realized. The experiments show that the method can clean the redundant data accurately and achieve the efficient fusion of multi-level information of big data in the digital image.
Key words: digital image; big data; multi-level information; fusion
Introduction
In the Internet age,there are more and more information fusion methods. As the most intuitive form of information representation,digital images play an important role in the field of information fusion because of their characteristics of intuition,readability,ease of understanding and processing. Big data means that when data volume and performance of data develop enough,it can become the design and determinant factors of data management and analysis system[1-3]. Visualization is the theory,method and technology of using image processing technology and computer graphics to convert data into graphics or images and display them on the screen,and also can carry out interactive processing[4]. Big data of digital image involves many fields such as computer vision,computer graphics,computer aided,and image processing. It has become a technology to data research,data processing,decision analysis and so on[5]. The big data of digital image contains massive information,which are from many aspects and need to be effectively fused. The forms of information expression is varied,and the information processing of massive data has exceeded the scope or limit of human brain processing,so the information fusion technology arises at the historic moment[6],and there are some better ways to do it.
Based on the principle of row and column exchange of formal background,Jing and Song[7]proposed a representation method of attribute partial sequence diagram,which could optimize the formal background,draw a graph with a significant hierarchical structure,realize attribute clustering and fuse multi-level information hierarchical visualized. However,this method had the problem of low precision in data cleaning. Zhangetal.[8]proposed the use of visual method to fuse network security log and perceive network security situation. This method had great advantages in helping network analysts to perceive network security situation,identify anomalies,discover attack patterns,and remove misinformation. However,there were many problems of repeated data omission in this method[9]. Shietal.[10]proposed a multi-feature fusion method based on manifold learning,which realized the multi-feature fusion and the visualization of the pavement damaged images. However,this method had the problems of low precision of data cleaning and more data omission. In view of the existing problems,the multi-level information fusion method of big data in digital image is studies in this paper,so as to get accurate information and make effective emergency strategies in time.
1 Design of Multi-level Information Fusion Method for Big Data of Digital Image
Multi-level information hierarchical visualized fusion system for big data of digital image is an emergency decision support system in essence,which provides information service for rapid,efficient and high-quality emergency decision[11].
1.1 Linear regression collection of multi-level information
In the process of multi-level information fusion of big data in digital image,information collection is the key link of visual fusion. The accuracy and comprehensiveness of information is very important for the evaluation,decision and processing of digital image data[12]. The process of collecting the multi-level information of the big data in the digital image is shown as follows.
According to the specific application environment of the network,the performance indicators of storage space,processing ability of sensor nodes and performance indicators,we can select the nearestmdigital image data of sensor nodes within a certain time interval. Assuming which are (t1,y1), (t2,y2),…,(tm,ym),whereti,yi(i∈[1,m]) represent the sampling time points and the measured values affected by measuring error. For themsensing data,functionY(t) is constructed,to meet the approximation errorδi=Y(ti)-yithat is very small in the confidence interval of the acquired digital image data. The form of functionY(t) depends on the specific issue,andY(t) can be expressed as

(1)
wherenrepresents the number of items,Bjrepresents a specific basis function,andαjrepresents the selection coefficient,and they all depend on practical problems. Under normal circumstances,the basis function can be considered asBj(t)=tj-1,so Eq. (1) can be expressed asn-1 orders polynomial oft.
Y(t)=α1+α2t+α3t2+…αntn-1.
(2)
Selection ofn=mcan accurately calculate the corresponding value ofyi,but the computation of higher order functionYwill cause interference to data,and it will affect its accuracy when unforeseentpredicts its corresponding value ofy. A better approach is to select anvalue which is far less thanm,that is,n≪m,and the value of the selection coefficientαiis used to obtain the estimated value of the functionYcorresponding to the measured valuey. In wireless network applications,assuming that 50 values of the selected nodes are collected recently,to construct a three-order polynomial function model:Y(t)=α1+α2t+α3t2+α4t3,and estimate the measured valueyi(i=1,2,…,50),and the nodes do not need to transmit 50 actual measurement values. After building a function model,only four parameter values are needed to transmit in the network,which areα1,α2,α3andα4,as the compression representation of the measured values,thus reducing the amount of information in the network. Assuming that coefficients can be obtained based on a linear regression model,it is necessary to transform the polynomial representation model to matrix representation,so that the nodes do not have to solve higher order polynomial solutions,and only need to maintain correlation matrix. Assuming that then-dimensional vector of the calculated coefficient isα=(α1,α2,…,αn)T,them-dimensional vector of the actual measured value isy=(y1,y2,…,ym)T,and the base function matrix of the corresponding sampling time pointtiis as
(3)
where the matrix elementmij=Bj(ti),them-dimensional vectorY=[Y(t1),Y(t2),…,Y(tm)]Tof the predictive function at the sampling time pointtiin Eq. (1) can be expressed as
(4)
Then the approximation error vectorδcan be expressed asδ=α-y. In order to minimize the approximation error of the estimated valueδ,the objective function can be obtained by selecting the minimum norm of the approximation error vectorδas the optimization goal.

(5)
combiningδ=α-yand the optimized target function Eq. (5) can be obtained:
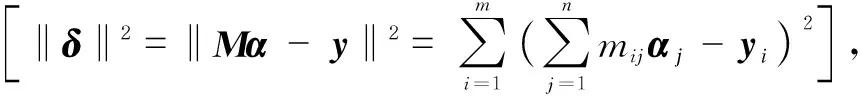
(6)
foradefinedbasisfunctionBj(t)=tj-1,thematrixofbasefunctionMis a full column rank matrix. For any full column rank matrixM,MTMis positive definite,so (MTM)-1exists. According toMTMα=MTy,the solution of coefficient vectorαcan be obtained as
α=(MTM)-1MTy,
(7)
According to the above,there isAα=z,whereAis the quantitative product matrix of the basis function,andzis the basis function projection of the measured value vector. Thus,the optimal regression coefficient can be obtained through the typical linear systemAα=zbased on the known measured value and base function.
Then the regression model parameter is updated. For the digital image data,with the increase of time,the amount of data is also increasing. Due to the energy,storage and processing capacity constraints of the sensor node itself,the node can only store the sampling image data within a certain period of time. When using linear regression model to calculate the coefficient of data representation,the update operation of model can use the following incremental calculation.
To sum up,nodes can extract regression coefficients by computing linear systemAα=z,and the matrix of linear regression model and vector parameters are updated incrementally. According to the reasonable sleep scheduling mechanism,the perception information of the nodes in the cluster environment acquisition system,the sampling data are transmitted to the cluster head node. Linear regression model is constructed in the cluster to estimate sampling data,and the model parameters expressing the characteristics of the data are uploaded to the base station according to the query statistics needs. The errors of the calculated data are compared with those of the actual data collected by the linear regression prediction model. If it is not beyond the set threshold,the regression model is not updated,and otherwise the parameter is recalculated. According to the above analyses,the process of digital image data collection can be expressed in Fig. 1.

Fig. 1 Schematic diagram of digital image data collection based on linear regression model
1.2 Improvement of multi-information cleaning of big data in digital image
In order to avoid data cleaning unaccuracy and repeated data omission in the process of information fusion,the ID tag as Transactin Identification (TID) of the collected data is compared. Assuming that the TID of two data are the same,they are the duplicated data. The detailed process is shown in Fig. 2.
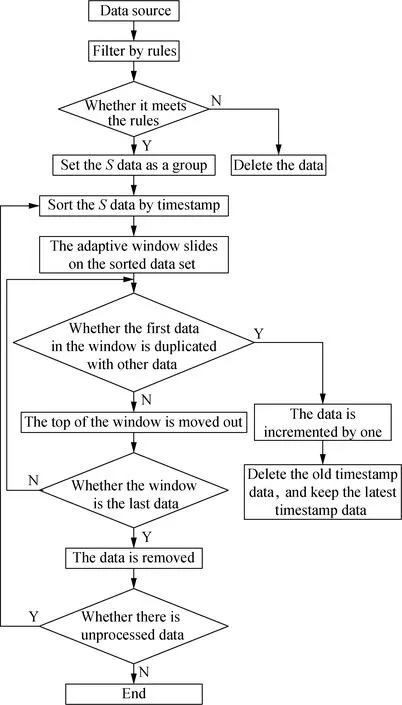
Fig. 2 Redundant data cleaning of digital image
In order to improve the detection speed of redundant data,the original process is improved and the data sets are grouped. After grouping,the data are sorted according to the timestamp. Because the same tag may be read by multiple readers at the same time,the redundant data of digital image can be arranged as close as possible in order to be detected. Each test has the same time,and the number of repetitions is 1. At the same time,because the scale of the redundant data stream of digital image is infinite,the new arrival data update can reflect the current situation better,so it only keeps the latest timestamp data and delete the old one. When all data are processed,the reader is sorted again to detect the data with same tag read by the same reader,and then it is executed according to the improved procedure of data processing.
Since in the redundant data processing method,the data only need to compare the TID in the image data,the collected data can be made segment detection through the analysis of the TID data format. The first segments of the two data are compared. If the first segments of data are different,they are the duplicate data,and the top data are directly moved out of window; if they are the same,the second segments of data are matched until all the segments of data are the same,then the data are recorded as duplicate data,the numbers of duplicate data are recorded,and the latest timestamp data are reserved. The data is segmented and then detected,which can reduce the unnecessary data matching process,improve the accuracy of data filtering and reduce the processing time.
For the sliding window,a fixed window is used to detect the data. The size of the window is determined by the experience of the industry experts and is usually not appropriate. The size of the window has an important impact on the efficiency of the redundant data processing method[13]. If the window is small,the operation speed will be fast,but the test results will not be ideal; if the window is too large,the detection effect is ideal,but the operation process will be very long. Therefore,the random factorRrandis introduced in this paper. The window can be adaptively changed between the largest and smallest window according to the change of random factors,of whichRrandis generated by random numbers between (0,1). Whenever the first data in a window are moved out,Rrandis a random change,and the size of the window changes. Supposing that the minimum value of window iswmin,the maximum value iswmax,the current window iswi,wherei∈(min,max),when each data are moved out,the window size is
wi=int[wmin+Rrand(wmax-wmin)] .
(8)
The size of the sliding window varies with the change ofRrand. When the number of random numbers generated byRrandis large,the window becomes larger; the window becomes smaller when the generated random number ofRrandis small. At the same time,the data set is circulated in this paper. That is,the data set after the detection is processed many times according to the above process to reduce the omission of repeated data.
1.3 Hierarchical visualized fusion of multi-level information
Visualization technology is an effective method to help users understand and analyze data. By transforming data into visualization form,data can be expressed intuitively in the form of view,which can facilitate further research of data. In this paper,the expression method of radar map is used to realize hierarchical visualization of information fusion[14-15]. Radar map is usually used for qualitative evaluation,and it is the most widely used multi-level data mapping method at present. Intuition is the main feature of radar map. A radar map has multiple axes,which can represent multi-dimensional data on a two-dimensional plane,so it is convenient to study the relationship between samples by using radar map.
The expression of radar map is that assuming the data to be analyzed has a total of variablesf,a circle is drawn,and the circumference is divided intofparts byfpoints; the center of circle andfpoints are connected,so as to getfradial radius,which are used as the axes of thefvariables. These values of each dimension of thef-dimensional data are carved on the corresponding axes,so as to connect them to get af-edge,and get thef-dimensional radar map represented by the plane. A hierarchical model based on radar map is shown in Fig. 3.
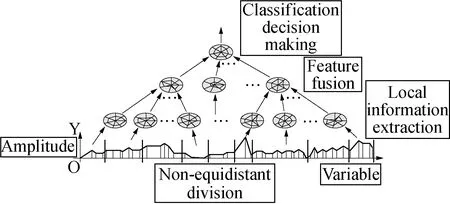
Fig. 3 Hierarchical model based on radar map
From the hierarchical model,we can see that this is a system model with coupling and hidden structure between parameters. Generally,the whole system can be divided into data input layer,multi-level information fusion hidden layer and result layer. The process of system information fusion is that the input terminals can have multiple input information from different sources. After normalizing the processing,the input information is mapped to result layer through multi-level fusion hidden layer processing. Given the corresponding points on the parallel axes,the multi-dimensional digital image data are converted into the input quantitative value according to a certain rule. Data points on parallel coordinate axes are input variables of visual classifier,and the input information of visual classifier can give a working mode of this system,and give the characteristic information of the system model.
Each line of radar map is also a coordinate axis,the scale in the axis is built in accordance with the numerical value of data type properties of each dimension data. Each record in the data set corresponds to a coordinate point on the axis of the line,and the coordinate points are connected by the line segment. A record of a data set is mapped with a closed broken line in a radar map,and a set of records corresponds to a set of folded lines. The radar map is shown in Fig. 4.

Fig. 4 Radar map
Pixel oriented technology is to map the value of each data item correspond to a color screen pixel,and the data value belonging to an attribute is represented in a separate window,as shown in Fig. 5.

Fig. 5 Visual window of pixels
Using the pixel visual window in Fig. 5,every multi-dimensional digital image data are mapped into an icon,which represent the attributes off-dimensional data represented by various parts of simple icons.
The reduction of the multidimensional digital image data can be described as: the high-dimensional data are actually located on a manifold with smaller dimensions than the data space,and the purpose of dimension reduction is to obtain a low dimensional coordinate of the manifold.
Assuming that the data to be processed isX=(x1,x2,…,xf),Xis non-equidistance segmentation to obtainlgroups of partitioned data which areX1,…,XI,XI+1,…,XJ,XJ+1,…,XP,XP+1…,XR,XR+1andXn. The partition multivariate diagram consisting of thelgroup of data is shown in Fig.6. The multivariate data in each district can be represented by the multivariate graph.
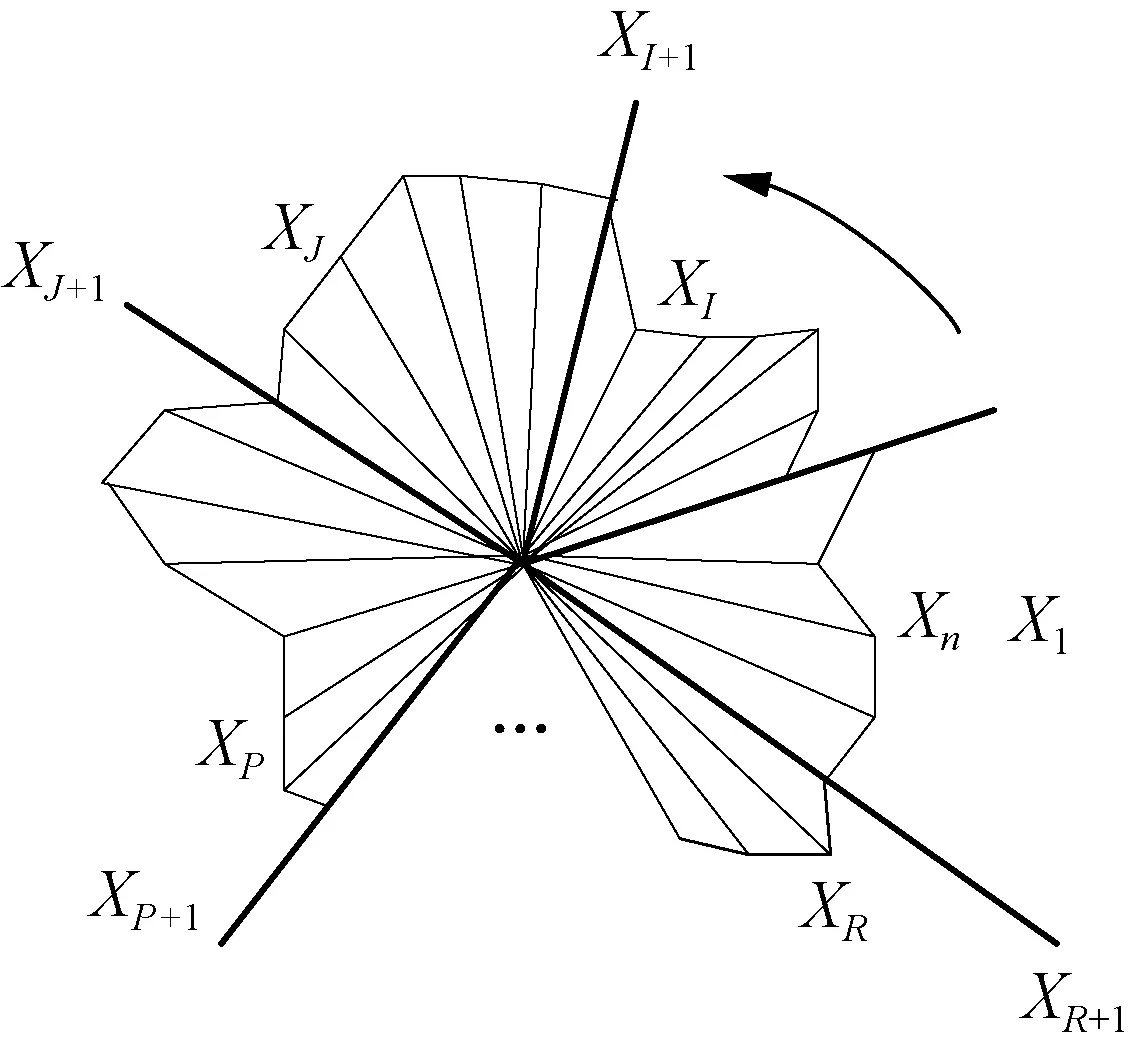
Fig. 6 Partition of radar map about high-dimensional data
Digital image data can be quickly fused after processing,and the principle is that the radar coordinate is mapped by preprocessing original data,the radar map can distribute different variables in different directions because of the different variables. Therefore,we can transform the radar coordinate into a rectangular coordinate of complex planes under keeping the radar map polygon unchanged,and each variable becomes a direction vector[16]. The processing ofl-edge can be converted to the processing oflvector,and the vector fusion method is used to deal with the variables. The vector radar map has the characteristics of asymmetry sensitivity due to the mutual cancellation of vector synthesis in 4 quadrants. The vector radar map has the characteristics of asymmetry sensitivity. That is,when the figure has high symmetry,the synthesized vector is closer to the center of the circle,and which is not conducive to category representation[17]. In order to solve this problem,a method of weighting the fusion vector by using the area of radar map as a tag is proposed. In the process of fusion,the status of input information is not equal,and the proportion of information is different in the whole. Each input information is mapped to a radar map based on different weights.
(9)
whereg=1,2,…,l,rgrepresents thegth information variables,bmaxrepresents the maximum value of variables,andbgrepresentsgth variable information values,the points of corresponding to the radar map. The results of data fusion are
(10)
whereφrepresents a variable in the process of information fusion.
2 Experimental Results and Analyses
In order to better verify the feasibility of the proposed method,the experimental data in this paper are a set of 8-lead EEG data. The sample is a high-dimensional vector,including 300 samples,120 healthy samples and 180 unhealthy samples. The hardware environment of this experiment is that the AMD is Athlon X2 CPU of 1.05 GHz,the main memory of 2 GB,and the capacity of the hard disk is 250 G. The operating system is Windows XP.
The feature curves of the obtained data in the healthy group and the unhealthy group are shown in Fig. 7.

(a) Data in healthy group

(b) Data in unhealthy group
The following data are cleaned and the feature curves of the cleaned data are shown in Fig. 8.
From Fig. 8,it can be seen that the density of the curves after cleaning is weakened,the redundant data are obviously cleared,and the omission of repeated data is reduced. The radar maps of the two sets of data are shown in Fig. 9.
In the above radar maps,the maximum value of the data is selected as a feature and the feature is placed in the new radar map. These new radar maps can represent the fusion result of the whole data.

(a) Unhealthy group after data cleaning

(b) Healthy group after data cleaning
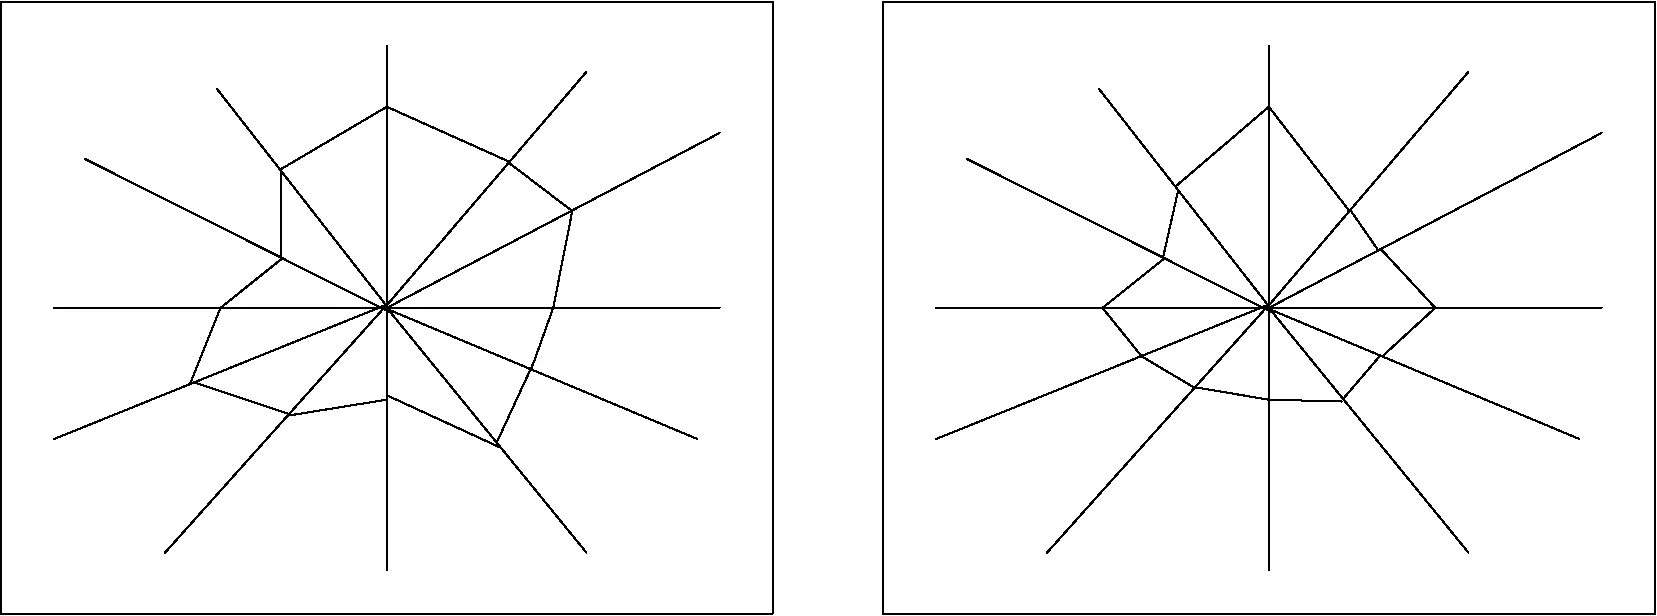
(a) Unhealthy group

(b) Healthy group
Through the analysis of the TID data format,the collected data are detected in sections,and the data set is reprocessed and circulated,that is,the data set after the detection is processed many times according to the procedure. Because of dimensionality reduction of high-dimensional data,the hierarchical visualization of information is realized by the expression of radar map. After the radar coordinate system is mapped by the original processing data,different variables are allocated in different directions of radar map. Therefore,it can transform the radar coordinate system into a rectangular coordinate system of complex planes,under keeping the polygon of radar map unchanged,so that all variables become directional vectors. The vector fusion method is used to fuse the variables,and the fusion results are shown in Fig. 10.

(a) Unhealthy group
3 Conclusions
In this paper,the multi-level information of big data in digital image is fused and processed using the radar map,and the visualization and superiority of visual information fusion is expounded. The feasibility of the proposed method is proved by the experiments,and the following aspects can be studied in the future.
(1) Hierarchical visualized multi-level data should be carried out using multi-directional filtering and de-noising.
(2) The visualization of data should be further improved.
(3) In order to make the experimental results more close to the actual fusion results,the fusion process should be systematized.
 Journal of Donghua University(English Edition)2020年3期
- Journal of Donghua University(English Edition)的其它文章
- Recent Progress for Gallium-Based Liquid Metal in Smart Wearable Textiles
- Accident Analysis and Emergency Response Effect Research of the Deep Foundation Pit in Taiyuan Metro
- Effect of Elastane on Physical Properties of 1×1 Knit Rib Fabrics
- Knowledge Graph Extension Based on Crowdsourcing in Textile and Clothing Field
- Analysis on the Application of Image Processing Technology in Clothing Pattern Recognition
- Clothes Keypoints Detection with Cascaded Pyramid Network