
Endogenous motion of liver correlates to the severity of portal hypertension
2020-12-10 04:08SigitaGelmanAndriusSakalauskasRomanasZykusAndriusPranculisRytisJurkonisIrmaKuliavieneArunasLukoSeviciusLimasKupcinskasJuozasKupcinskas
World Journal of Gastroenterology 2020年38期
Sigita Gelman, Andrius Sakalauskas, Romanas Zykus, Andrius Pranculis, Rytis Jurkonis, Irma Kuliaviene Arunas LukoSevicius, Limas Kupcinskas, Juozas Kupcinskas
Abstract
Key Words: Portal hypertension; Endogenous motion; Strain elastography; Hepatic venous pressure gradient; Radiofrequency parameters
INTRODUCTION
The burden of chronic liver diseases is growing and decompensated liver cirrhosis is responsible for a million of deaths per year worldwide[1]. The grade of portal hypertension (PH) expressed by hepatic venous pressure gradient (HVPG) is an important prognostic factor for the decompensation of liver cirrhosis and formation of life threatening complications, such as ascites, gastroesophageal varices and hepatic encephalopathy[2,3]. HVPG value greater than 5 mmHg is considered to be PH. Clinically significant PH (CSPH) is diagnosed when HVPG values exceed 10 mmHg and is associated with the formation of gastroesophageal varices, ascites and hepatorenal syndrome. When HVPG values exceed 12 mmHg severe PH (SPH) is diagnosed with higher risk of variceal bleeding and decompensation. Thus the evaluation of the presence of CSPH and SPH are of utmost importance[4,5].Direct measurement of HVPG is regarded as the most accurate method for the assessment of PH, however this procedure is currently reserved for specialized centers, as it is invasive, costly and requires expertise[2,6].
Ultrasound elastography is one of the most widely used non-invasive alternatives for the diagnosis of PH. The method is appealing due to its low cost, applicability and availability[4,7]. Several ultrasound elastography techniques have been developed: Strain imaging [strain elastography (SE), using internal/external compression stimuli, or acoustic radiation force impulse] and shear wave imaging [point shear wave elastography (pSWE), 2D-SWE and transient elastography (TE)][8,9]. Out of existing ultrasound elastography techniques TE, using Fibroscan (Echosens, France), has shown most promising results in diagnosing CSPH with area under the receiver operating characteristic curve (AUROC) of 0.90, sensitivity 87% and specificity 85%, whereas other shear wave techniques showed lower sensitivity in this field[10-12]. The readings of TE, pSWE and 2D-SWE are affected by active inflammation, cholestasis, fatty liver and biliary obstruction thus TE performance is not optimal in patients with obesity, ascites, narrow intercostal space. These limitations encourage the search for another alternative technique that could be applied in this diverse patient population.
SE is an ultrasound elastography technique widely used for the examination of musculoskeletal system[13], breast and thyroid pathologies[14], however it has been scarcely evaluated in the setting of liver cirrhosis and PH. SE measures axial displacement of tissue caused by manual compression or physiological shifts inside the body (cardiovascular pulsatility or breathing)[15,16]. Elasticity is displayed as color coded elastograms: Areas with lower strain are displayed in blue and areas with higher strain in red[11,15]. The drawback of this technique is that it measures the strain of tissues and the resulting elastogram is not quantifiable[16]. To obtain more accurate and reproducible results various semi-quantitative methods have been developed[15]. Different scores for semi-quantitative interpretation of SE have been proposed: The German Elasticity Score, the Japanese Elasticity Score, the LF Index, calculation of strain[9,17]. Other research groups develop and apply specific algorithms for quantitative evaluation of elasticity using a number of statistical parameters, derived from the distribution of recorded strains within a region of interest (ROI). The key parameters are: Mean strain, standard deviation of the mean; the percentage of blue area; complexity of the blue areas[18-23]. One advantage of this technique is the ability to evaluate the inhomogeneity of strain in larger areas of the liver[24,25]. Also, what is more important, SE readings are not affected by hepatic inflammation, jaundice, liver congestion, fatty degeneration, obesity, ascites or narrow intercostal spaces as is the case with other elastography modalities[15,26-28].
Studies concerning SE performance in PH are scarce. Ochiet al[29]reported that SE was useful for the diagnosis of PH in patients with non-alcoholic liver disease. Hirookaet al[30]evaluated SE performance in CSPH and SPH using elastic ratio. In their study AUROC for the diagnosis of CSPH was 0.83 and for the diagnosis of SPH – 0.78.
根据人才培养方案及课程标准,希望学生通过本课程学习,能够正确认识舰艇环境因素与人体健康的关系,进一步强化预防为主的理念,了解海军卫生学在海军建设中的重要作用,树立卫生学是维护和提高部队作战(作业)能力的重要保障这一专业信念,掌握发现和解决部队平战时各种卫生学问题必需的基础知识及技能,为今后从事军事医学各个领域的工作,尤其是开展海军卫生学工作打下良好基础。
Our group has applied SE technique to assess the strain of liver tissue caused by endogenous motion of the beating heart and developed a specific radiofrequency (RF) signal analysis algorithm to calculate the parameters for quantification of strain in liver tissue. We have previously applied this RF ultrasound-based tissue strain imaging method to characterize tissue elasticityin vitro[31]and demonstrated the feasibility of this method in diagnosing liver fibrosis in patients with hepatitis C virus[32]. The aim of present study was to evaluate the ability and feasibility of endogenously induced displacements and strain on the liver to assess the degree of PH, using this specifically developed RF signal analysis algorithm.
MATERIALS AND METHODS
Patients
Patients with hepatitis C virus and/or alcohol induced liver cirrhosis, hospitalized for the HVPG measurement procedure to the Hospital of Lithuanian University of Health Sciences, Department of Gastroenterology were included in this study. Exclusion criteria were: Pre- or post-hepatic causes of PH, cardiovascular disease, current use of beta-blockers or other vasoactive drugs, presence of ascites. Demographic data, medical history, aethiology of liver disease and HVPG values were recorded. The diagnosis of liver cirrhosis was based on clinical, laboratory and radiologic data and/or histology.
The study was approved by Kaunas Region Biomedical Research Ethics Committee (2015-08-24, No. BE-2-28, Kaunas, Lithuania) and a written informed consent to participate in the study was acquired from all participants.
Ultrasound scanning
We collected data using ultrasound scanner Ultrasonix Sonix Touch (Analogic Ultrasound, Canada), which allows to collect raw RF signals of all scanning lines. The ultrasound scanning was performed on the day of HVPG measurement prior to the procedure. Scanning protocol and the main RF data acquisition parameters were described in previous paper[32].
HVPG measurement
Invasive HVPG measurement procedure was used to assess the degree of PH. The procedure was performed according to standard as described by previous authors[33]. Portal pressure was considered to be normal for HVPG values of 1-5 mmHg. When HVPG values exceeded 6 mmHg, PH was diagnosed. HVPG values of ≥ 10 mmHg represented clinically significant and ≥ 12 mmHg – SPH.
RF signal processing
Endogenous motion of the liver was characterized by derived parameters of region average tissue displacement signal and results of endogenous tissue strain imaging.
Displacement estimation
The displacements along the scanning beam line were estimated applying crosscorrelation based technique. The signals were interpolated before calculation of crosscorrelation. Length of the correlation window was set to 6 wavelengths and the overlap was 50%. The detailed description of the method could be found in previous publication[32]. The sequences of displacement images were obtained as a result of the displacement estimation stage.
Displacement parameters
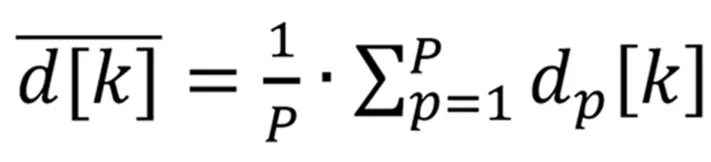
The user predefined regions of interest (ROI) in all images of displacements were averaged in space, thus obtaining the region average liver tissue displacement signal. The average displacement signal could be expressed as follows:
Formula 1 wherep= 1…P,P– number of displacement data points in a ROI of a subsector,dp[k] – displacement signal atp-th spatial position in a ROI,k= 1…K,K– acquisition instance (frame number).
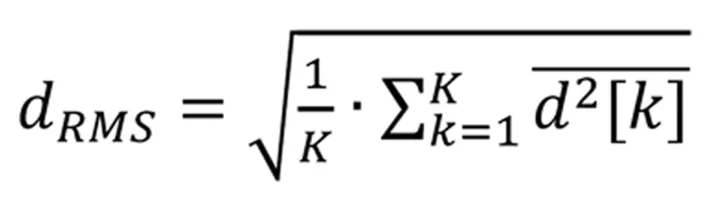
Afterwards, the motion of the liver was characterized by three parameters of the region average tissue displacement signal (assessment example is presented in Figure 1A): (1) Maximal amplitude of motion towards the ultrasonic probedantero; (2) Maximal amplitude of motion backwards from the ultrasonic probedretro; and (3) Average level of motion by root-mean-squaredRMSvalue:
(3)打入管钉。首先做好孔位标记,采用土层锚杆钻机钻孔,然后顶入管钉,水平管间距为1000mm,沿坡面排距为1400mm。
Formula 2 wherek= 1…K,K– acquisition instance (frame number).
Strain parameters
The endogenous strain map was derived from the temporal sequence of the displacement images. The strain maps were obtained taking the gradient of integrated spectral coefficient. An example of derived strain map is presented in Figure 1B. The description of data processing methods used for parametric imaging of endogenous strain was presented in detail in previous study[32].
The local quantitative assessment of the strain was performed by analyzing the distribution of derived strain map values in user prede ned rectangular ROI of constant size (see assessment example in Figure 1B). The investigation was performed in 2 frequency subbands (integration ranges for lowerf1andf2frequencies 0-10 Hz and higher 10-20 Hz, respectively) and 2 sizes of ROI (1 cm × 1 cm and 2 cm × 2 cm). The ROI selection criteria were based on visual evaluation of B scans and the obtained endogenous strain maps. At first, the sequences of B mode images were carefully revised with the aim to identify appropriate regions. The regions that contained only liver parenchyma without clearly visible blood vessels in B scans were outlined by the observer in the spatially corresponding images of endogenous strain.
All 11 investigated parameters of endogenous motion of liver together with a description are provided in Table 1.
Statistical analysis
Statistical analysis was performed using SPSS 25.0 and Medcalc softwares. Kolmogorov–Smirnov test was used to check data normality. Descriptive statistics are provided as median and range for non-parametric data. Patients were divided into groups according to HVPG values: (1) Patients without CSPH (HVPG < 10 mmHg); (2)Patients with CSPH (HVPG ≥ 10 mmHg); (3) Patients without SPH (HVPG < 12 mmHg); and (4) Patients with SPH (HVPG ≥ 12 mmHg). Differences between the groups were evaluated using the Mann-Whitney’s test. Correlations were performed using Spearman’s correlation and expressed by Spearman’s coefficient. ROC curves were created to assess the predictive values of RF parameters for the degree of PH. AUC, sensitivity, specificity, positive predictive value (PPV) and negative predictive value (NPV) were calculated. The cut-off value according to Youden’s index was chosen for the analysis of RF parameters. Statistical significance was established atP< 0.05.
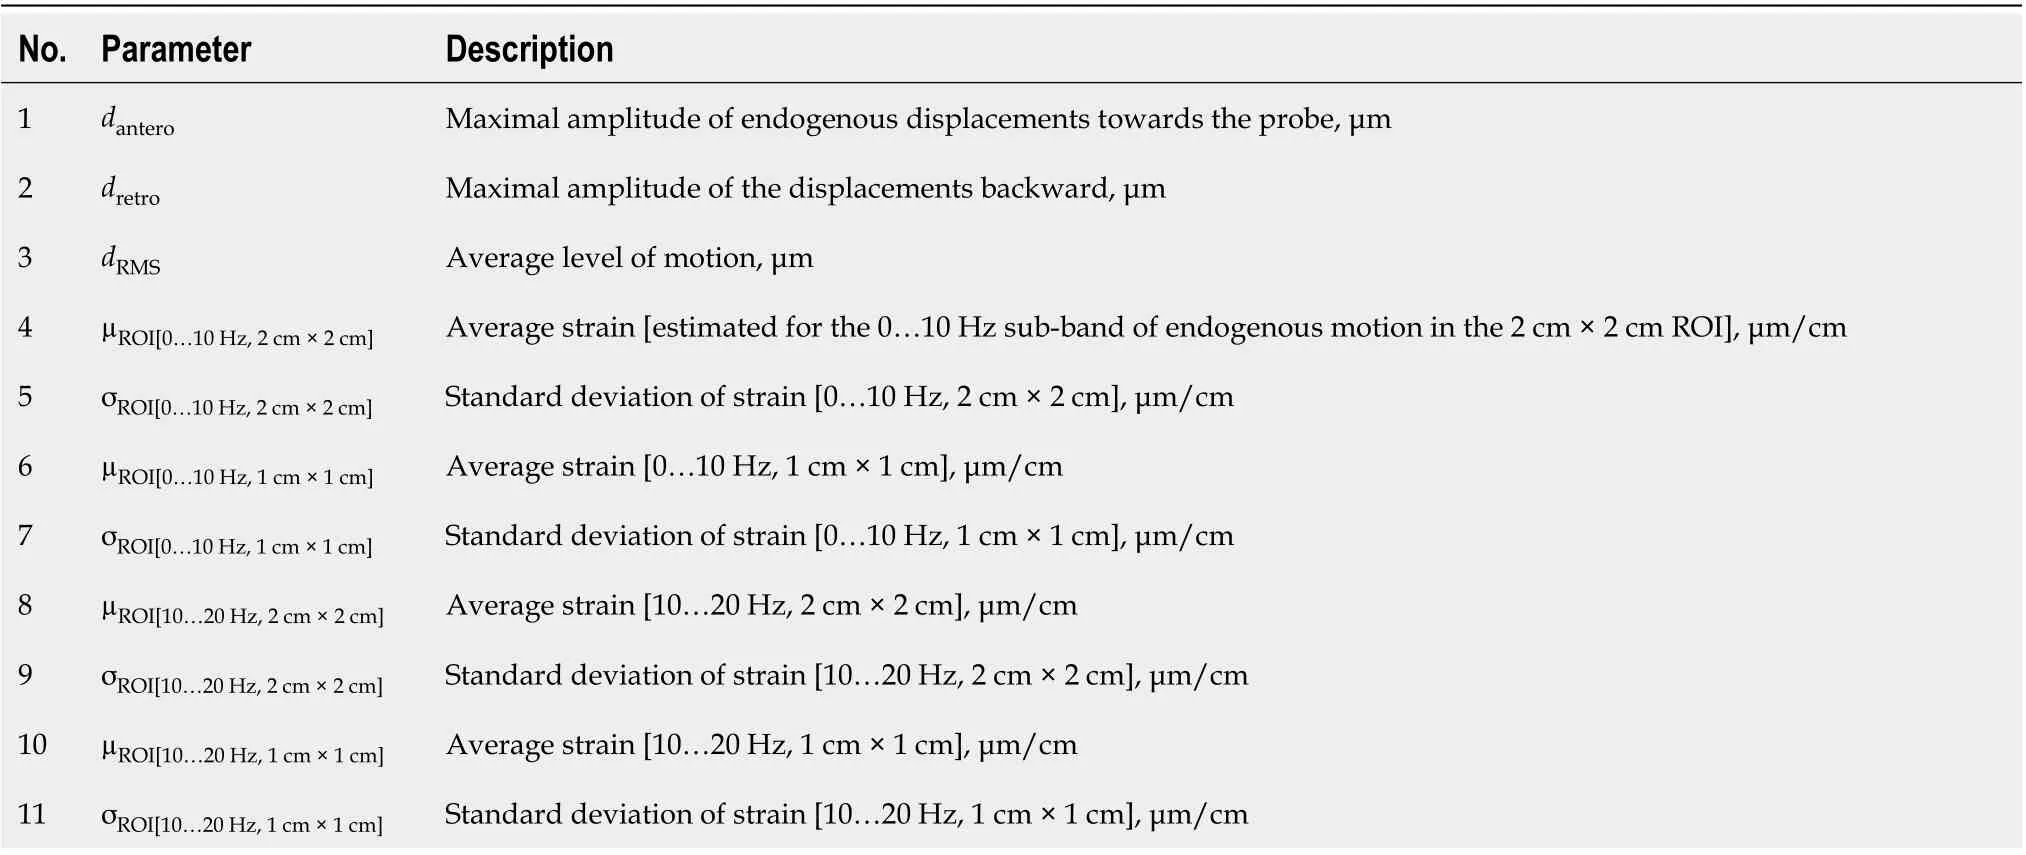
Table 1 Investigated endogenous motion parameters
Formula 1
RESULTS
Of 36 patients were included in the study. Mean age (± SD) of the subjects was 54.25 ± 8.82; 58.3% were male. Hepatitis C induced liver cirrhosis was diagnosed in 63.9% of cases. The summary of the demographic data is presented in Table 2.
We determined the correlation between the investigated strain parameters and invasive HPVG measurement. Spearman’s correlation coefficient (ρ) values andPvalue for the assessment of statistical significance are presented in Table 3. Four parameters showed statistically significant (P< 0.05) correlation with HVPG measurement. The strongest correlation was obtained for the standard deviation of strain (estimated at 0-10 Hz integration range and 2 cm × 2 cm ROI size). The directions of correlations met the expectation in almost all the cases. Negative correlation confirmed that the derived strain estimates decreased with an increment of HVPG.
In the next stage we investigated the ability of these four parameters to evaluate CSPH (HVPG ≥ 10 mmHg) and SPH (HVPG ≥ 12 mmHg). The results are presented in boxplots as median and interquartile ranges (Figure 2 and 3). Three parameters (No. 2, 5, 6; Table 1) showed statistically significant differences between the groups.
According to ROC analysisdretroparameter had an AUC of 0.86 (P= 0.0001) for the diagnosis of CSPH and 0.84 (P= 0.0001) for the diagnosis of SPH. A cut-off value of -132.34 μm yielded 100% sensitivity for both conditions, whereas specificity was 80% and 72% for CSPH and SPH respectively (Figure 4). AUC of theσROI[0…10Hz,2cm×2cm]parameter reached 0.71 (P= 0.036) for the diagnosis of CSPH; with a cut-off value of 1.28 μm/cm providing 73% sensitivity and 70% specificity. AUC for the diagnosis of CSPH forµROI[0…10Hz,1cm×1cm]was 0.78 (P= 0.0024); with a cut-off value of 3.92 μm/cm providing 73% sensitivity and 80% specificity (Figure 5). Data on specificity, sensitivity, PPV and NPV are presented in Table 4.
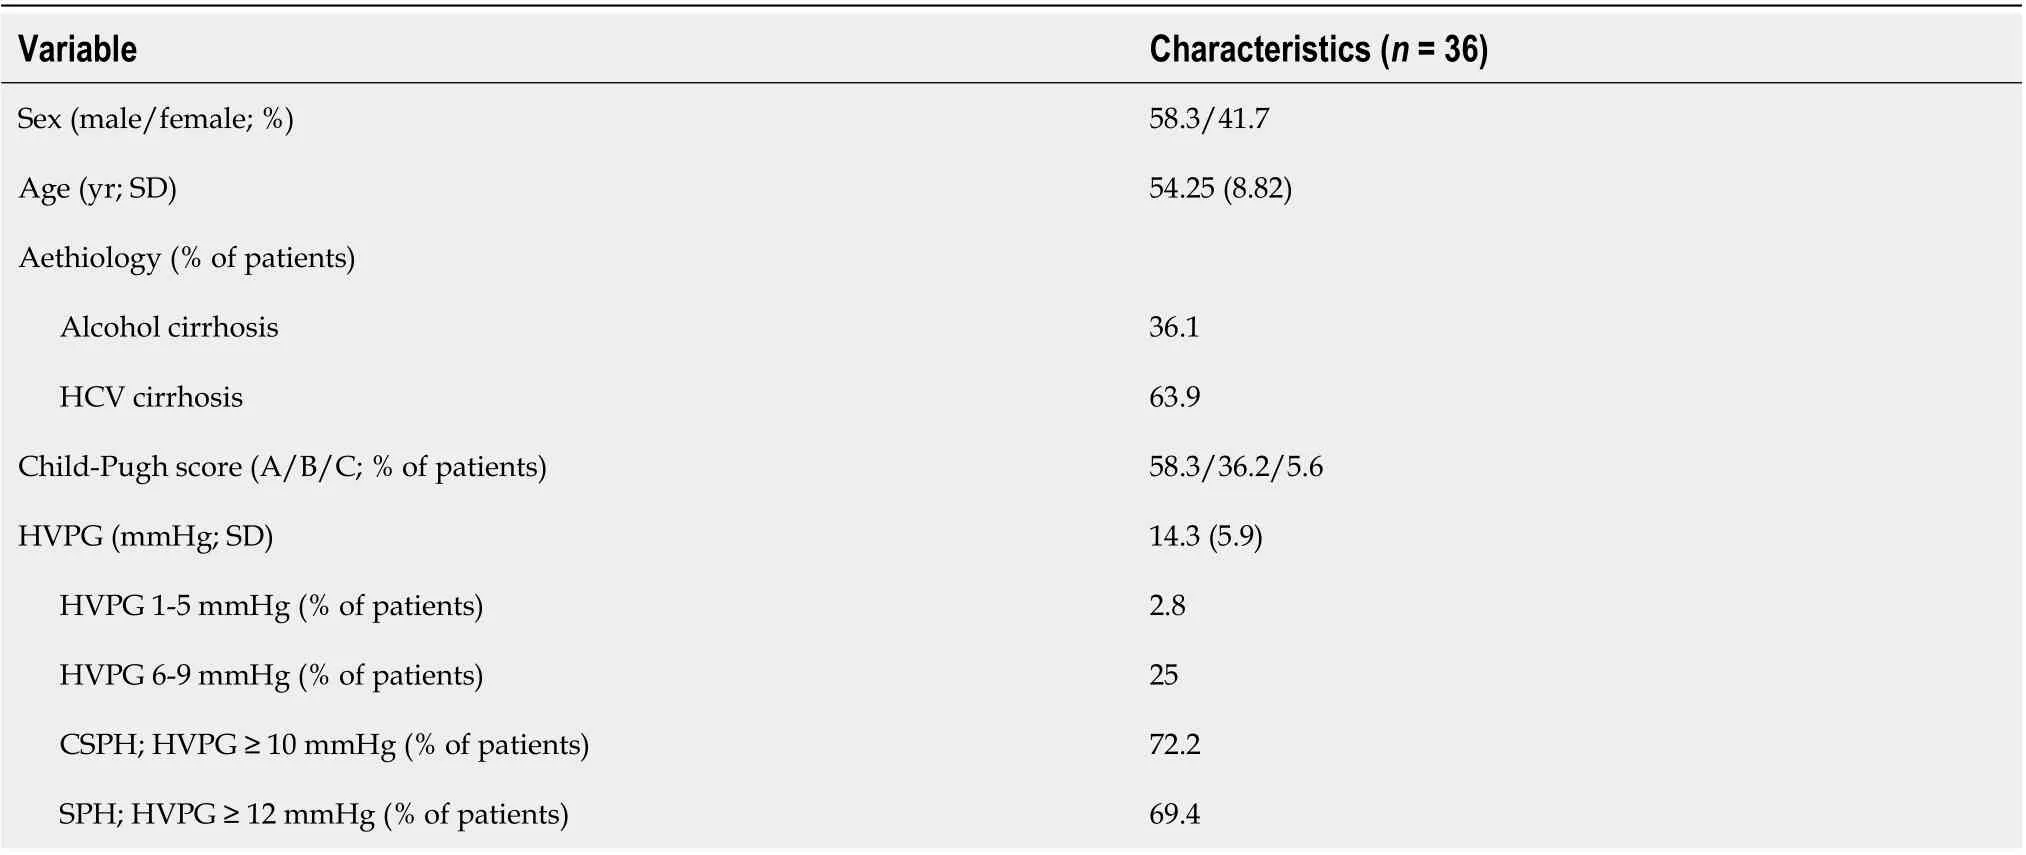
Table 2 Demographic and clinical data of the patients
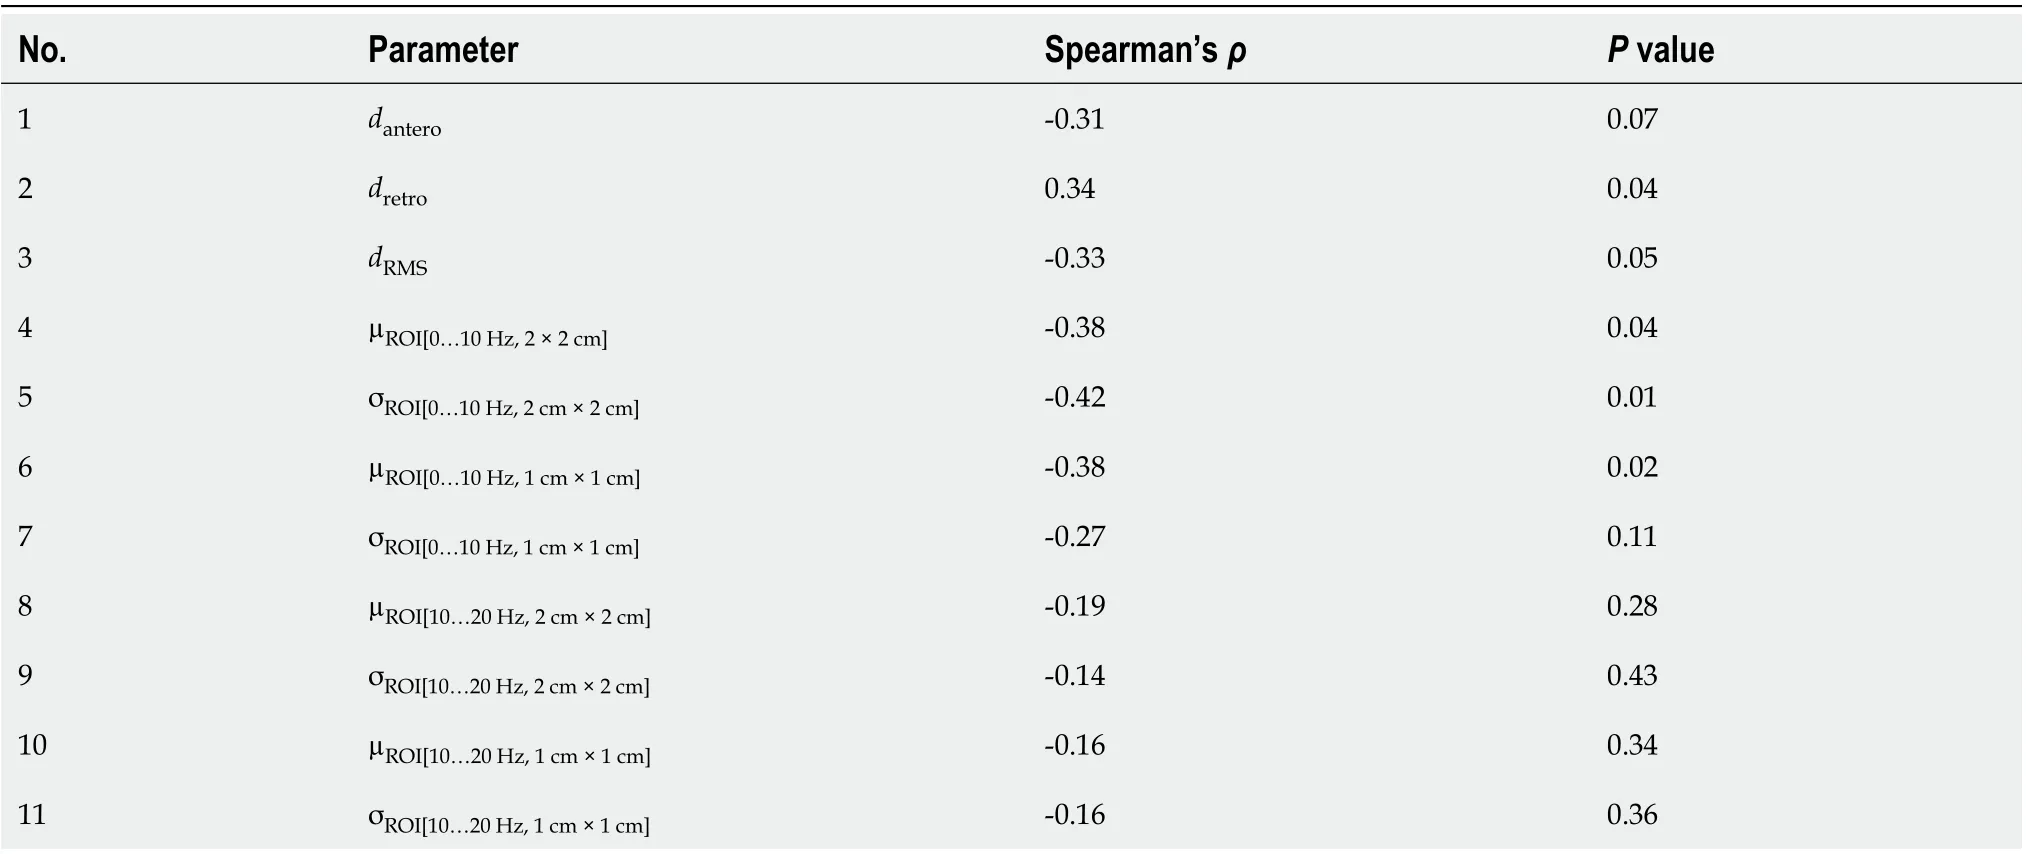
Table 3 Correlations between the investigated parameters and hepatic venous pressure gradient
DISCUSSION
Diagnosis of PH is currently based on the invasive procedure requiring high expertise; therefore, the need for an accurate non-invasive diagnostic test is growing. In this study for the non-invasive diagnosis of PH we applied a RF ultrasound-based tissue strain imaging method. We have shown that four out of 11 investigated parameters significantly correlated with HVPG and predicted CSPH and SPH. Thedretroparameter was a strong predictor of CSPH and SPH with sensitivity and NPV of 100%. Other authors have described similar performance in non–invasive diagnosis of CSPH of TE[34], whereas pSWE and 2D SWE methods were less sensitive (AUC 0.85 and 0.81respectively, sensitivity 71% and 85% respectively[35,36]).
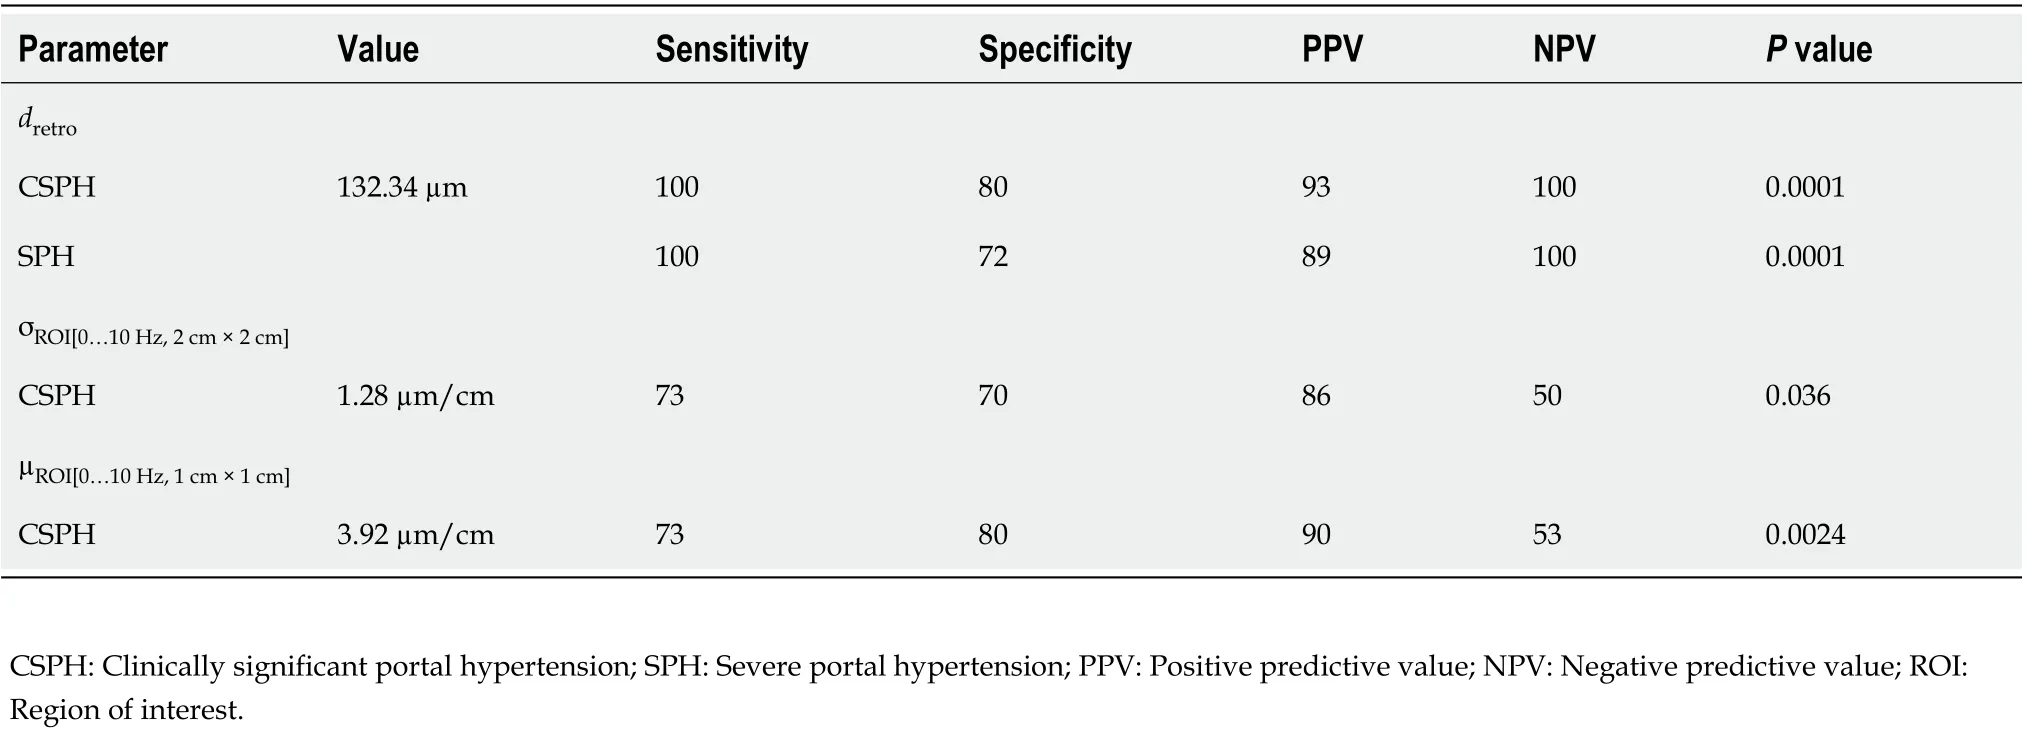
Table 4 Diagnostic performance of parameters for the diagnosis of portal hypertension
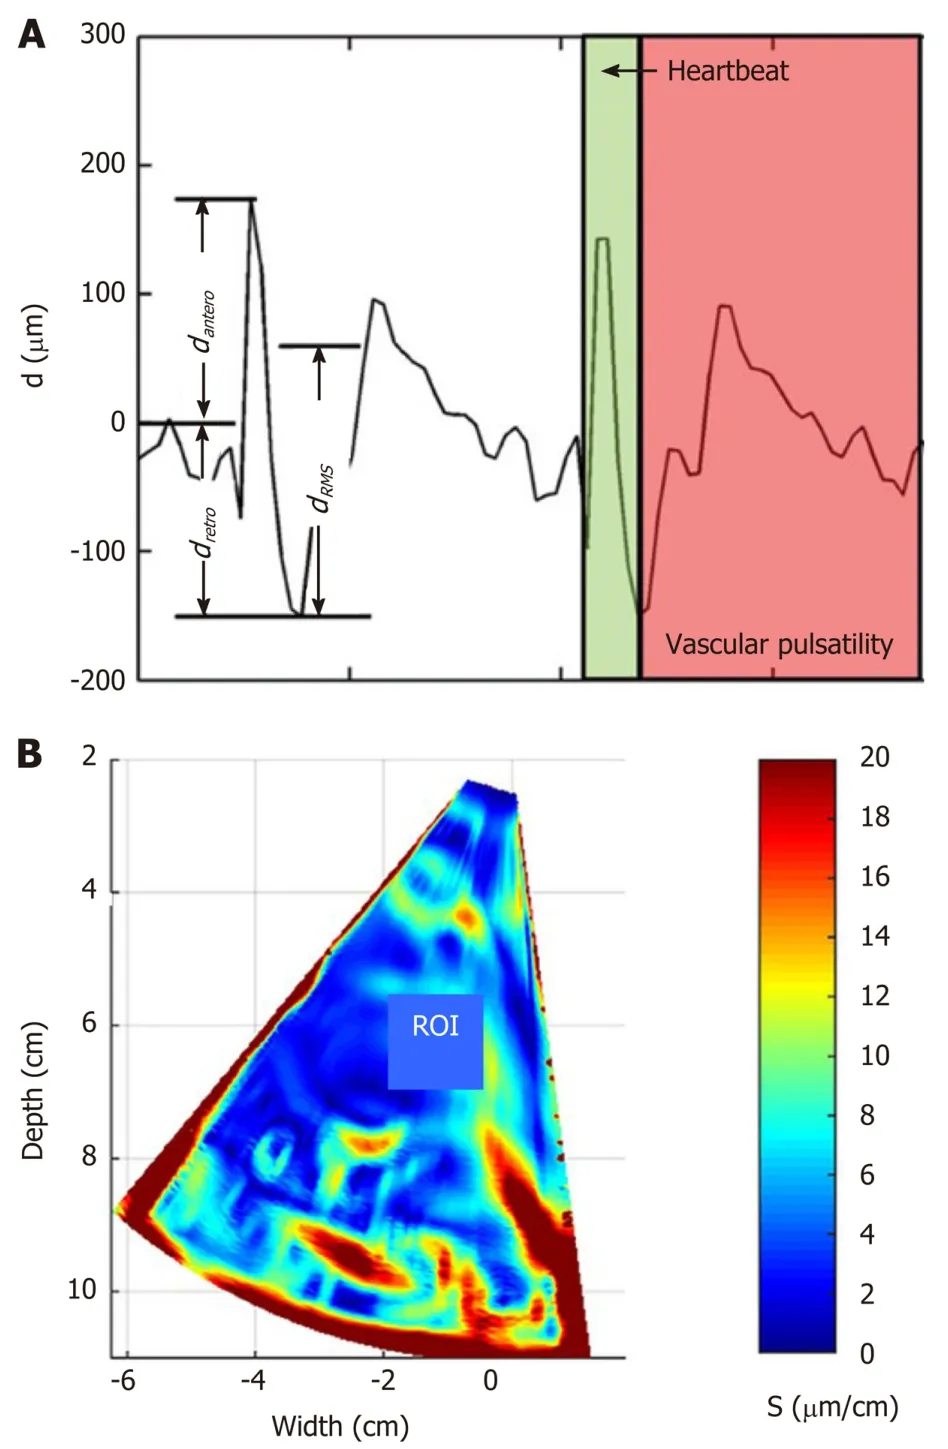
Figure 1 Example illustrating assessment of the endogenous liver displacements and strain. A: region averaged tissue displacement signal obtained in the subsector at time interval (2…3.8) s (three parameters of region averaged displacement signal dRMS, dantero and dretro were evaluated in this study); B: the obtained strain map [amplitude coded in (μm/cm)] together with regions of interest (red rectangle, size 1 cm × 1 cm) used for the local assessment of endogenous strain. ROI: Regions of interest.
The presented technique has certain limitations. It does not allow the evaluation of strain in real-time differently from commercial SE techniques and the strain parameters are calculated retrospectively, using recorded RF data. The other limitation of the approach is the detection of displacements field only in the direction of ultrasound wave propagation. Our method reveals the estimates of the displacements and strain only in single projection of endogenous motion, which is actually threedimensional. The second projection of motion could be estimated by updating the algorithm for two-dimensional detection, but sector shaped scan requires complicated computations.
Formula 2
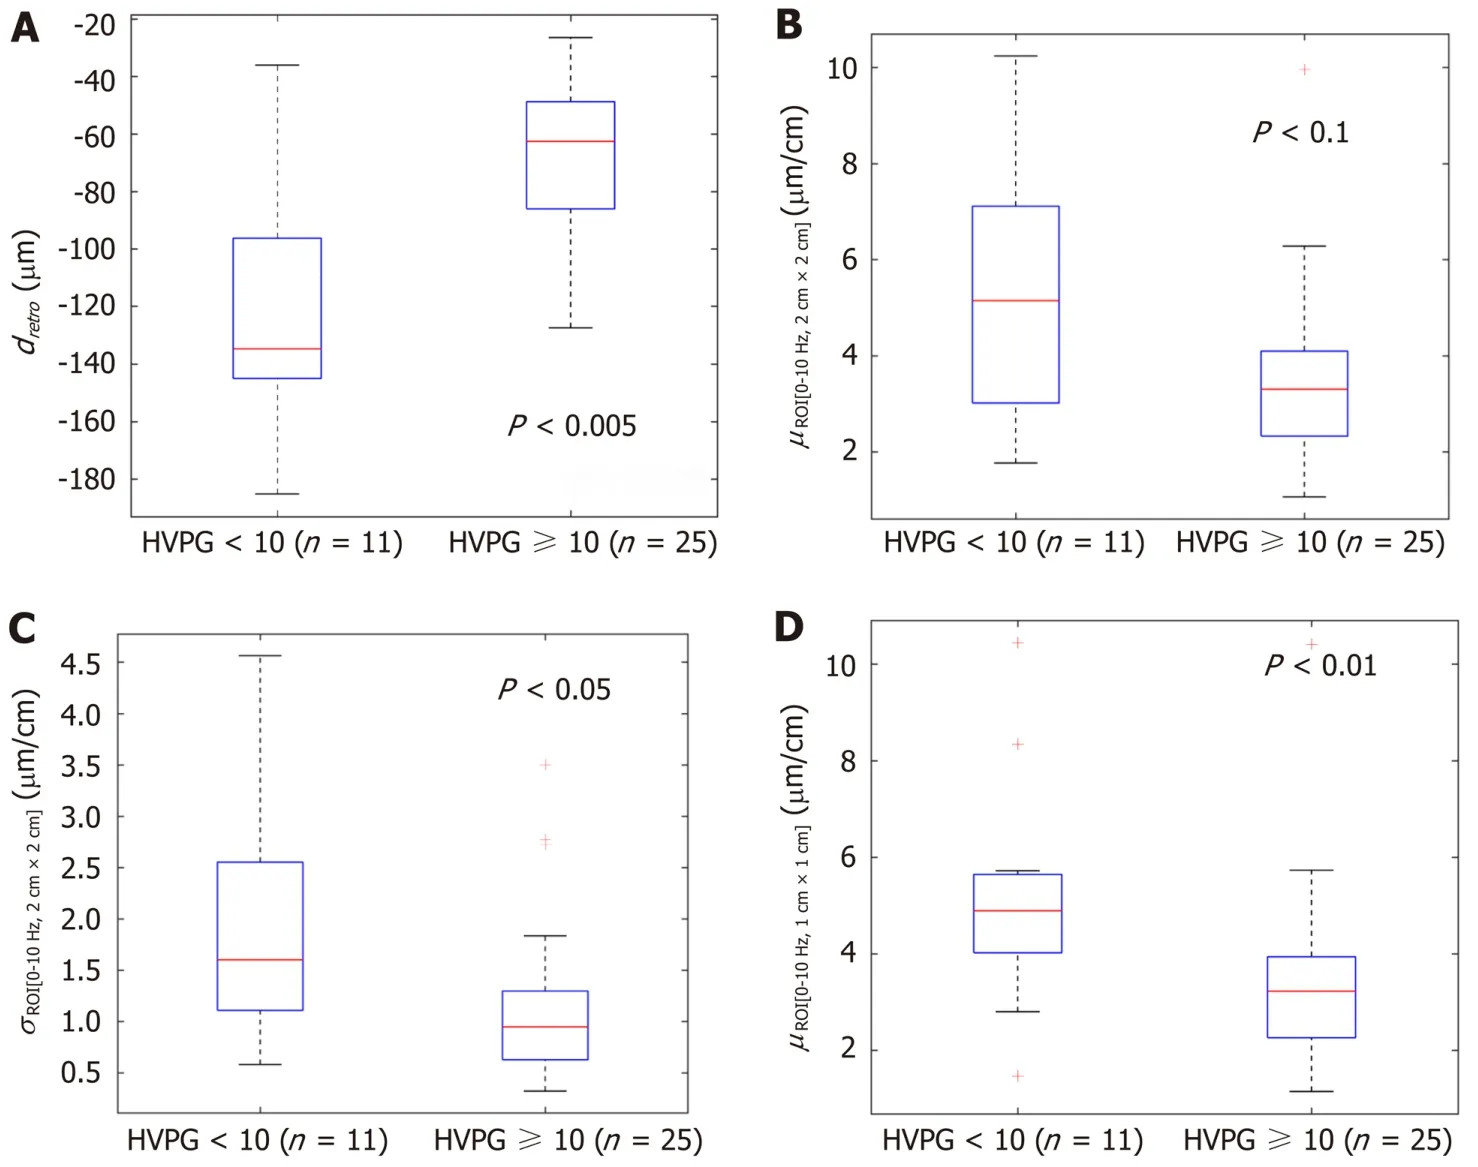
Figure 2 The boxplots and P values representing the derived parameters of endogenous displacements and strain in patients with and without clinically significant portal hypertension (≥ 10 mmHg). A: dretro; B: µROI[0…10Hz, 2 cm × 2 cm]; C: σROI[0…10Hz, 2 cm × 2 cm]; D: µROI[0…10Hz, 1 cm × 1 cm]. HVPG: Hepatic venous pressure gradient.
In this method we have used an undefined endogenous source for the tissue displacement excitation, which might influence quantified evaluation of liver elasticity. The endogenous motion also has a complex pattern which is composed from the very slow waves, induced by respiratory activity, a bit faster vascular pulsatility and relatively fast mechanical strain induced by the heartbeat and motion artefacts. However, the exact definition of motion inducing sources is beyond this study and will be investigated in future research. Other technical limitations of the method were disclosed in the previous study[32]. Also, despite the promising results, this was a pilot study and our results could be biased by the small size of our sample.
CONCLUSION
In conclusion, the parameters of endogenously induced displacements and strain of the liver significantly correlated with HVPG and could be a potential diagnostic tool for the non-invasive diagnosis of PH. A proposed method is potentially suitable for other applications of non-invasive diagnostics.
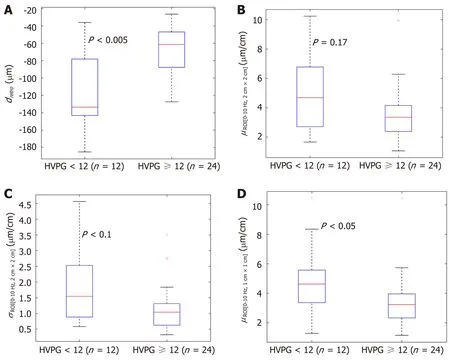
Figure 3 The boxplots and P values representing the derived parameters of endogenous displacements and strain in patients with and without severe portal hypertension (≥ 12 mmHg). A: dretro; B: µROI[0…10Hz, 2 cm × 2 cm]; C: σROI[0…10Hz, 2 cm × 2 cm]; D: µROI[0…10Hz, 1 cm × 1 cm]. HVPG: Hepatic venous pressure gradient.
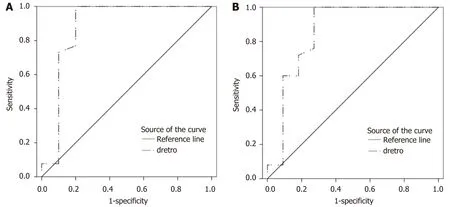
Figure 4 Receiver operating characteristic curves of dretro parameter for the diagnosis of portal hypertension. A: Receiver operating characteristic (ROC) curve for clinically significant portal hypertension [hepatic venous pressure gradient (HVPG) ≥ 10 mmHg]; B: ROC curve for severe portal hypertension (HVPG ≥ 12 mmHg).
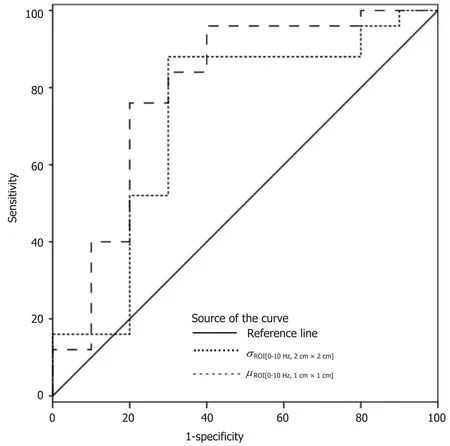
Figure 5 Receiver operating characteristic curves of σROI[0–10Hz, 2 cm × 2 cm] and µROI[0–10Hz, 1 cm × 1 cm] parameters for the diagnosis of clinically significant portal hypertension (hepatic venous pressure gradient ≥ 10 mmHg).
ARTICLE HIGHLIGHTS

Research results
Four parameters showed statistically significant (P< 0.05) correlation with HVPG measurement. The strongest correlation was obtained for the standard deviation of strain (estimated at 0-10 Hz and 2 cm × 2 cm ROI size). Three parameters showed statistically significant differences between patient groups with CSPH, but onlydretroshowed significant results in SPH analysis. According to ROC analysis area under the curve (AUC) of theσROI[0…10Hz,2cm×2cm]parameter reached 0.71 (P= 0.036) for the diagnosis of CSPH; with a cut-off value of 1.28 μm/cm providing 73% sensitivity and 70% specificity. AUC for the diagnosis of CSPH forµROI[0…10Hz,1cm×1cm]was 0.78 (P= 0.0024); with a cut-off value of 3.92 μm/cm providing 73% sensitivity and 80% specificity.Dretroparameter had an AUC of 0.86 (P= 0.0001) for the diagnosis of CSPH and 0.84 (P= 0.0001) for the diagnosis of SPH. A cut-off value of -132.34 μm yielded 100% sensitivity for both conditions, whereas specificity was 80% and 72% for CSPH and SPH respectively.
Research conclusions
The parameters of endogenously induced displacements and strain of the liver significantly correlated with HVPG. This shows that parameters of endogenous motion could be a potential diagnostic tool for the non-invasive diagnosis of PH. A proposed method is potentially suitable for other applications of non-invasive diagnostics.
Research perspectives
The presented technique has certain limitations. It does not allow the evaluation of strain in real-time differently from commercial SE techniques and the strain parameters are calculated retrospectively, using recorded RF data. The other limitation of the approach is the detection of displacements field only in the direction of ultrasound wave propagation. In this method we have used an undefined endogenous source for the tissue displacement excitation, which might influence quantified evaluation of liver elasticity. Also despite the promising results, this was a pilot study and our results could be biased by the small size of our sample. We are conducting further research of this method, which will include larger groups of patients, also allowing subgroup analysis of patients with ascites and obesity.
猜你喜欢
河南城建学院学报(2022年4期)2022-10-10
计算机测量与控制(2022年9期)2022-09-29
承德医学院学报(2022年2期)2022-05-23
科海故事博览·下旬刊(2022年4期)2022-05-07
人民珠江(2020年12期)2020-12-08
航空学报(2020年9期)2020-12-01
新商务周刊(2019年17期)2019-12-21
科教导刊(2018年28期)2018-01-04
中国教育技术装备(2016年19期)2016-12-27
科技视界(2016年26期)2016-12-17
 World Journal of Gastroenterology2020年38期
- World Journal of Gastroenterology的其它文章
- Role of betaine in liver disease-worth revisiting or has the die been cast?
- Management of an endoscopy center during the outbreak of COVID-19: Experience from West China Hospital
- Gastrointestinal complications after kidney transplantation
- Is vitamin D receptor a druggable target for non-alcoholic steatohepatitis?
- Acetyl-11-keto-β-boswellic acid inhibits proliferation and induces apoptosis of gastric cancer cells through the phosphatase and tensin homolog /Akt/ cyclooxygenase-2 signaling pathway
- Longitudinal decrease in platelet counts as a surrogate marker of liver fibrosis