利用固态核磁共振研究100LiO1/2-(100-x)PO5/2-xTeO2快离子导电玻璃的结构
2020-12-25 01:35张宗辉任进军胡丽丽
物理化学学报 2020年11期
张宗辉 ,任进军 ,*,胡丽丽 ,*
1中国科学院上海光学精密机械研究所,高功率激光单元技术实验室,上海 201800
2中国科学院大学,材料与光电研究中心,北京 100049
1 Introduction
Phosphate glasses have been widely applied in high power laser devices1-3, biological materials4-7, and fast ionic conducting glasses8,9. Phosphate ionic conducting glasses,which can be used in “all-solid-state” batteries, are attracting more attention. “All-solid-state” battery is considered to be a very important solution for next-generation rechargeable batteries due to the simple structure, high energy density, and great safety. The properties of phosphate ionic conducting glasses, as potential solid-state electrolyte or cathode materials,can be improved by incorporating various components due to the flexible compositions and admirable vitrification abilities10,11.For instance, a series of Na2O-FeO-P2O5glasses were evaluated as the cathodes for sodium-ion batteries, the conductivity increased with the increase of FeO and 30Na2O-40FeO-30P2O5glass exhibited high reversible discharge capacity as 115 mAh·g-1with a Na anode12. In the AgI-P2O5conducting glass system, the addition of tungsten oxide (WO3) can adjust the glass transition temperature, thermal expansion coefficient, refractive index, optical band edge, electrical conductivity, and improve considerably glass stability against water and humidity in the environment, which are important for drawing conductive fibers13,14.
The properties of fast ionic conducting glasses are strongly related to the glass network structures. The structure investigations can help to establish the connection between the glass structure and the composition. However, further structural investigations are rarely reported. With the help of mature vibration spectroscopy technologies, such as FTIR and Raman spectra, the structures of ionic conducting glasses can be analyzed. FTIR and Raman spectroscopy was used to study the structures of solid-state glass electrolytes with the compositions ofxLi2O-(1-x)[yB2O3-(1-y)P2O5], in which more P2O5could convert the [BO3] into [BO4] and reduce the Li+ion conductivity,while more B2O3could increase [BO3] thus increasing the Li+ion conductivity of glass electrolyte15.
Recent years, advanced solid-state nuclear magnetic resonance (SSNMR) spectroscopy technologies have shown outstanding advantages on probing the structures of vitreous materials, due to their flexible and powerful capabilities on detecting the glass networks within short- and medium-range16-20.The structures of AgI-AgPO3-Ag2WO4ionic conducting glasses were investigated using multiple SSNMR technologies, the successive conversion from P―O―P into P―O―W linkages were observed, and the Q(2)-like chain were broken into Q(1)and Q(0)species linked tungsten species and this structural transformation increased the glass rigidity and stability against hydrolysis reactions19.
In this work, the structures of the glasses with the compositions of 100LiO1/2-(100-x)PO5/2-xTeO2(x= 0, 10, 20,25, 30) are investigated using Ramanspectroscopy and multiple SSNMR technologies. The evolution of phosphorus species is tracked using31P MAS NMR and Raman spectra. The connectivities between phosphorus species are identified by 2D refocused INADEQUATE spectra.125Te WURST-QCPMG experiments are employed to probing the local chemical environments of Te atoms. The correlations between different structure units are discussed based on a random distribution model. Summarized from all discussions, a comprehensive depiction of glass networks is presented.
2 Experimental
2.1 Sample preparation and characterization
All these glass samples with the compositions of 100LiO1/2-(100-x)PO5/2-xTeO2(x= 0, 10, 20, 25, 30) were prepared from LiPO3(99.9%), Li2CO3(99.9%) and TeO2(99.99%). These raw materials were weighed according to the compositions with a total weight of 5 g, and then mixed in a platinum crucible. All these glasses were melted at 800 °C for 20 min and then the melts were cast on a preheated stainless-steel mold. These glass samples are labeled as 0Te, 10Te, 20Te, 25Te and 30Te forx=0, 10, 20, 25, 30, respectively. The differential scanning calorimetry (DSC) curves were obtained using a METTLER TOLEDO TGA/DSC-1600 differential scanning calorimeter.During these measurements, glass samples were heated under N2atmosphere with a heating rate of 10 K·min-1. Raman spectra were obtained by a Renishaw inviaRaman microscope with an excitation wavelength of 488 nm.
2.2 Solid-state NMR experiments
In this work, all NMR measurements were operated on a Bruker Avance III HD 500 MHz spectrometer (11.7 T). All31P single pulse MAS NMR spectra were obtained at 202.5 MHz using a 4 mm probe with experimental conditions as followed:the spinning rate is 12 kHz, the length of 90° pulse is 2.5 μs, the recycle delays are 320 s for all samples. And crystalline NH4H2PO4(chemical shift = 1.12 ppm) were employed to calibrate the chemical shifts of31P.
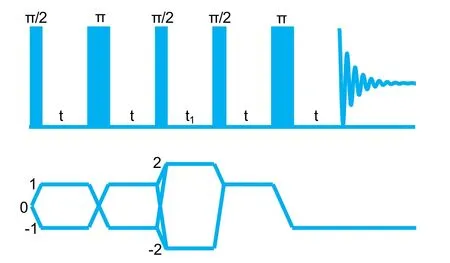
Fig. 1 The pulse scheme of refocused INADEQUATE and homologous coherence transfer pathway.
To identify different31P spices and obtain the correlations between these31P species, two-dimensional (2D) refocused INADEQUATE experiments were adopted, in which the31P species involved in P―O―P linkages can be detected by a double quantum (DQ) coherence process created based onJ-coupling effect through P―O―P bond, while the isolated31P species will be filtered out21,22. Fig. 1 shows the pulse scheme of the refocused INADEQUATE and homologous coherence transfer pathway. In 2D refocused INADEQUATE spectra, the F2 dimension and the F1 dimension show the regular one quantum coherence spectrum and double quantum coherence resonance frequency, respectively. The double quantum coherence resonance frequency in the F1 dimension equals the sum of their offset frequencies and autocorrelation peaks will appear at both sides of the diagonal. In this work, 2D refocused INADEQUATE experiments were done using a 2.5 mm probe with a spinning rate of 25 kHz. The length ofπ/2 pulse is 2.0 μs and the recycle delay is 60 s. The DQ filtered coherence was created using an excitation sequence of 90°-τ-180°-τ- 90°, and the mixing timeτwas optimized to be 3.32 ms.
The chemical environment of125Te nuclei was detected using the static wideband uniform-rate smooth truncation quadrupolar Carr-Purcell-Meiboom-Gill (WURST-QCPMG) technique23.The WURST-80 pulse shape was employed using an 8-step phase cycling. The pulses length of WURST excitation and refocusing were both 50 μs, and the excitation bandwidth was 700 kHz. To compensate the line shape distortions, which originate from transverse relaxation during the formation of frequency-dispersed echoes, the frequency was swept twice in two opposite directions and these two spectra after Fourier transformation were summed into a final spectrum23. The recycle delays were 100 s for all glass samples. The chemical shifts of125Te are calibrated by CdTe. All processing and deconvolutions of solid-state NMR spectra were done by DMFIT software package24.
3 Results
3.1 DSC curves and Raman spectra
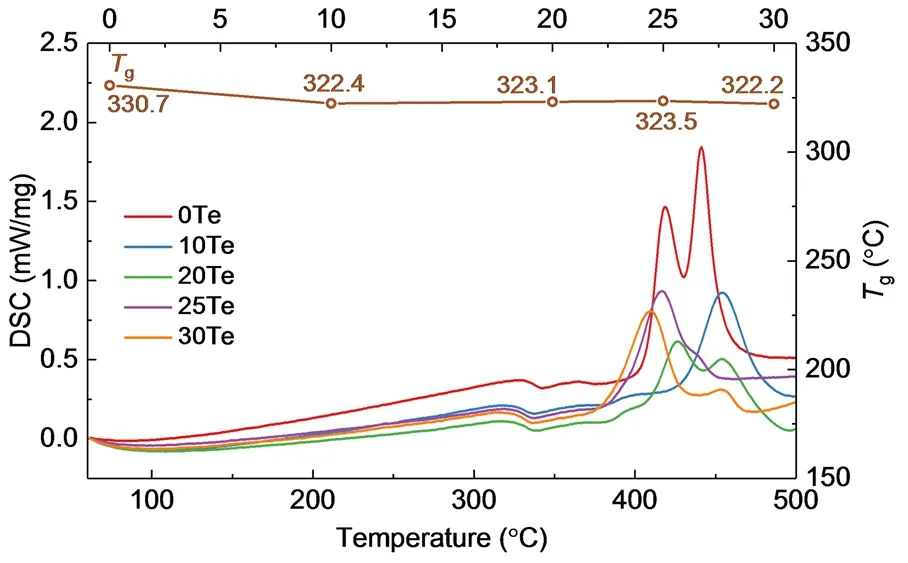
Fig. 2 The DSC curves of the glasses with the compositions of 100LiO1/2-(100-x)PO5/2-xTeO2. The line on the top is the Tg depended on composition (x).

Fig. 3 The Raman spectra of the glasses with the compositions of 100LiO1/2-(100-x)PO5/2-xTeO2. The vibration positions are marked by T1 [v(TeOTe)sym], T2 [v(TeO4)asym], T3 [v(TeO3)],P1 [v(POP)long-chain], P2 [v(POP)short-chain], P3 [v(PO3)sym],P4 [v(PO2)sym] and P5 [v(PO2)asym].
Fig. 2 shows the DSC curves of 100LiO1/2-(100-x)PO5/2-xTeO2(x= 0, 10, 20, 25, 30) glasses. The glass transition temperature (Tg) of these glasses is almost constant within a measurement error of 10 °C, which is due to the little change of bridging oxygen fractions in these glasses (as discussed below).Fig. 3 shows the Raman spectra of glass 0Te, 10Te, 20Te, 25Te and 30Te. The assignments of Raman vibration bands in this work refer to the previous literature25-30. In glass 0Te (i.e.LiPO3), all phosphorus species should be metaphosphate Q(2)0Tespecies, where the Q(n)mTerepresents the phosphorus species with n bridging oxygen atoms (the oxygen atoms in P―O―P and P―O―Te linkages are both considered to be bridging oxygen atoms) and m Te atoms are connected to this [PO4] tetrahedron.The band at 1175 cm-1corresponds to the symmetric stretching vibration of (PO2) units involving two P―O―Li linkages(v(PO2)sym). And the shoulder at 1255 cm-1can be assigned to the asymmetric stretching vibration of (PO2) units (v(PO2)asym).The bands at 695 cm-1are ascribed to the symmetric stretching vibration of the bridging oxygen between P―O―P linkages(v(POP)sym) in long-chain phosphate structures, while the bands at 745 cm-1are ascribed tov(POP)symin short-chain phosphate structures. After TeO2is incorporated into glasses, a minor band at 1035 cm-1can be observed, which is the symmetric stretching vibrations of (PO3) involving three P―O―Li linkages in Q(1)0Tespecies. The vibration bands associated with (TeO) structural units can be found at 480 and 635 cm-1, which are due to the symmetric stretching vibration of Te―O―Te (v(TeOTe)sym) and the asymmetric stretching of the continuous network composed of[TeO4] trigonal bipyramid (tbp), respectively. The vibration band at 820 cm-1is ascribed to the [TeO3] trigonal pyramid (tp)25,29.
With the increase of TeO2, the intensity ofv(POP)symin long chains is gradually suppressed, while the band ofv(POP)symin short chains is raised, indicating that long P―O―P chains are broken into short P―O―P chains and more Q(2)0Tespecies transform into Q(1)0Teand Q(2)1Tespecies. Simultaneously, the transformation from Q(2)0Tespecies to Q(2)1Tespecies results in a slight broadening and shifting to lower wavenumber ofv(PO2)symandv(PO2)asymbands, since the symmetric and asymmetricv(PO2) in Q(2)1Tespecies have lower vibration frequency than that in Q(2)0Tespecies. Besides, when TeO2is added into glasses, both three- and four-coordinated Te can be observed. Te-correlated vibration bands gradually rise as TeO2increases.
3.2 31P MAS NMR spectra
Fig. 4 shows the31P MAS NMR spectra and deconvolution models of all these glasses. For glass 0Te (i.e.LiPO3), a main peak at -22.7 ppm is observed, which is assigned to Q(2)0Tespecies. There is also a very small signal at -4.9 ppm corresponding to Q(1)0Tespecies. This is because the excess Li2O,due to a small number of volatilization of P2O5during the melting, provides more nonbridging oxygen atoms to form Q(1)0Tespecies. When TeO2is added into the glass, a new peak(at -13.6 ppm for 10Te glass) appears between the positions of Q(2)0Teand Q(1)0Te, which can be ascribed to Q(2)1Tespecies according to the chemical shift position. With the increase of TeO2, Q(2)0Tespecies decrease significantly while Q(2)1Teand Q(1)0Tespecies increase, which is consistent with the results of Raman spectra.
3.3 31P refocused INADEQUATE spectra

Fig. 4 (a) The 31P MAS NMR spectra of glasses in 100LiO1/2-(100-x)PO5/2-xTeO2. The spinning sidebands are marked by asterisks.(b) The deconvolutions of 31P MAS NMR spectra. Dash lines represent Q(2)0Te (red), Q(2)1Te (yellow) and Q(1)0Te (green) species, respectively.
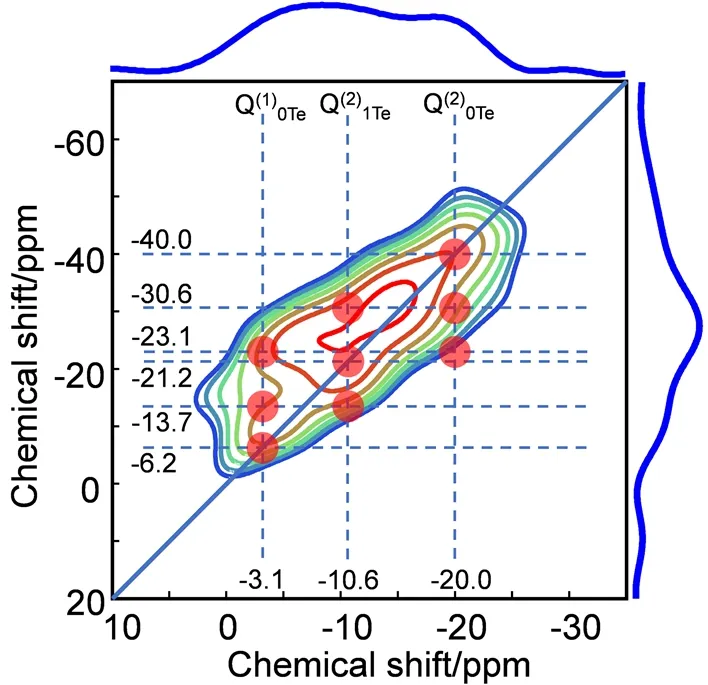
Fig. 5 The 2D 31P refocused INADEQUATE spectra of glass 30Te.Nine translucent red dots in (b) represent nine autocorrelation peaks involving six possible connectivities between Q(2)0Te(-20.0 ppm), Q(2)1Te (-10.6 ppm) and Q(1)0Te (-3.1 ppm) species.
31P refocused INADEQUATE spectra are employed to identify the31P species and detect the correlations between31P species. Fig. 5 shows 2D31P refocused INADEQUATE spectrum of glass 30Te. In the F2 dimension, all peaks observed in ordinary31P single pulse MAS NMR spectra (see Fig. 4) can also be found, which indicates that there are no isolated31P species in 30Te glass. Six connectivities Q(1)0Te-Q(1)0Te, Q(1)0Te-Q(2)1Te,be observed, corresponding to nine correlation peaks marked by nine translucent red dots in Fig. 5. These results indicate that all the phosphorus species are connected with each other through P―O―P bond.
3.4 Static 125Te WURST-QCPMG spectra
Static125Te WURST-QCPMG spectra are generally preferred to probe the chemical environment of125Te rather than magic angle spinning due to the very wide125Te NMR chemical shift distributions18. Fig. 6 illustrates the125Te WURST-QCPMG spectra and deconvolution models. The deconvolution parameters are list in Table 1. There are two components in each spectrum. For 10Te glass, the positions of two components are 2898 and 2262 ppm, which can be assigned to three- and fourcoordinated Te ([TeO3] and [TeO4] species), respectively. [TeO4]species are dominant when the concentration of TeO2is low, but as more PO5/2is substituted by TeO2, the relative proportion of[TeO3] gradually increases.
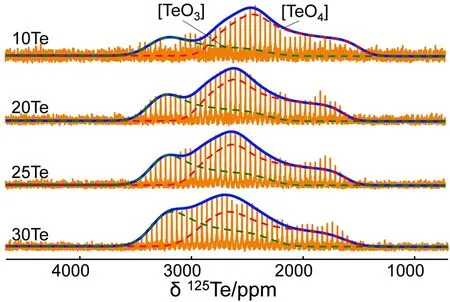
Fig. 6 The 125Te WURST-QCPMG spectra and the dash lines show the deconvolution shapes. The whole peaks are deconvoluted into threecoordinated (green) [TeO3] and four-coordinates (red) [TeO4].
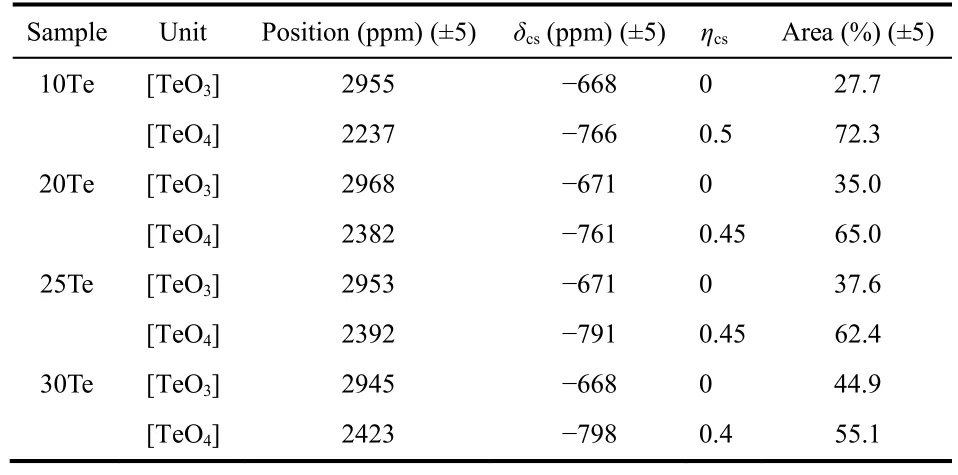
Table 1 The deconvolution parameters of 125Te WURST-QCPMG spectra.
4 Discussion
The deconvolution parameters of the31P MAS NMR spectra(shown in Fig. 4) are summarized in Table 2. With the increase ofxvalue, the proportion of Q(2)0Tespecies decreases while that of Q(1)0Teand Q(2)1Tespecies continuously increase. All the structures ofphosphorus and tellurium units are shown in Fig. 7.Both Q(2)0Teand Q(2)1Tespecies have one Li+ion on average while Q(1)0Tehas two Li+ions. The increase of Q(1)0Tewith TeO2indicates that Li+ions prefer to stay around [PO4] units rather than tellurium oxygen polyhedrons. However, a minor number of Li+ions still interact with tellurium oxygen polyhedrons to form [TeO3]. With the increase of TeO2, more Li+ions interact with tellurium oxygen polyhedrons and resulting in the formation of more [TeO3].
The oxygen atoms in P―O―P, P―O―Te and Te―O―Te are all considered to be bridging oxygen (BO). Thus, the content of Te―BO― bond can be obtained as follows:

whereF(TeOn) is the relative fraction of TeOnspecies listed in Table 1,N(Te) is the total content of Te under the stoichiometry of 100LiO1/2- (100-x)PO5/2-xTeO2. Similarly, the content of P―BO― bond can be calculated as follows:
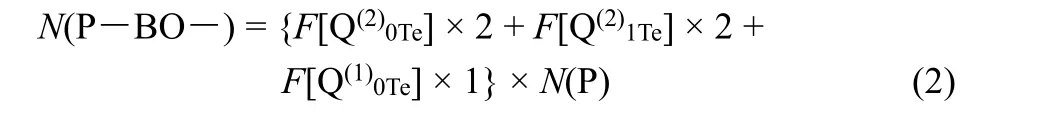
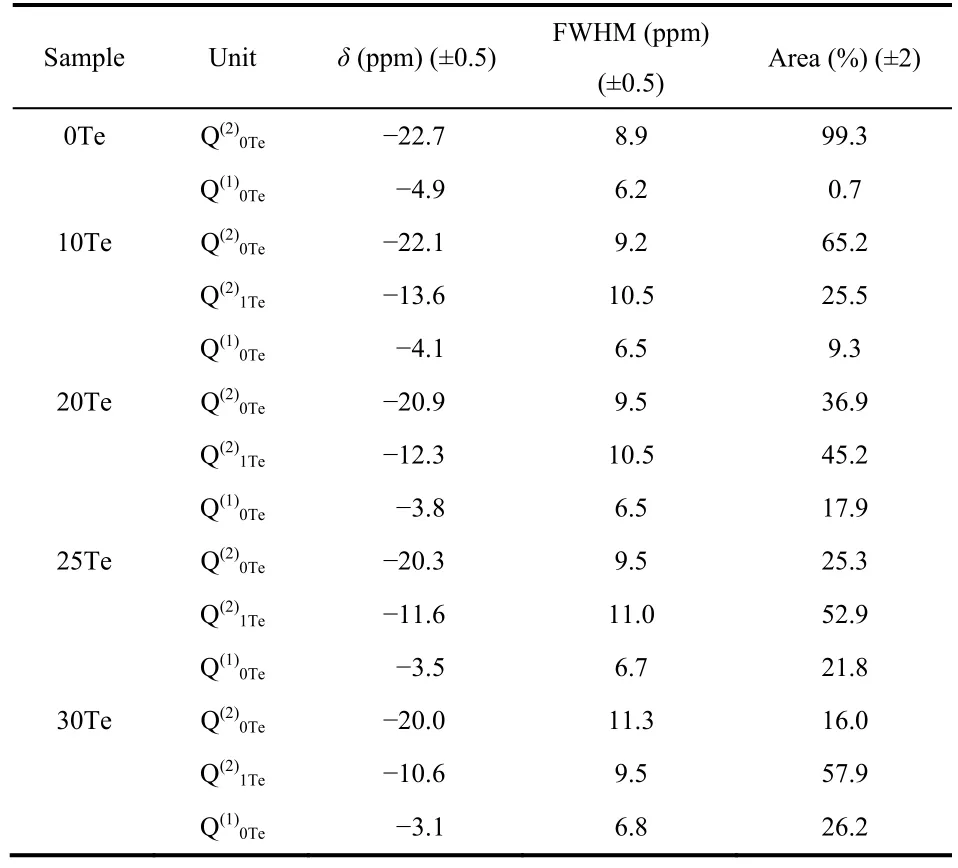
Table 2 The deconvolution parameters of 31P MAS NMR spectra.
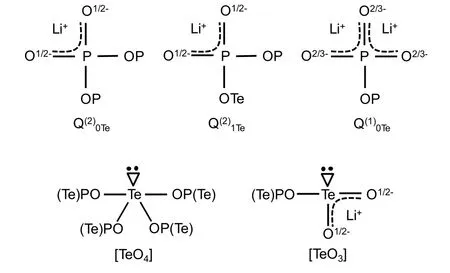
Fig. 7 The structural sketches of phosphorus of Q(2)0Te, Q(2)1Te,Q(1)0Te, three- and four-coordinated Te species. The single, double and dash lines represent the single, double and noninteger bonds,respectively. Every Te atom has a pair of lone electrons and TeOn represents n-coordinated Te.
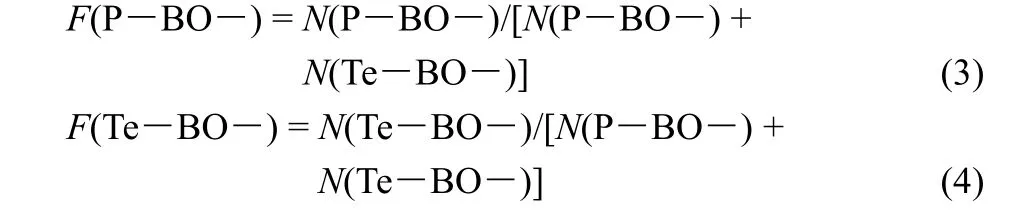
Thus, the fractions of P―BO― and Te―BO― bonds can be calculated as follows:
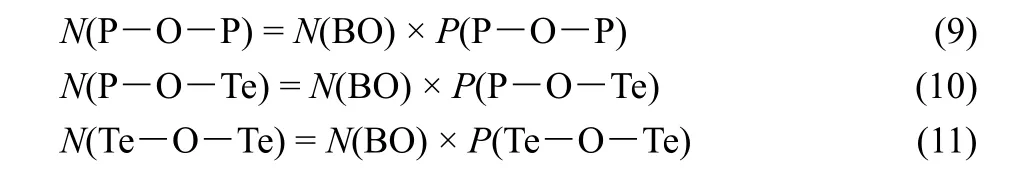
Here, we propose a random distribution model. We assume that all P―BO― and Te―BO― randomly bond to form P―O―P, P―O―Te and Te―O―Te linkages, then the probabilities to form P―O―P, P―O―Te and Te―O―Te linkages are:

And the total content of these three kinds of linkages is equal to the total content of BO as follows:

Thus, the theoretical contents of P―O―P, P―O―Te and Te―O―Te (under the stoichiometry of 100LiO1/2-(100-x)PO5/2-xTeO2.) can be calculated according to the random distribution model as follows:

Fig. 8 Comparison between the theoretical contents calculated according to random distribution model (red) and experimental contents (black) of the P―O―P (a), P―O―Te (b) and Te―O―Te (c) linkages. All the contents are relative to the stoichiometry of 100LiO1/2-(100-x)PO5/2-xTeO2.
Simultaneously, the experimental contents of P―O―P,P―O―Te, Te―O―Te can be calculated from the deconvolutions of125Te WURST-QCPMG and31P MAS NMR spectra (list in Table 1 and Table 2) as follows:
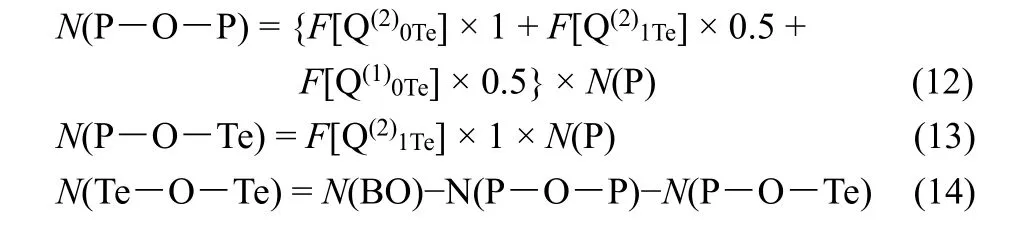
Fig. 8 shows the comparisons between the theoretical (red)and experimental (black) contents of P―O―P, P―O―Te and Te―O―Te linkages. For both P―O―P and Te―O―Te linkages, the experimental values are slightly higher than the theoretical ones. And for P―O―Te linkage, it is inverse. These indicate that P and Te atoms slightly prefer homonuclear connectivity than heteronuclear connectivity.
In this glass system, the fractions of BO in total oxygen atoms can be calculated:

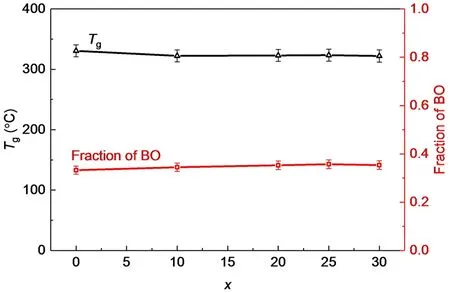
Fig. 9 The fractions of bridging oxygen atom and Tg of the glasses with the compositions of 100LiO1/2-(100-x)PO5/2-xTeO2.
Fig. 9 shows the change trends of the total fractions of BO and theTgvalues. With the increase of TeO2, the fraction of BO andTghave similar change trends that they almost remain constant within errors. This is not unexpected since the strength of the glass network depends on the fraction of BO. The similar BO fractions indicate the similar glass network connectivities and similarTgin this glass system.
5 Conclusions
The structures of the glasses in 100LiO1/2-(100-x)PO5/2-xTeO2 (x= 0, 10, 20, 25, 30) system are investigated by solidstate NMR technologies and Raman spectroscopy. When TeO2is incorporated into these glasses, long P―O―P chains involved in glass networks are broken into short chains and Q(2)0Tespecies gradually transform into Q(2)1Teand Q(1)0Tespecies. Q(2)0Te, Q(2)1Teand Q(1)0Te species are connected with each other through P―O―P. With the addition of TeO2, a minor number of Li+ions interact with tellurium oxygen polyhedrons resulting in the formation of [TeO3]. However, Li+ions prefer to stay around[PO4] units rather than tellurium oxygen polyhedrons. Therefore,only a small fraction of [TeO3] is formed, which increases with the content of TeO2. Most Te atoms exist as [TeO4] in all these glasses. With PO5/2 being gradually replaced by TeO2, both theTgand the fraction of bridging oxygen are almost unchanged,which means the glass network connectivity has no obvious change. The homonuclear connectivities P―O―P and Te―O―Te show slight priority over the heteronuclear connectivity P―O―Te. In summary, this study presents a comprehensive structure study of Li-doped tellurium phosphate ionic conducting glasses. This work could promote the understanding of the glass structure dependence on compositions and the development of new ionic conducting glasses.
Acknowledgment:We thank Yujing Shen (Shanghai Institute of Optics and Fine Mechanics, Chinese Academy of Sciences) and Sasa Yan (Shanghai Institute of Optics and Fine Mechanics, Chinese Academy of Sciences) for theirassistance on the DSC and Raman measurements, respectively.
猜你喜欢
消费电子(2022年6期)2022-08-25
材料与冶金学报(2022年2期)2022-08-10
无人机(2022年3期)2022-05-20
陶瓷学报(2021年1期)2021-04-13
陶瓷学报(2021年1期)2021-04-13
小天使·一年级语数英综合(2020年5期)2020-12-16
军事运筹与系统工程(2020年2期)2020-11-16
表面工程与再制造(2019年3期)2019-12-04
电子制作(2017年8期)2017-06-05
科技创新导报(2016年5期)2016-05-14