
Development and validation of a three-long noncoding RNA signature for predicting prognosis of patients with gastric cancer
2021-01-13 07:43JunZhangHaiYanPiaoYueWangMeiYueLouShuaiGuoYanZhao
World Journal of Gastroenterology 2020年44期
Jun Zhang, Hai-Yan Piao, Yue Wang, Mei-Yue Lou, Shuai Guo, Yan Zhao
Abstract
Key Words: Gastric cancer; Prognosis; Least absolute shrinkage and selection operator; Survival analysis; Long noncoding RNA
INTRODUCTION
Gastric cancer (GC), the fourth most frequently diagnosed malignant tumor, has the second highest cancer-related mortality rate worldwide, with high morbidity in Asia[1]. Moreover, GC is still the second most prevalent cancer in China[2]. Most patients are diagnosed at the advanced stage and are prone to chemoresistance and recurrence. It leads to an overall 5-year overall survival rate of less than 25%[3]. Therefore, developing a novel and reliable prognostic stratification system that could be applied to clinical risk assessment would be of great significance for the treatment and followup of GC patients.
Long noncoding RNAs (lncRNAs) have limited protein-coding ability, exceeding 200 nucleotides in length[4]. Emerging evidence indicates that lncRNAs are involved in tumor initiation and progression through gene expression regulation from epigenetic to post-transcriptional levels[5-7]. Not surprisingly, some studies have shed light on the role of lncRNAs in GC. GClnc1 spurred tumorigenesis and metastasis by recruiting the WDR5/KAT2A complex as a “scaffold” in GC[8]. HOXC-AS3 could be regulated by abnormal histone modification and functioned as an essential element in GC proliferation and migration[9]. Therefore, the abnormal expression of lncRNAs may indirectly reflect the occurrence and development of GC. As genes do not usually act alone, it is necessary to select suitable lncRNAs and establish a multi-lncRNA prediction model, which may play a pivotal role in evaluating the prognosis of GC.
In the present research, we analyzed the expression of lncRNAs associated with GC patients’ survival in The Cancer Genome Atlas (TCGA). We aimed to develop and validate a useful muti-lncRNA combination prediction model that might be useful in helping predict GC survival by performing COX regression and the least absolute shrinkage and selection operator (LASSO)[10].
MATERIALS AND METHODS
Data collection
RNA sequencing and matching medical data were acquired from TCGA (https://portal.gdc.cancer.gov/). Raw data were obtained through the “RTCGA Toolbox package” (R platform). Overall, 407 samples, including 375 GC and 32 normal tissues, were analyzed. The expression of lncRNAs was acquired from Illumina HiSeq-RNASeq platforms. Moreover, the clinical data of GC patients were also downloaded. R was utilized to evaluate findings.
Data preprocessing
Package “edgeR” was utilized to evaluate differentially expressed lncRNAs (DELs).P< 0.01 and |logFC| ≥ 2 were utilized as cutoff points. The R package "survival” was used to perform univariate COX regression analysis. Meaningful lncRNAs in univariate COX regression were incorporated into the construction of the least absolute shrinkage and selection operator (LASSO) regression (package “glmnet”) to minimize the overfitting caused by univariate COX regression. Besides, multivariate COX analysis was performed to screen the independent risk factors associated with GC patients’ prognosis. R package “survminer” was used for visualization.
As time-dependent survival receiver operating characteristic (ROC) curve is an essential measure of the predictive power of a prognostic model, we used the R package “survival ROC” to assess the role of lncRNA combination prediction model in predicting 5- and 3-year survival. Kaplan-Meier survival analysis was performed to explore correlations between the lncRNA combination model and the overall survival (OS). This study was carried out according to the flow chart (Figure 1A).
Ethical statement and tissue samples
Overall, 200 GC and non-tumorous adjacent tissues were acquired from people undergoing surgery at the Liaoning Province Cancer Hospital and Institute from 2012 and 2014. Individuals were asked to sign an informed consent form before the operation. The hospital’s Ethics Committee approved the study. No preoperative chemotherapy or radiotherapy was performed on enrolled patients. Gastrectomy and D2 lymph node dissection were applied to all patients. Total RNA was extracted from patient tissue samples. Tumor staging was based on the tumor-node-metastasis (TNM) staging system (8thedition). One hundred and forty-two men and 58 women were enrolled in this study; their average age was 65 years (range, 42-78 years). Postoperative adjuvant chemotherapy was applied to stage IIA and above disease. Table 1 shows the clinicopathological parameters of the patients. Follow-up was the same as that in previous studies[9], and the follow-up deadline is December 31, 2019.
Cell culture
The gastric epithelial cell line GES-1 and gastric cancer cell lines AGS and MKN45 were obtained from China Medical University (Shenyang, China). Cells were maintained in RPMI 1640 supplemented with 10% fetal bovine serum, penicillin, and streptomycin (Invitrogen, United States) at 37 °C at 5% CO2/1% O2. Analyses were performed at least three times.
Real-time reverse transcription-polymerase chain reaction
TRIzol, Promega cDNA core kit, and SYBR Master Mixture were utilized to create cDNA and conduct real-time reverse transcription-polymerase chain reaction (RTPCR) as those described in previous studies[6,11,12].
Statistical analysis
Data are shown as the mean ± standard deviation. Student’st-test, Wilcoxon-signed rank test, and ANOVA were used for statistical analyses through SPSS 23.0 (IBM, NY, United States). The relationship between clinical data and expression of biomarkers was tested byχ2test or Fisher’s exact test. The log-rank test and COX proportional hazards model were used for survival analysis.P< 0.05 represented statistical significance.
RESULTS
Identification of differentially expressed lncRNAs
RNA sequencing involved 375 GC and 32 para-carcinoma tissues. EdgeR was used to determine the DELs (P< 0.01 and |logFC| ≥ 2). A total of 992 DELs were obtained, of which 772 were up-regulated, and 220 were down-regulated (Figure 1B and Supplementary Table 1). Moreover, the heatmap elucidated the top 50 DELs (Figure 1C).
Prognostic model based on expression levels of 3-lncRNA combination
Sixty-three lncRNAs were associated with the survival of GC by univariate COX regression analysis (Supplementary Table 2). The lncRNA-seq expression profile of the 63 lncRNAs and the clinical data were extracted for LASSO regression (Figure 2A). As
a result of the LASSO penalized uni-Cox model, 22 lncRNAs were finally identified (Figure 2B) and incorporated into the multivariate COX model to identify independent prognostic factors associated with survival. As a result of LASSO and COX model, AC007991.4 (ENSG00000254287, antisense), AC079385.3 (ENSG00000257918, antisense), and AL109615.2 (ENSG00000231881, lincRNA) were finally identified (Figure 2C and D).

Table 1 Patient characteristics and univariate analysis
According to the expression levels of the 3-lncRNA combination, all samples were divided into a high-risk group (red, Figure 3A) and low-risk group (green, Figure 3A). The survival time in years is shown in Figure 3B (red dots indicate death, and green dots indicate alive). The heatmap elucidated the expression of the three lncRNAs according to the risk level (Figure 3C). ROC analysis assessed the role of the 3-lncRNA combination prediction model in predicting survival. The areas under the curves for 3-year and 5-year survival were 0.78 and 0.75, respectively (Figure 3D). The C-index was 0.72 (se = 0.022, 95% confidence interval [CI]: 0.67-0.76), indicating that the model was a good predictor of patient survival. The low-risk group had a longer survival time than the high-risk group (Figure 3E,P< 0.001). Based on this, we obtained a 3-lncRNA combination prognostic model for GC patients: “risk score = -0.92 × AC007991.4 + 1.18 × AC079385.3 + 1.17 × AL109615.2”, and prepared for further verification (cutoff value = 6.58).
Expression of AC007991.4, AC079385.3, and AL109615.2 in GC
We then tested the expression of AC007991.4, AC079385.3, and AL109615.2 in GC cells and tissues. The results were consistent with those of bioinformatics prediction: AC007991.4 was weakly expressed in both GC cells and tissues (Figure 4A and D), while AC079385.3 and AL109615.2 were overexpressed in GC (Figure 4B, C, E, and F).
Validation of prognostic performance of the 3-lncRNA combination
Clinical data of 200 patients were enrolled in this study to verify the effectiveness of the 3-lncRNA combination prediction model. The disease-free survival (DFS) ranged from 5-91 mo, OS ranged from 7-91 mo, and 126 patients died before the end of followup. Then, we detected the expression of AC007991.4, AC079385.3, and AC079385.3 in these 200 tissue samples and evaluated the correlation between their expression and survival. As shown in Table 1, the Bormann type, tumor size, vessel invasion, perineural invasion, TNM, AC079385.3, and AL109615.2 were all associated with the poor DFS and OS (P< 0.05). Not surprisingly, “high risk” in the 3-lncRNA combination prediction model was also a poor prognostic factor for DFS (37.66vs53.91,P< 0.01, Figure 5) and OS (44.46vs59.27,P< 0.01, Figure 5).
The parameters withP< 0.05 in the univariate analysis were included in the COX proportional hazard model. The role of TNM stage in prognosis remained unshaken [DFS:P= 0.00, hazard ratio (HR) = 106.50, 95%CI: 30.76-368.77; OS:P= 0, HR = 94.08, 95%CI: 30.14-293.65, Table 2]. The “high risk” also contributed as a poor independent prognostic factor both in DFS (P= 0.03, HR = 2.38, 95%CI: 1.34-4.23) and OS (P= 0.02, HR = 2.62, 95%CI: 1.44-4.77). In addition, the overexpression of AC079385.3 also foreshadowed the poor of survival of GC (DFS:P= 0.04, HR = 1.67, 95%CI: 1.46-1.99; OS:P= 0.04, HR = 1.72, 95%CI: 1.49-1.96). Its biological function in GC is worth further discussion.
Correlations between clinicopathological characteristics and 3-lncRNA combination prediction model
According to the 3-lncRNA combination prediction model and the expression of lncRNAs, we obtained the risk score (risk score = -0.92 × AC007991.4 + 1.18 × AC079385.3 + 1.17 × AL109615.2). Patients were classified as “high risk” and “low risk" according to the cutoff value. The combination was associated with the Bormann type (P= 0,χ2= 14.29) and TNM stage (P= 0.01,χ2= 10.85) of GC (Table 3).
DISCUSSION
LncRNAs are a class of molecules with functional relevance for gene expression regulation and have been discovered recently. With the expansion of research on lncRNA function, growing evidence demonstrates that a series of lncRNAs are aberrantly expressed in cancer and involved in cancer progression regulation. Moreover, they have increasingly complex functions. As “scaffolds”, they stimulate the interaction between proteins. As “guides”, lncRNAs enable the mixing of proteinand genes[13]. As “enhancers”, lncRNAs control transcription of nearby genes. As “decoys”, lncRNAs are bound to microRNAs or proteins[14,15].

Table 2 Multivariate analysis of significant prognostic factors for survival in gastric cancer patients
Because of the critical regulatory role of lncRNAs in tumorigenesis and development, more and more lncRNAs have been recognized as biomarkers for GC treatment and progenies[12,16]. MAFG-AS1 promoted GC cell proliferation and invasion and might be a valuable prognostic biomarker[16]. LncRNA pcsk2-2:1 could be parceled into serum exosome and acted as a diagnostic biomarker for GC[17]. Fattahiet al[18]summarized the role of famous lncRNAs such as H19, HOTAIR, UCA1, and PVT1 as molecular markers in GC. However, these studies only discussed the predictive value of a single biomarker, which may not be sufficient to predict the prognosis of GC. In the present study, clinical data and RNA-seq data of GC patients were obtained from TCGA as a training set. The patients’ data of our center served as the verification set.P< 0.01 and |logFC| ≥ 2 were used as the cutoff points to obtain the DELs. To improve the regression model’s prediction accuracy, LASSO and COX regression analyses were applied to examine the correlation between the expression of lncRNAs and GC patients’ survival. Compared with previous studies[17], this method is the first to study GC related lncRNA markers; it effectively minimizes the overfitting caused by univariate COX regression[19,20]. LASSO is a kind of regression analysis introduced in statistics and machine learning[21,22]. Compared with the traditional model, LASSO improves the prediction accuracy and interpretability through variable selection and regularization. The LASSO regression evaluation process includes relationship to ridge regression, best subset selection, the connections between lasso coefficient estimates, and soft thresholding[23,24].
Then, we got a 3-lncRNA combination prediction model: AC007991.4, AC079385.3, and AL109615.2. They were all potential prognostic independent risk factors for GC. According to the expression levels of the 3-lncRNA combination, all samples were divided into a high-risk group and low-risk group. This model could predict patients’ poor prognosis in the high expression group in both the training and validation sets. Subsequently, we verified the expression of these three lncRNAs in GC tissues and cells. AC007991.4 was weakly expressed in GC. However, both AC079385.3 and AL109615.2 were potential onco-lncRNAs.
AC007991.4 and AC079385.3 are all antisense lncRNAs, and located at chromosome 8: 39918076-39920890 and chromosome 12: 106714924-106733066. Their molecular functions have not been reported. As a long intergenic non-coding RNA, AL109615.2 locates at chromosome 6: 44058792-44089288, which could competitively bind miR-133b with vascular endothelial growth factor C to induce colorectal cancer cell metastasis[25]. According to the expression of AC007991.4, AC079385.3, and AL109615.2, GC patients were divided into “high risk” and “low risk” groups. Both the area under the ROC curve and C-index suggested that the model has appropriate prediction performance.
Moreover, it was confirmed by the verification set that the prediction model was an independent risk factor for the prognosis of GC. Besides, it was positively correlated with Bormann type and TNM stage in GC. It is also worth pointing out that AC079385.3 was a prognostic risk factor for GC in both the training and validation sets, suggesting that it might play a pivotal role in the model. Its molecular biological function and position in the development of GC require further study.

Table 3 Three-long noncoding RNA model and clinicopathologic parameters
CONCLUSION
In conclusion, we present a 3-lncRNA model for evaluating survival in GC patients, which may be an independent prognostic factor. Clinicians can obtain the expression levels of AC007991.4, AC079385.3, and AL109615.2 in tissue samples by RT-PCR and calculate the corresponding risk values (risk score = -0.92 × AC007991.4 + 1.18 × AC079385.3 + 1.17 × AL109615.2, cutoff value = 6.58). And then it can be used to evaluate the prognosis of patients. Besides, we can visualize the model and other related risk factors to assess the modification’s effectiveness in future clinical work.

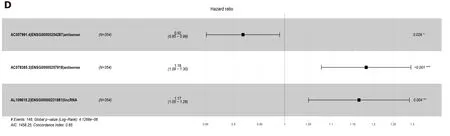
Figure 2 Least absolute shrinkage and selection operator and COX regression screened prognosis associated long noncoding RNAs. A: Least absolute shrinkage and selection operator coefficient values of the 22 prognosis-related long noncoding RNAs in The Cancer Genome Atlas cohort; B: L1-penalty of least absolute shrinkage and selection operator-COX regression; C: Forest plotshowing the correlations between the 22 long noncoding RNAs and the survival of gastric cancer patients in The Cancer Genome Atlas; D: AC007991.4, AC079385.3, and AL109615.2 are all independent prognostic risk factors for gastric cancer.


Figure 3 Characteristics of the 3-long noncoding RNA combination in The Cancer Genome Atlas queue. A: The Cancer Genome Atlas samples arranged according to risk score (the low-risk group, green, the high-risk group, red); B: The Cancer Genome Atlas samples arranged according to survival time in years (red, death; green, alive); C: Heatmap showing the expression of three long noncoding RNAs in samples according to the risk score (blue, low-risk group; pink, high-risk group); D: The receiver operating characteristic curve for evaluating the predictive effectiveness of the model; E: The high-risk group in this model has a worse overall survival. AUC: Area under the curve.

Figure 4 Expression of AC007991.4, AC079385.3, and AL109615.2 in gastric cancer tissues and cells. A and D: AC007991.4 is weakly expressed in gastric cancer (GC) cells and tissues; B and E: AC079385.3 is overexpressed in GC cells and tissues; C and F: AL109615.2 is overexpressed in GC cells and tissues. bP < 0.01. GC: Gastric cancer.

Figure 5 Kaplan-Meier curves for disease-free survival and overall survival. A and B: Disease-free survival (DFS) and overall survival (OS) curves of 200 gastric cancer (GC) patients stratified by AC007991.4 expression (P = 0.05). The overexpression of AC007991.4 contributed to a good survival; C and D: DFS and OS curves of 200 GC patients stratified by AC079385.3 expression (P = 0.00). The overexpression of AC079385.3 contributed to an excellent survival; E and F: DFS and OS curves of 200 GC patients stratified by AL109615.2 expression (P = 0.00 and P = 0.02). The overexpression of AL109615.2 contributed to an excellent survival; G and H: DFS and OS curves of 200 GC patients stratified by the 3-long noncoding RNA model (P = 0.00). The high score of expression model contributed to a good survival. DFS: Disease-free survival; OS: Overall survival.
ARTICLE HIGHLIGHTS

Research perspectives
Clinicians can obtain the expression levels of AC007991.4, AC079385.3, and AL109615.2 in tissue samples by real-time reverse transcription-polymerase chain reaction and calculate the corresponding risk values.
 World Journal of Gastroenterology2020年44期
- World Journal of Gastroenterology的其它文章
- Prognostic value of changes in serum carcinoembryonic antigen levels for preoperative chemoradiotherapy response in locally advanced rectal cancer
- Use of the alkaline phosphatase to prealbumin ratio as an independent predictive factor for the prognosis of gastric cancer
- Active tuberculosis in inflammatory bowel disease patients under treatment from an endemic area in Latin America
- Prevalence and predictors of nonalcoholic fatty liver disease in South Asian women with polycystic ovary syndrome
- Associations between serum uric acid and hepatobiliary-pancreatic cancer: A cohort study
- COVID-19 in a liver transplant recipient: Could iatrogenic immunosuppression have prevented severe pneumonia? A case report