
Energy dissipation and power deposition of electromagnetic waves in the plasma sheath
2021-03-01 08:09JiahuiZHANG张珈珲XinJI吉欣KeyuanYANG杨克元LeiSHI石磊andQingxiaWANG王青霞
Plasma Science and Technology 2021年1期
关键词:石磊
Jiahui ZHANG(张珈珲),Xin JI(吉欣),Keyuan YANG(杨克元),Lei SHI(石磊) and Qingxia WANG (王青霞)
1 School of Aerospace Science and Technology, Xidian University, Xi’an 710071, People’s Republic of China
2 China Academy of Space Technology, Xi’an 710100, People’s Republic of China
Abstract Energy dissipation and power deposition of electromagnetic waves(EMW)in the reentry plasma sheath provide an opportunity to investigate ‘communication blackout’ phenomena.Based on a finite element method (FEM) simulation, we analyze variation of EMW energy dissipation and power deposition profiles dependent on the wave polarization, wave incident angle, plasma density profile and electron collision frequency.Cutoff and resonance of EMW in the plasma sheath are crucial in explaining the regulation of energy dissipation and power deposition.
Keywords: electromagnetic wave, power deposition, plasma sheath
1.Introduction
A plasma sheath comes into being when a vehicle flies with hypersonic velocity.This is caused by the dissociation and ionization of the air molecules originating from the hightemperature shock wave heating of the air [1].The plasma sheath surrounds the hypersonic vehicle and acts as a dispersion medium for the electromagnetic waves (EMW) used for communication or radar detection [2, 3].In communication technology, the plasma sheath becomes a barrier for EMW and ‘communication blackout’ phenomena occur because of the reflection and absorption of EMW in the presence of the plasma sheath.In radar detection, the plasma sheath absorbs substantial energy from the EMW and reduces the efficiency of radar detection.Therefore, the concept of plasma stealth was developed and discussed[4].With respect to communication blackout research, the reflection of EMW caused by the plasma sheath and the corresponding conditions have been widely discussed [5].Blackout mitigation is of great importance and a few mechanisms have been developed to address this issue.Mechanisms such as aerodynamic shape modification[6],electrophilic fluid injection,surface catalysis effects[7]and E × B drift[8-10]mitigate the plasma sheath by reducing the electron plasma density.While other mechanisms keep the plasma sheath invariant, for example,wave frequency modification[11],laser communication[12],magnetic windows [13], resonant transmission [14], electron acoustic wave transmission [15] and three-wave interactions[16]comply with the plasma sheath and mitigate blackout by exploring and utilizing the EMW propagation characteristics in the plasma.However, EMW energy dissipation caused by the plasma sheath has not been focused on and the power deposition within the plasma sheath is ambiguous.This was the original motivation for this paper.On one hand, research of EMW energy dissipation in the plasma sheath can supply new insights into communication blackout.On the other hand, EMW energy dissipation regulations can be used to explain the phenomena relevant to the radar detection of a hypersonic vehicle enveloped by the plasma sheath.
The simulation of EMW propagation is important in understanding the interaction between EMW and plasmas.USIM is a plasma simulation software based on magnetofluid theory and it is widely used in simulating EMW in the plasma sheath [17-19].The finite-difference time-domain method(FDTD)can give the EMW field evolution with time across the plasma sheath [20-22].The commercial code Ansoft and CST are convenient to simulate the communication antenna surrounded by the plasma sheath[23].However,additional plasma physical effects cannot be captured easily in the simulation.As an important supplement,COMSOL Multiphysics software can be used to analyze the physical effects,such as EMW cutoff and resonance in the plasma.Previously, we used COMSOL to analyze EMW field distributions[24]and the spatial dispersion effect[25]in a nonuniform plasma sheath.In this work,we will apply COMSOL to research EMW energy dissipation and power deposition in a nonuniform plasma sheath.
The arrangement of this paper is as follows: the plane wave simulations are given in section 2.The full wave simulations based on realistic plasma sheath parameters are shown in section 3.Conclusions are drawn in section 4.
2.Plane wave simulations
2.1.Model and wave equations
The EMW equation is solved in the frequency domain based on the finite element method.We assume that the variables of electromagnetic fields oscillate with eiωt, then the EMW equation in terms of the electric field can be given as:

where the relative permittivity of the air or plasma is defied by εr′ and the wave number in the air is defied byk0.The relative permittivity of plasma is:
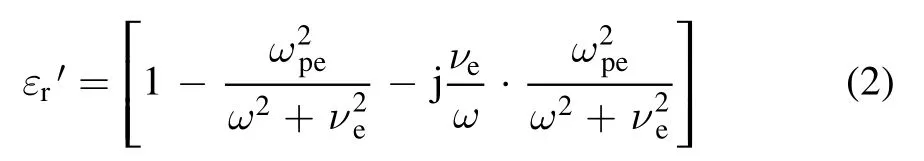
where the angular frequency of the EMW is defined by ω,electron collision frequency is defied by νe, the plasma angular frequency is defined as
neis the electron density,eis the electron charge, ε0is the permittivity of air andmeis the mass of the electron.
Figure 1 shows the 2D model used to simulate the plane EMW across the reentry nonuniform plasma sheath caused by hypersonic flows.The plasma sheath is inserted into the air region.The electron density is assumed nonuniform inydirection and uniform inxdirection.The symmetry electron density distribution in the plasma region is given as:

whereNis the maximum electron density aty=y0andLis the decay constant of the electron density.The electron collision frequency νeis treated as a constant in the plasma sheath.The permittivity of the plasma sheath can be imported by equation (2).The plane wave source is placed in the bottom air region and the wave vector k is set to be in thexoyplane.The input power of the EMW is 1 W.Periodic boundary conditions, which are consistent with the plane wave source, are assigned to the left and right boundaries.The relevant parameters are listed in table 1.

Figure 1.Plane wave simulation model for EMW across the reentry nonuniform plasma sheath.The plane wave excitation is placed in the bottom air region.The wave vector k is set to be in the xoy plane.Periodic boundary conditions are assigned to the left and right boundaries.Perfect matched layers are applied to mimic the infinite boundary conditions for EMW.

Table 1.The parameters in the simulation.
Perfect matched layers (PMLs) are used to simulate the infinite boundary conditions for EMW.The property of the PML is the same as the air.We apply a polynomial stretching function in theydirection, which is defined by:where ξ is the dimensionless coordinate which varies from 0 to 1 over the PML,sis a scaling factor andpis a curvature parameter.The complex displacement for stretching in a single direction isis the original thickness of the PML and λ is a typical wavelength.To retain perfect absorption for plane waves incident at an angle α relative to the boundary normal,it is necessary to compensate for the longer wavelength seen by the PML in the stretching direction by setting the scaling factor:

The curvature parameterpis equal to the default value 1.The quality of the PML is insensitive to the thicknessLPMLwhile eight mesh elements across the PML(in theydirection)must be satisfied.The grid dependency and validation of the simulation model have been discussed in detail in reference [24].
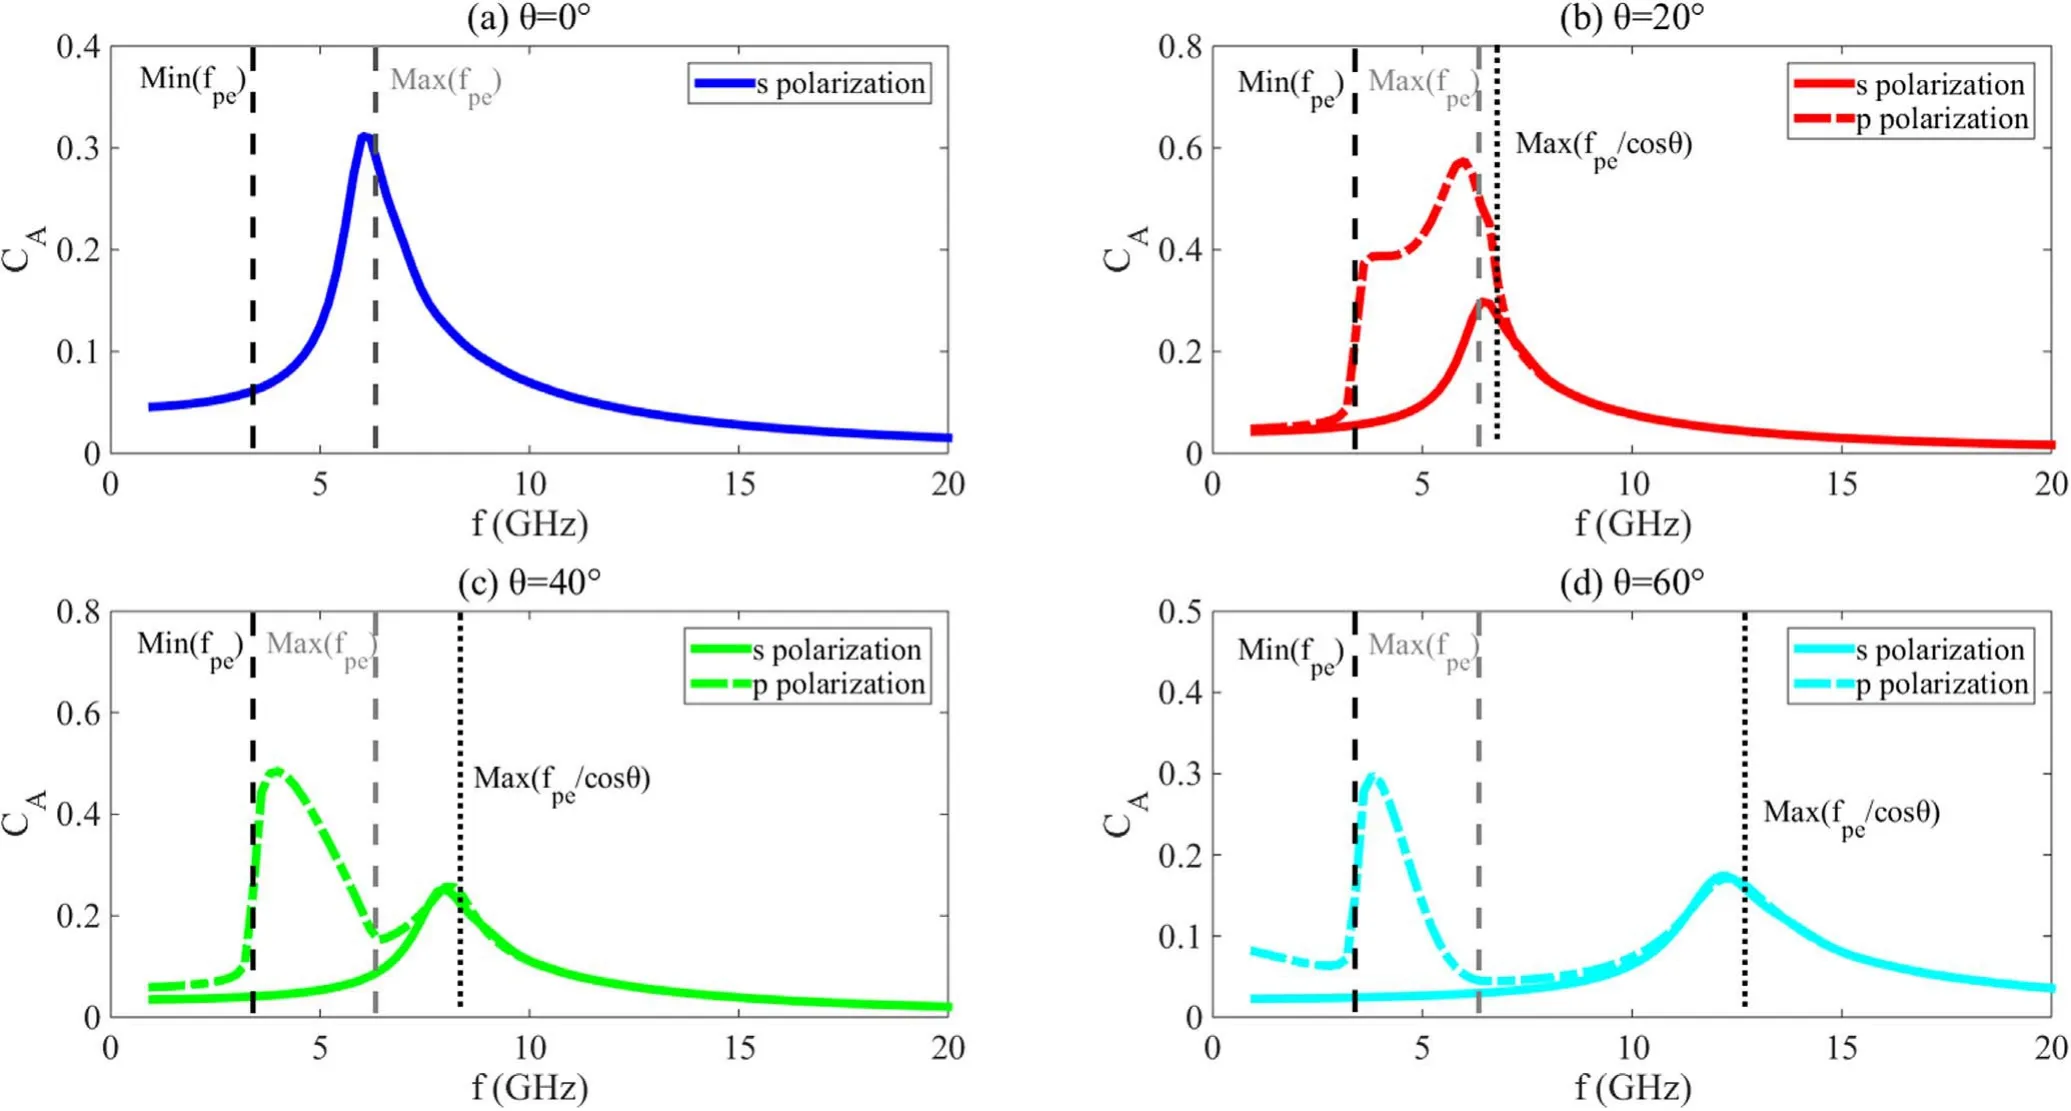
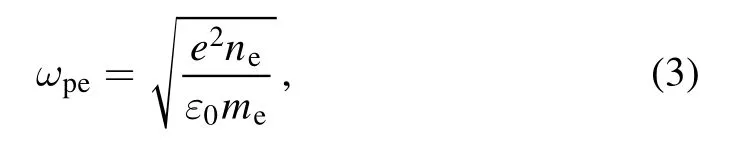
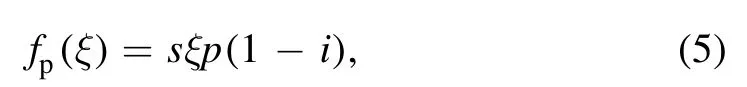
Figure 2.The frequency response of the absorption coefficient CA with incidence angle(a)θ = 0°,(b)θ = 20°,(c)θ = 40°and(d)θ = 60°.The solid line denotes CA belonging to EMW with s polarization and the dashed line denotes CA belonging to EWMs with p polarization.The electron peak density is 5 × 10¹⁷ m−3,the decay constant of electron density L is 0.002 m and the collision frequency νe is 0.1 GHz.The other parameters are listed in table 1.
In the beginning of this section, the basic parameters in this work need to be drawn.The range of electron density in the realistic plasma sheath is around 1015-1019m−3.So the moderate electron peak density, 5 × 10¹⁷m−3, is adopted in our simulation model.The range of EMW frequency is chosen as 1-20 GHz to cover the main communication frequency band.The input power of EMW is 1 W.The decay constantLin equation (4) can be used to adjust the electron density profile.
For simplicity,the electron plasma frequency is defined as:

This equation is relevant to EMW cutoff and resonance in the plasma.In the case of 1D nonuniform plasma, the cutoff frequency for EMW with vertical incidence in the local plasma region is given as:

If taking EMW with oblique incidence into account,the more general form can be deduced:

where θ is the incident angle of the EMW.The EMW resonance phenomenon in the plasma has been discussed in reference [24] and can be summarized as a sentence:p polarization EMW with oblique incidence can resonate with electron plasma when the condition off=fpeis satisfied in some local plasma regions.The preliminary knowledge here will be helpful to explain the characteristics of EMW power deposition in the plasma sheath.
2.2.Dependence on incidence angle
The frequency response of the absorption coefficientCAwith different incident angle is shown in figure 2.In each incident angles condition, the s polarization (Ex=Ey= 0,Ez≠ 0)case can be compared with the p polarization (Ex≠ 0,Ey≠ 0,Ez= 0) case.For the s polarization case, the wave frequency corresponding to the absorption maximum shifts with the incident angle.This phenomenon is closely related to the cutoff frequency of EMW in the nonuniform plasma sheath, which is defined in equation (8b).The cutoff frequency depends on the incident angle of EMW and the absorption coefficientCAalso maximizes near the frequency Max(fpe/cosθ).For the case of EMW with normal incidence in figure 2(a), the curve ofCAwith p polarization coincides with the one with s polarization.Nevertheless,for the case of an EMW with an oblique incidence angle, the curves ofCAwith p polarization deviate from the results with s polarization in the frequency band ranging from Min(fpe)to Max(fpe).The discrepancy originates from the resonance between EMW and Langmuir oscillation.The resonance can only take place for p polarization EMW with oblique incidence angle when Min(fpe) <f< Max(fpe).The absorption coefficientCAin this frequency band will be enhanced because of the resonance.The details of the resonance between EMW and Langmuir oscillation can be found in reference [24].The characteristic frequency values, Min(fpe), Max(fpe),Min(fpe/cosθ)and Max(fpe/cosθ)for various incident angles are listed in table 2.

Figure 3.The power deposition profiles belonging to EMW with s polarization.(a) f = 4 GHz in the first column, (b) f = 6 GHz in the second column,(c)f = 8 GHz in the third column and(d)f = 10 GHz in the fourth column.The blue line in the first row denotes θ = 0°,the red line in the second row denotes θ = 20°,the green line in the third row denotes θ=40°,the cyan line in the fourth row denotes θ = 60°.The cutoff position of EMW near the input boundary is marked by the black dashed line if it exists in the plasma sheath.

Table 2.The characteristic frequency values for various incident angles.
The power deposition profiles of EMW with s polarization are shown in figure 3.Subplots in the same column have the same wave frequency and the subplots in the same row have the same incident angle.According to the relationship between the wave frequency and the cutoff frequency of plasma sheath, the power deposition profiles fall into three categories:
f< Min(fpe/cosθ), Min(fpe/cosθ) <f< Max(fpe/cosθ) andf> Max(fpe/cosθ).Whenf< Min(fpe/cosθ), EMW are evanescent all over the plasma sheath and the power deposition concentrates near the left boundary of the plasma sheath (green line in the first column, cyan lines in the first and second columns).Iff> Max(fpe/cosθ),the power deposition can cover the whole plasma sheath and maximize near its center(blue lines in the third and fourth columns, red lines in the third and fourth columns,green line in the fourth column).The power deposition can permeate the plasma sheath inside a certain depth when Min(fpe/cosθ) <f< Max(fpe/cosθ).The penetration depth of power deposition is proportional to the depth of the first critical cutoff position of EMW.The first cutoff position of EMW near the input boundary is marked by the black dashed line(blue lines in the first and second columns,red lines in the first and second columns,green lines in the second and third columns,cyan lines in the third and fourth columns).It should be noted that the volume integration of the power deposition results in the absorption coefficientCA.
Figure 4 shows the power deposition profiles of EMW with p polarization.Subplots in the same column have the same wave frequency and the subplots in the same row have the same incident angle.EMW with p polarization and oblique incident angle can resonate with electron plasma when the condition of Min(fpe) <f< Max(fpe) is satisfied.The absorption coefficient is much larger than the one with s polarization in the frequency range of Min(fpe) <f<Max(fpe) in figure 2.In this case, the power deposition concentrates on the left resonance position (red lines in the first and second columns, green lines in first and second columns, cyan lines in the first and second columns).Furthermore, the amplitude of the power deposition peak is sensitive to the incident angle of EMW and this is consistent with the absorption coefficient in figure 2.The power deposition rules without the resonance are no different from the case of s polarization EMW.

Figure 4.The power deposition profiles belonging to EMW with p polarization.(a) f = 4 GHz in the first column, (b) f = 6 GHz in the second column,(c)f = 8 GHz in the third column and(d)f = 10 GHz in the fourth column.The blue line in the first row denotes θ = 0°,the red line in the second row denotes θ = 20°, the green line in the third row denotes θ = 40°, the cyan line in the fourth rowdenotes θ = 60°.
2.3.Dependence on density profiles
The electron density profiles can be adjusted by modifying the decay constant of electron densityLwhile the peak density remains the same.The symmetry electron density profiles with differentLare shown in figure 5.The smaller the decay constantLis, the steeper the density profile is, and the lower the edge electron density is.The frequency response of the absorption coefficientCAwith different decay constantLis shown in figure 6.The EMW incident angle is chosen to be 20° because a relative small incident angle is suitable for the realistic application scenario.In this case, the cutoff frequency Max(fpe/cosθ) of the plasma sheath is very close to Max(fpe).For s polarization EMW,the absorption coefficientCAmaximizes near the frequency of Max(fpe/cosθ).The peak amplitude ofCAincreases and the absorption bandwidth gets narrow when the decay constantLincreases.For p polarization EMW, the variation of the peak amplitude is not as large as it is for s polarization EMW.However, the bandwidth ofCAdecreases significantly withLincreasing.This is determined by the condition of EMW resonance with electron plasma, Min(fpe) <f< Max(fpe).The largerLresults in the larger Min(fpe) of the plasma sheath, which is the boundary of the absorption bandwidth.The characteristic frequency values, Min(fpe), Max(fpe), Min(fpe/cosθ) and Max(fpe/cosθ) for various decay constantsLare listed in table 3.

Figure 5.The electron density profiles with different decay constants.
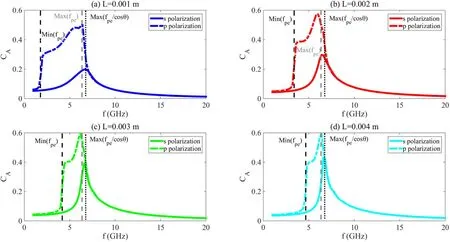
Figure 6.The frequency response of the absorption coefficient CA with decay constant(a)L = 0.001 m,(b)L = 0.002 m,(c)L = 0.003 m and(d)L = 0.004 m.The solid line denotes CA belonging to EMW with s polarization and the dashed line denotes CA belonging to EWMs with p polarization.The incident angle of the EMW is 20°, the electron peak density is 5 × 10¹⁷ m−3 and the collision frequency νe is 0.1 GHz.The other parameters are listed in table 1.

Table 3.The characteristic frequency values for various decay constants L.
2.4.Dependence on peak electron density
The peak electron number density is also the key factor to influence the energy dissipation of EMW.Figure 7 shows the frequency response of the absorption coefficientCAfor various peak electron densities.In all these cases,the absorption bands for p polarization are wider than those for s polarization.Furthermore, the absorption bands shift from the lowfrequency region to the high-frequency region when the peak electron number density increases.This phenomenon can be explained by the fact that the peak electron density determines Max(fpe) and Min(fpe) of the plasma sheath, as well as the cutoff and resonance condition of the EMW.The characteristic frequency values,Min(fpe),Max(fpe),Min(fpe/cosθ)and Max(fpe/cosθ) for various peak electron densities are listed in table 4.
2.5.Dependence on electron collision frequency
The electron collision frequency is another important parameter which influences the energy dissipation of EMW in the plasma sheath.The frequency response of the absorption coefficientCAwith various electron collision frequencies νeis shown in figure 8.Increasing the electron collision frequency νenot only enhances the amplitude peak ofCA, but also enlarges the frequency bandwidth of the absorption coefficient.It should also be noted that the discrepancy between s and p polarization tends to vanish when νeincreases.
3.Full wave simulations
3.1.Model
Previously, we have obtained the EMW energy dissipation and power deposition regulations in the reentry plasma sheath based on plane wave model.In this section, we will proceed to the full wave simulation based on a 2D plasma model to mimic the realistic reentry plasma sheath.The full wave simulation model is shown in figure 9.The simulation region is surrounded by PMLs.In the simulation region, the plasma sheath is inserted into the air region.The electron density is assumed nonuniform inxandydirection as:

Figure 7.The frequency response of the absorption coefficient CA with peak electron density(a)N = 1 × 10¹⁷ m−3,(b)N = 5 × 10¹⁷ m−3,(c) N = 1 × 10¹⁸ m−3 and (d) N = 5 × 10¹⁸ m−3.The solid line denotes CA belonging to EMW with s polarization and the dashed line denotes CA belonging to EWM with p polarization.The incident angle of the EMW is 20°,the decay constant of electron density L is 0.002 m, and the collision frequency νe is 0.1 GHz.The other parameters are listed in table 1.

Table 4.The characteristic frequency values for various peak electron density.

The profiles ofN(y)shown in figure 10 are fitted based on the reentry hypersonic fluid simulation results[26].The variation of the electron density in thexdirection is defined byLx.According to the characteristic of collision frequency distribution[26],the collision frequency is defined as uniform inydirection and nonuniform in thexdirection:

The characteristic parameters of the plasma sheath with different altitudes are shown in table 5.The wave port is placed in the bottom air region and the main wave vector k is set to be normal to the plasma sheath boundary.The EMW input power is 1 W.
3.2.Dependence on the altitude of the reentry vehicle
The frequency responses of the absorption coefficientCAfor different altitudes of the reentry vehicle are shown in figure 11.High energy dissipation occurs at the altitude of 40 km and 60 km when the wave frequency is close to the plasma frequency.At the altitude of 40 km,the collision frequency is so large that the difference between s and p polarization is not obvious.Though the collision frequency at the altitude of 20 km is the largest, the energy dissipation is still very low.The reason is that the wave frequency is much larger than the plasma frequency and most wave energy gets through the plasma sheath.The energy dissipation at the altitude of 80 km is low because of the low collision frequency.In this case,most wave energy has been reflected.

Figure 8.The frequency response of the absorption coefficient CA with collision frequency (a) νe = 0.05 GHz, (b) νe = 0.1 GHz, (c)νe = 0.5 GHz and (d) νe = 1 GHz.The solid line denotes CA belonging to EMW with s polarization and the dashed line denotes CA belonging to EWM with p polarization.The incident angle of the EMW is 20°, the electron peak density is 5 × 10¹⁷ m−3 and the decay constant of electron density L is 0.002 m.The other parameters are listed in table 1.

Figure 9.Full wave simulation model for EMW across the reentry nonuniform plasma sheath.The wave port is placed in the bottom air region and the main wave vector k is set to be normal to the plasma sheath boundary.PMLs are applied to mimic the infinite boundary conditions for EMW.
The power deposition distributions at the altitude of 40 km are shown in figure 12.The difference of the power deposition between s and p polarization is rather small for all the three frequencies.This is consistent with the conclusion deduced from figure 11.As for the power deposition at the altitude of 60 km in figure 13, the power deposition distributions with s and p polarization are different forf=5 GHz andf= 12 GHz.The light fringe in figures 13(d) and (e)caused by resonance between EMW and plasma can be observed.The light fringe vanishes in figure 13(f)because the wave frequencyf= 15 GHz has exceeded the maximum of the plasma frequency and the resonance condition is not satisfied.
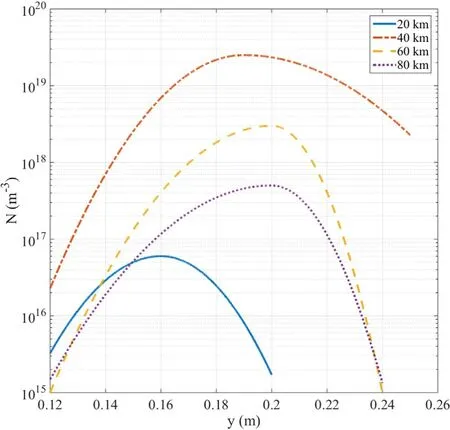
Figure 10.The electron density profiles with different altitudes of the reentry vehicle.

Figure 11.The frequency response of the absorption coefficient for(a)high energy dissipation with altitude of 40 km and 60 km,and(b)low energy dissipation with altitudes of 20 km and 80 km.The solid line denotes CA belonging to EMW with s polarization and the dashed line denotes CA belonging to EWM with p polarization.

Figure 12.EMW power deposition in the plasma sheath at the altitude of 40 km.(a)f = 5 GHz,(b)f = 12 GHz and(c)f = 15 GHz with s polarization.(d) f = 5 GHz, (e) f = 12 GHz and (f) f = 15 GHz with p polarization.
4.Conclusions
In this paper, we analyze the regulation of EMW energy dissipation and power deposition in the plasma sheath based on plane wave and full wave simulation models.The main conclusions deduced from the plane wave simulations can be summarized as follows:

Figure 13.EMW power deposition in the plasma sheath at the altitude of 60 km.(a)f = 5 GHz,(b)f = 12 GHz and(c)f = 15 GHz with s polarization.(d) f = 5 GHz, (e) f = 12 GHz and (f) f = 15 GHz with p polarization.

Table 5.The characteristic parameters of the plasma sheath with different altitudes.
(1) The power deposition profiles with s polarization fall into three categories:f< Min(fpe/cosθ),Min(fpe/cosθ) <f< Max(fpe/cosθ) andf> Max(fpe/cosθ).Whenf< Min(fpe/cosθ), EMW are evanescent all over the plasma sheath and the power deposition concentrates near the plasma sheath boundary.Iff> Max(fpe/cosθ),the power deposition can cover the whole plasma sheath and maximize near the center of the plasma sheath.The power deposition can permeate the plasma sheath inside a certain depth when Min(fpe/cosθ) <f< Max(fpe/cosθ).
(2) The power deposition profiles with p polarization and oblique incident angle concentrate on the first resonance position when the resonance between EMW and electron plasma oscillation takes place in the frequency range of Min(fpe) <f< Max(fpe).When the electron collision frequency increases, the resonance absorption peak of the power deposition profile decreases and broadens.The power deposition rules without resonance are similar to the case of s polarization EMW.
(3) The volume integration of the power deposition results in the absorption coefficient.The characteristics of frequency response of the absorption coefficient are different for s and p polarization EMW.For the s polarization case, the absorption coefficient maximizes near the frequency of Max(fpe/cosθ).The absorption frequency bandwidth becomes narrower with the electron density gradient decreasing.However, increasing the electron collision frequency not only enhances the amplitude peak ofCA, but also enlarges the frequency bandwidth of the absorption coefficient.
(4) For the p polarization case,the absorption coefficient in the frequency band where Min(fpe) <f< Max(fpe)will be much larger than that for s polarization case because of the EMW resonance with electron plasma oscillation.Variation of the plasma density profile or peak density can influence Min(fpe)or Max(fpe)as well as the bandwidth of the absorption coefficient.The effect of the collision frequency on the absorption coefficient for p polarization is similar to s polarization.In addition, the discrepancy between s and p polarization tends to vanish when collision frequency increases.
The regulations above concluded from plane wave simulations can be used to explain the phenomena in the full wave simulations based on the realistic plasma sheath parameters at different altitudes of the reentry vehicle.High energy dissipation occurs at the altitudes of 40 km and 60 km when the wave frequency is close to the plasma frequency.
The resonance of p polarization EMW in the plasma sheath can be distinguished from s polarization at the altitude of 60 km.The results in this paper can be useful in explaining the phenomena relevant to the radar detection of a hypersonic vehicle surrounded by a plasma sheath.
Acknowledgments
This research was partly funded by National Natural Science Foundation of China(Nos.61627901 and 61871302)and the Shaanxi National Natural Science Foundation under Grant No.2019JZ-15.
猜你喜欢
Chinese Physics B(2022年10期)2022-10-26
Plasma Science and Technology(2022年7期)2022-08-01
Plasma Science and Technology(2022年4期)2022-05-05
Plasma Science and Technology(2022年3期)2022-04-15
东坡赤壁诗词(2020年2期)2020-06-04
伴侣(2019年11期)2019-08-09
当代党员(2017年6期)2017-04-07
试题与研究·教学论坛(2016年19期)2016-07-02
学苑创造·C版(2014年8期)2014-11-14
民间文学(2014年3期)2014-06-20
 Plasma Science and Technology2021年1期
- Plasma Science and Technology的其它文章
- First results of negative ion extraction with Cs for CRAFT prototype negative beam source
- Manipulation and optimization of electron transport by nanopore array targets
- Modulational instability of the coupled waves between fast magnetosonic wave and slow Alfvén wave in the laser-plasma interaction
- Dense positrons and γ-rays generation by lasers interacting with convex target
- Linear gyrokinetic simulations of reversed shear Alfvén eigenmodes and ion temperature gradient modes in DIII-D tokamak
- Design and performance study of a gas-Cherenkov detector with an off-axis parabolic reflector for inertial confinement fusion experiments