
Revisiting the evolutionary history of domestic and wild ducks based on genomic analyses
2021-03-01 06:51XingGuoXinXinHeHongChenZhiChengWangHuiFangLiJiangXianWangMingShanWangRunShenJiang
Zoological Research 2021年1期
Xing Guo ,Xin-Xin He ,Hong Chen ,Zhi-Cheng Wang ,Hui-Fang Li ,Jiang-Xian Wang ,Ming-Shan Wang,Run-Shen Jiang,*
1 Anhui Province Key Laboratory of Local Livestock and Poultry Genetic Resource Conservation and Bio-breeding, Anhui Agricultural University, Hefei, Anhui 230036, China
2 Jiangsu Institute of Poultry Science, Chinese Academy of Agriculture Science, Yangzhou, Jiangsu 225125, China
3 Howard Hughes Medical Institute, University of California Santa Cruz, Santa Cruz, CA 95064, USA
4 Department of Ecology and Evolutionary Biology, University of California Santa Cruz, CA 95064, USA
ABSTRACT Although domestic ducks have been important poultry species throughout human history,their origin remains enigmatic,with mallards and/or Chinese spot-billed ducks being proposed as the direct wild ancestor(s) of domestic ducks.Here,we analyzed 118 whole genomes from mallard,Chinese spotbilled,and domestic ducks to reconstruct their evolutionary history. We found pervasive introgression patterns among these duck populations.Furthermore,we showed that domestic ducks separated from mallard and Chinese spotbilled ducks nearly 38 thousand years ago (kya) and 54 kya,respectively,which is considerably outside the time period of presumed duck domestication.Thus,our results suggest that domestic ducks may have originated from another wild duck population that is currently undefined or unsampled,rather than from present-day mallard and/or Chinese spot-billed ducks,as previously thought.Overall,this study provides new insight into the complex evolution of ducks.
Keywords:Duck; Population structure; Demographic histories; Domestication
INTRODUCTION
Ducks are among the most economically important waterfowl species in the world and provide a source of high-quality protein for many people (Huang et al.,2013).China is thought to be one of the major centers of duck domestication (Hitosugi et al.,2007; Larson et al.,2014).Based on archaeological evidence, the domestication of ducks took place approximately 1 000–2 500 years ago (Museum,1979).However,there are 14 taxa recognized in the mallard complex(Lavretsky et al.,2014),among which mallards and spot-billed ducks, two ecologically important and geographically widespread species,are more closely related than any other wild species to modern domestic ducks (Hou et al.,2012; Li et al.,2010).A recent study on mtDNA D-loop sequence variation among 50 duck breeds from eight countries suggested that domestic ducks are descended from wild mallards (Hou et al.,2012).Furthermore,based on 12 microsatellite markers of 958 ducks,Zhang et al.(2014) also suggested a single origin for the domestic duck from wild mallards.However,comparisons of polymorphisms within 667 bp mtDNA D-loop sequences from 26 Chinese domestic duck breeds and two wild duck species showed that both mallards and Chinese spot-billed ducks are wild ancestors of domestic ducks (Li et al.,2010).This result is supported by analysis of mtDNA data from Korean ducks (Jin et al.,2014).However,despite considerable effort,the origin and the evolutionary history of domestic ducks are still under debate.
The main factor confounding our understanding of these issues is that the evolutionary history of wild ducks,particularly that of mallards and Chinese spot-billed ducks,is incomplete.Mallards and Chinese spot-billed ducks are phenotypically distinct (Wang et al.,2019).However,recent studies have shown that these two wild duck species are only weakly genetically differentiated.For instance,based on data from 20 nuclear loci,Lavretsky et al.(2014) found that Chinese spot-billed ducks are indistinguishable from Eurasia mallards (ΦST=0),in agreement with Wang et al.(2019),who reported low levels of divergence for the two species with averageFSTvalues of 0.014.Moreover,mallards and Chinese spot-billed ducks can hybridize in nature (Kulikova et al.,2003;Wang et al.,2019),which complicates the evolutionary histories of these wild species and domestic ducks.
Most previous research on duck evolutionary history is based on mtDNA and short nuclear segments.Due to its uniparental inheritance, mtDNA is sensitive to genetic drift/bottlenecks,sex-biased selection,and admixture,and therefore shows low efficiency in the reconstruction of complete evolutionary histories,especially with respect to domestication (Larson & Burger,2013; Park et al.,2015;Wang et al.,2014; Zhang et al.,2020).Additionally,short nuclear segments provide limited information and low resolution in clarifying the complex evolutionary history of species, especially for population pairs with weak differentiation.In recent years,the reference genomes of many domestic species (e.g.,chickens,ducks,dogs,goats,pigs,horses) have been published (Dong et al.,2013;Groenen et al.,2012; Hillier et al.,2004; Huang et al.,2013;Lindblad-Toh et al.,2005; Orlando et al.,2013).With the rapid development of whole-genome sequencing technologies and considerable reductions in the costs of sequencing,resequencing the genomes of individuals at the population scale has become a reality.Analyses based on genome-wide data have revolutionized research on the evolutionary histories of domestic animals.For example,based on mtDNA data,chickens are thought to have undergone multiple,independent domestications in South and Southeast Asia (Liu et al.,2006;Miao et al.,2013).However,large-scale whole-genome data have also revealed that domestic chickens are derived fromGallus gallus spadiceus,which is predominantly distributed in southwestern China,northern Thailand,and Myanmar (Wang et al.,2020).A similar case has also been reported in domestic dogs,with mtDNA analysis inconsistent with an East Asian origin 15 thousand years ago (kya) (Savolainen et al.2002) or European domestication 18.8 kya to 32.1 kya(Thalmann et al.,2013).Furthermore,whole-genome data suggest that dogs originated from southern East Asian wolves 33 kya (Wang et al.,2016).Whole-genome data analyses have uncovered the genetic basis underlying remarkable behavioral,physiological,and morphological traits,and have been applied in many domestic species (Guo et al.,2016;Plassais et al.,2019; Wang et al.,2016).Whole-genome resequencing has also been applied in duck genomic research.For instance,Zhang et al.(2018) performed comparative population genomics between domestic ducks and mallards and identified several positive selection genes that affect brain and neuronal development in domestic ducks.By sequencing 1 132 genomes,Zhou et al.(2018) performed genome-wide association study (GWAS) and selective sweeps analysis and revealed that theMITFandIGF2BP1genes are associated with plumage color and body size in ducks.However,the aforementioned studies mainly focused on the genetic basis underlying specific traits,and our understanding of the evolutionary history of mallards,Chinese spot-billed ducks,and domestic ducks at the genome-wide scale remains limited.In this study,we analyzed 118 whole genomes of mallards,Chinese spot-billed ducks,and domestic ducks to investigate the genetic structure and evolutionary history of the two wild species and to determine whether modern ducks originated from mallards and/or Chinese spot-billed ducks.
MATERIALS AND METHODS
Samples,read mapping,and single-nucleotide polymorphism (SNP) calling
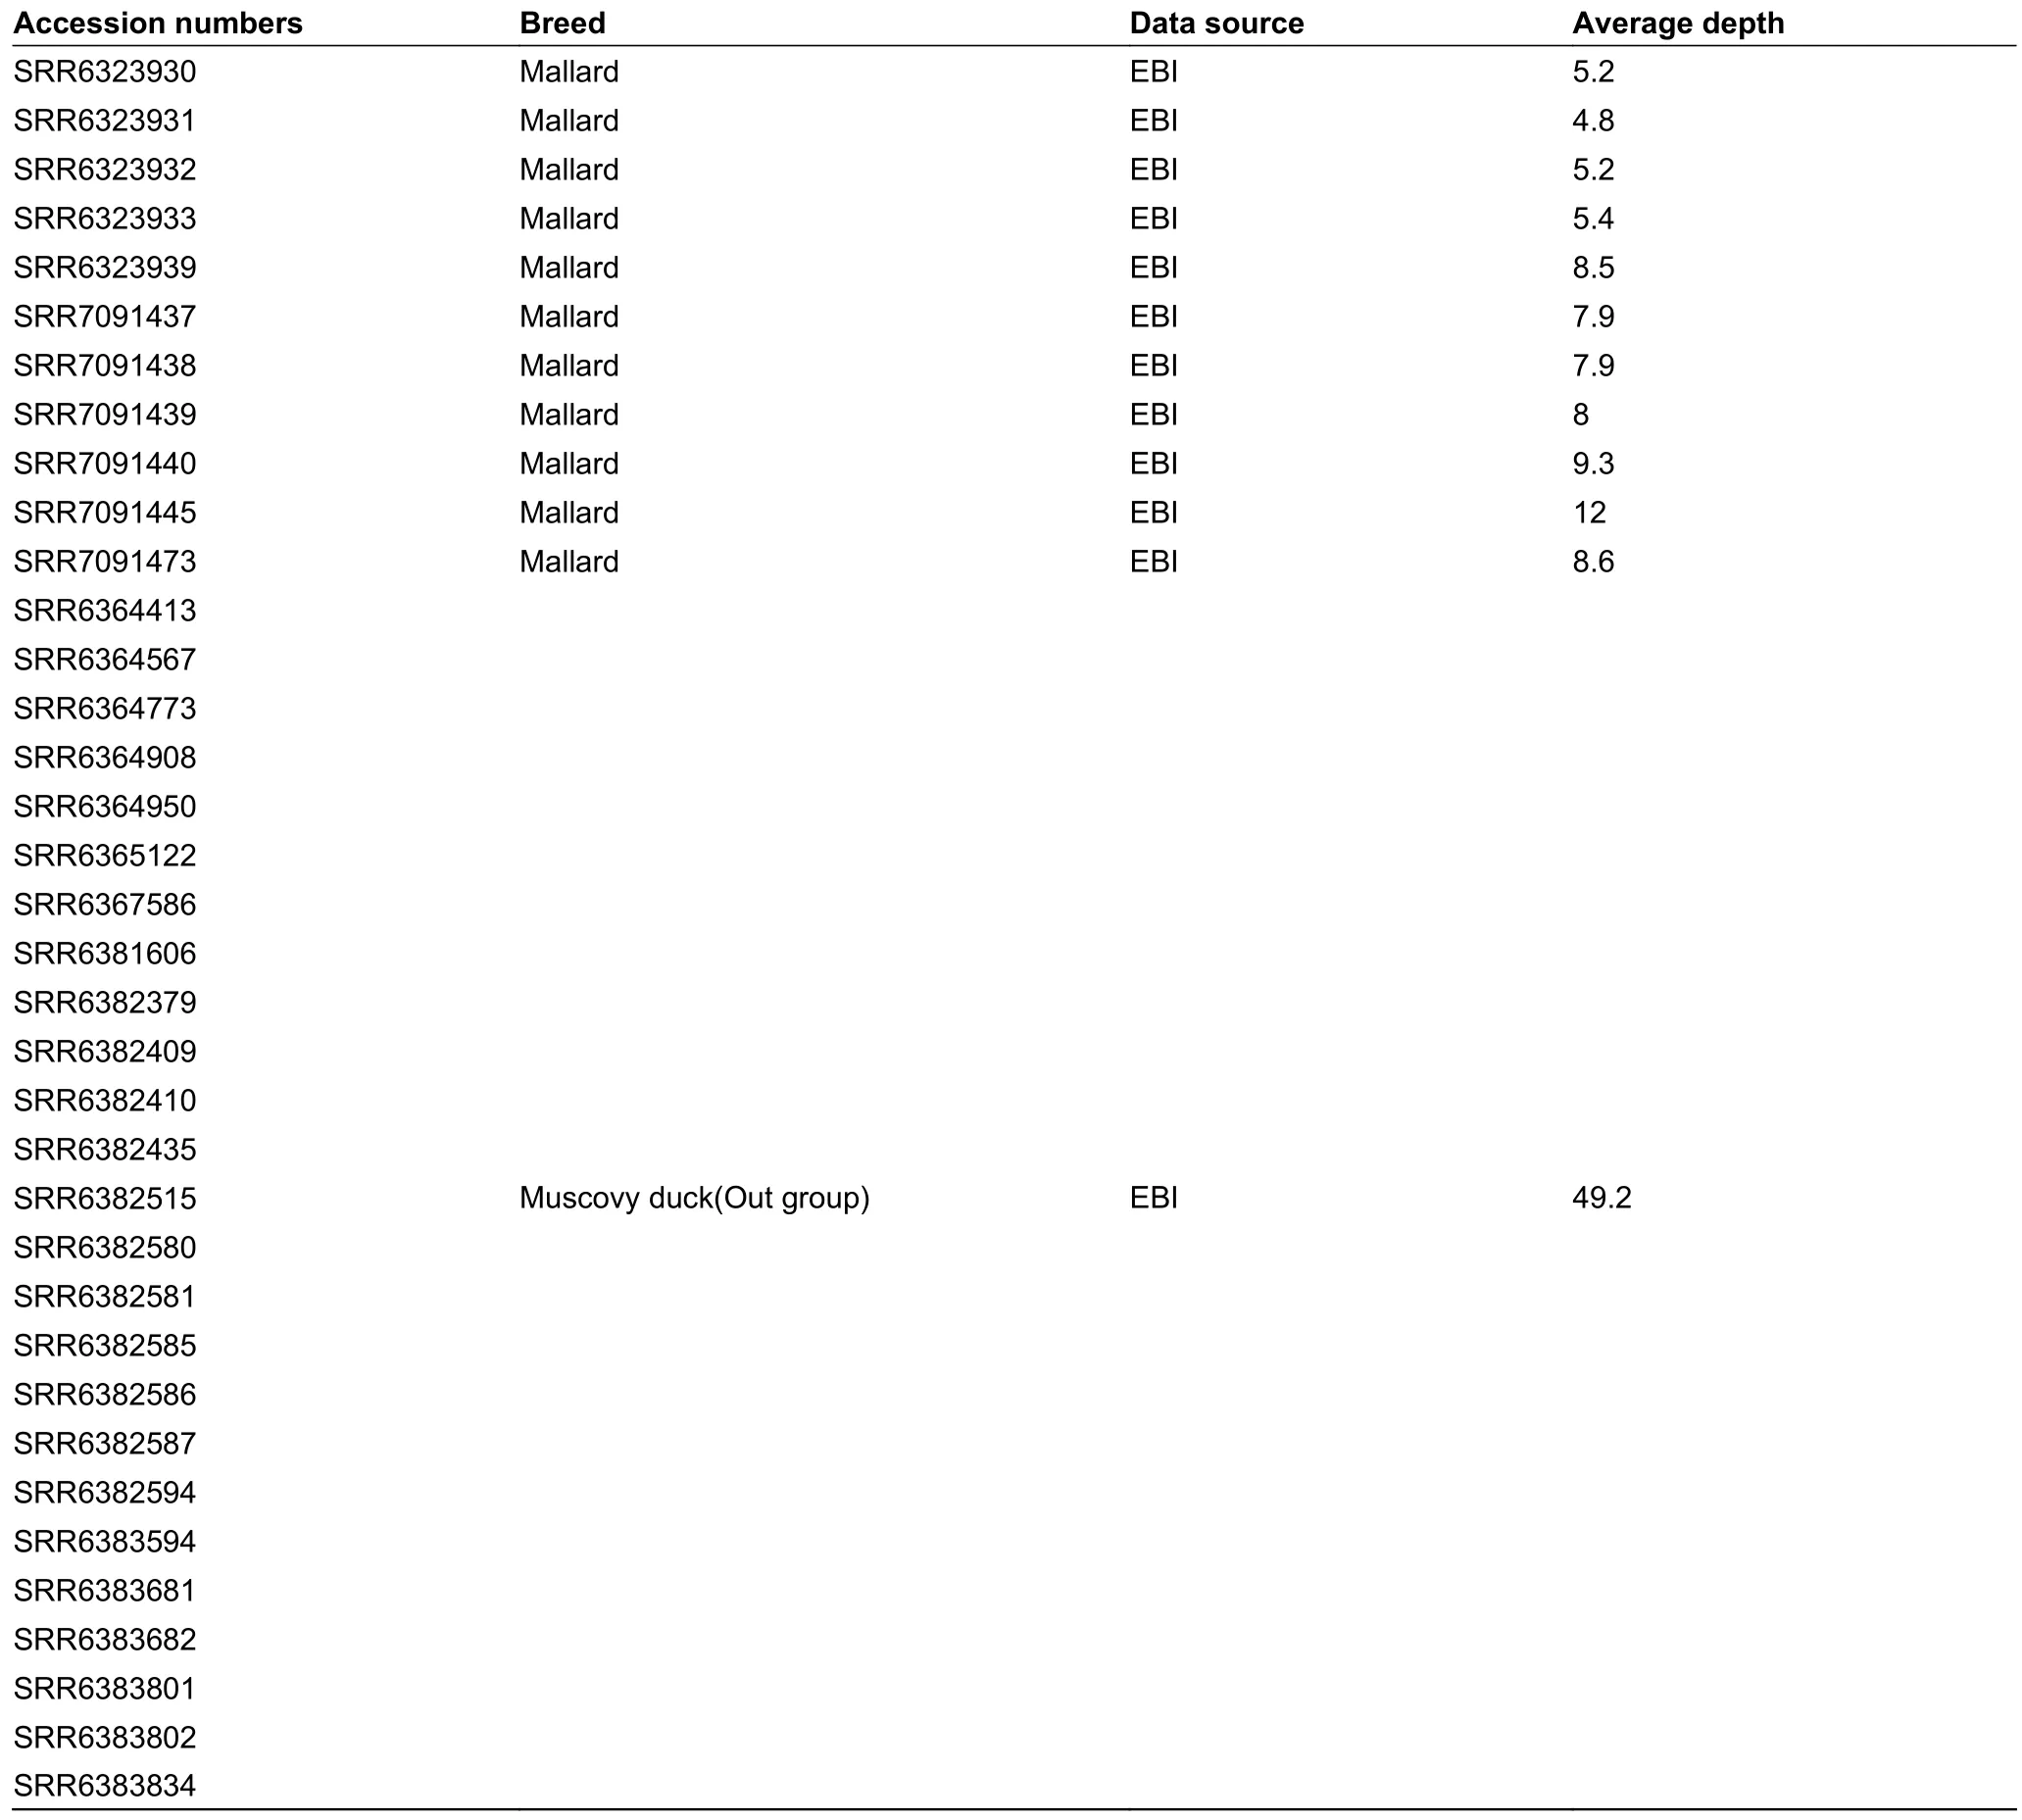
Domestic ducks are generally bred for egg laying,meat production,or both (dual-purpose) (Zhang et al.,2018).Recent molecular data have indicated that meat,egg,and dual purpose-type ducks were domesticated from mallards and/or Chinese spot-billed ducks (Li et al.,2010).To reconstruct the evolutionary history of these duck populations,we downloaded the genomic data of 118 ducks from the EBI(https://www.ebi.ac.uk/ena) and GSA databases (http://bigd.big.ac.cn/gsa/),including one Muscovy duck,eight Chinese spot-billed ducks (eastern spot-billed duck),25 mallards,38 meat-type ducks (MET) (8 Cherry valley,22 Pekin,and 8 maple leaf ducks),and 46 egg and dual purpose-type ducks(EDT) (11 Jinding,8 Shanma,16 Shaoxing,and 11 Gaoyou ducks) (Zhang et al.,2018; Zhou et al.,2018).The geographic distribution of these samples is provided in Supplementary Figure S1 and sample information is described in Supplementary Table S1.
Low-quality bases with Phred-quality scores<20 were discarded using Btrim with parameters "-s -a 20–q" (Kong,2011).The BWA-MEM algorithm (Li,2014) was then used to map the high-quality reads to the duck reference genome(Zhou et al.,2018) with default settings,except the “-t 6–M–R<$readgroup>” options.The bam alignment files were sorted,and multiply aligned reads were removed.SNP calling was performed using UnifiedGenotyper with default parameters,and filtering was performed with VariantFiltration tools(“QUAL<40.0 MQ<25.0 MQ0≥4 & ((MQ0/(1.0*DP))>0.1) -cluster 3 -window 10”) in GATK (McKenna et al.,2010).
Population diversity,structure,and relationships
We used VCFtools v0.1.13 (Danecek et al.,2011) with nonoverlapping 50 kb windows (--window-pi 50 000) to estimate nucleotide diversity (π) for each domestic breed and the two wild populations.Linkage disequilibrium (LD) was estimated using PLINK (Chang et al.,2015) based on eight individuals from each duck population.We only used SNPs with minor allele frequencies (MAF) greater than 0.05.To explore the relationships between the different duck populations,principal component analysis (PCA) was performed based on autosomal SNPs using genome-wide complex trait analysis(GCTA) (Yang et al.,2011).The SNPs were pruned using PLINK with the settings “--indep-pairwise 50 10 0.1”.The genetic relationship matrix was calculated with the “--makegrm” option,and then three principal components were estimated with the “--pca3” option.To reveal the phylogenetic relationships of all ducks,MEGA7 (Kumar et al.,2016) and FastTree (Price et al.,2010) were employed to construct neighbor-joining (NJ) and maximum-likelihood (ML) trees with 100 bootstraps.We also used VCFtools v0.1.13 (Danecek et al.,2011) with non-overlapping 50 kb windows (--fst-windowsize 50 000) to estimate theFSTbetween all possible pairwise combinations. ADMIXTURE was used to estimate the population structure of the two wild duck species (Kwas assumed to range from 2 to 10),followed by the addition of the domestic ducks withKvalues ranging from 2 to 11(Alexander et al.,2009).The estimated ancestry for each cluster was visualized using the ggplot2 R package.
Introgression analysis
D-statistics (Patterson et al.,2012) were used to verify the existence of gene flow between wild and domestic ducks and between mallards and Chinese spot-billed ducks.D-statistics are also known as the ABBA-BABA test.Given a topology (O,(P3,(P1,P2))),the ABBA pattern reflects gene flow between P3 and P1,whereas BABA events reflect gene flow between P3 and P2.Significance is expressed asZ-scores,which are generally considered significant when their absolute values are higher than 3.To determine the gene flow between mallards and Chinese spot-billed ducks,we used Muscovy ducks as the outgroup (O) and mallard,Chinese spot-billed,and domestic duck breeds as the P3,P1,and P2 groups,respectively.A negativeDvalue withZ-score<–3 indicates admixture between mallards and Chinese spot-billed ducks,whereas a positiveDvalue withZ-score>3 indicates admixture between mallards and domestic ducks.We also estimated the genetic introgression between Chinese spotbilled and domestic ducks and between mallards and domestic ducks in the form ofD(Muscovy duck,Chinese spotbilled duck; P1,P2) andD(Muscovy duck,mallard; P1,P2),respectively,where P1 and P2 represent different domestic duck groups.
Demographic history and coalescent simulation
We performed pairwise sequentially Markovian coalescent(PSMC) analysis (Li & Durbin,2011) with the setting "-N25 -t15 -r5 -b -p ‘4+25*2+4+6’" to infer the demographic history of mallards,Chinese spot-billed ducks,and domestic ducks(highest coverage individual genomes from each group,Supplementary Table S1).A generation time (g) of 1 year and a mutation rate per generation ofμ=1.91×10⁻⁹(Zhang et al.,2018) per base pair per year were used for analysis.Multiple sequentially Markovian coalescent (MSMC) analysis (Schiffels& Durbin,2014) was used to estimate the divergence time between wild and domestic ducks.The ggplot2 R package was used to visualize the PCA plot.
We used fastsimcoal2 (Excoffier et al.,2013) based on joint frequency spectrum data to deduce the recent demographic history of duck populations.EasySFS (https://github.com/isaacovercast/easySFS#easysfs) was used to convert variant call format (VCF) to the fastsimcoal2-style site frequency spectrum.Four models were considered,two of which depicted all modern ducks as being domesticated from Chinese spot-billed ducks or mallards,while the other two indicated that domestic ducks originated from a "ghost" duck.Simulations were run with the parameters “-n 100 000 -N 100 000-d -M 0.001 -l 10 -L40 -q -c 8”.For each model,100 repeat runs with varying starting points were performed to ensure convergence.The best model was selected according to the Akaike information criterion (AIC).
Simulation analysis of bottleneck effects on MSMC estimation
Recent artificial selection,management,and inbreeding have likely induced bottlenecks during the evolutionary history of domestic animals.Here,we performed simulations to clarify whether bottlenecks have affected our estimation of the relative cross-coalescent rate by MSMC.The software ms(Hudson,2002) was used,with the command for simulation as follows:/ms 4 100 -t 2 292 -r 960 30 000 000 -I 2 2 2 -n 1 X -n 2 2 -en 0.075 1 2 -ej 0.25 1 2 -en 0.25 2 4 -p 7,with X=0.25,0.5,1,and 1.5 indicating that the current population size is 12.5%,25%,50%,and 75% of the ancestral population size(2N0),respectively.
RESULTS AND DISCUSSION
Genetic diversity,population relationships,and structure
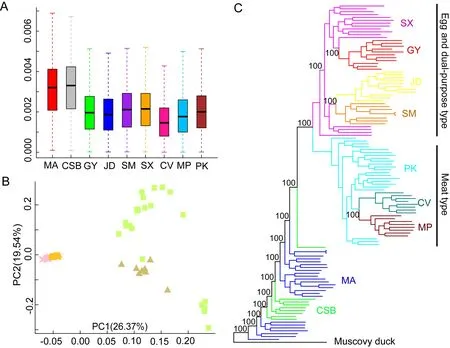
Figure 1 Population relationships and structures of ducks
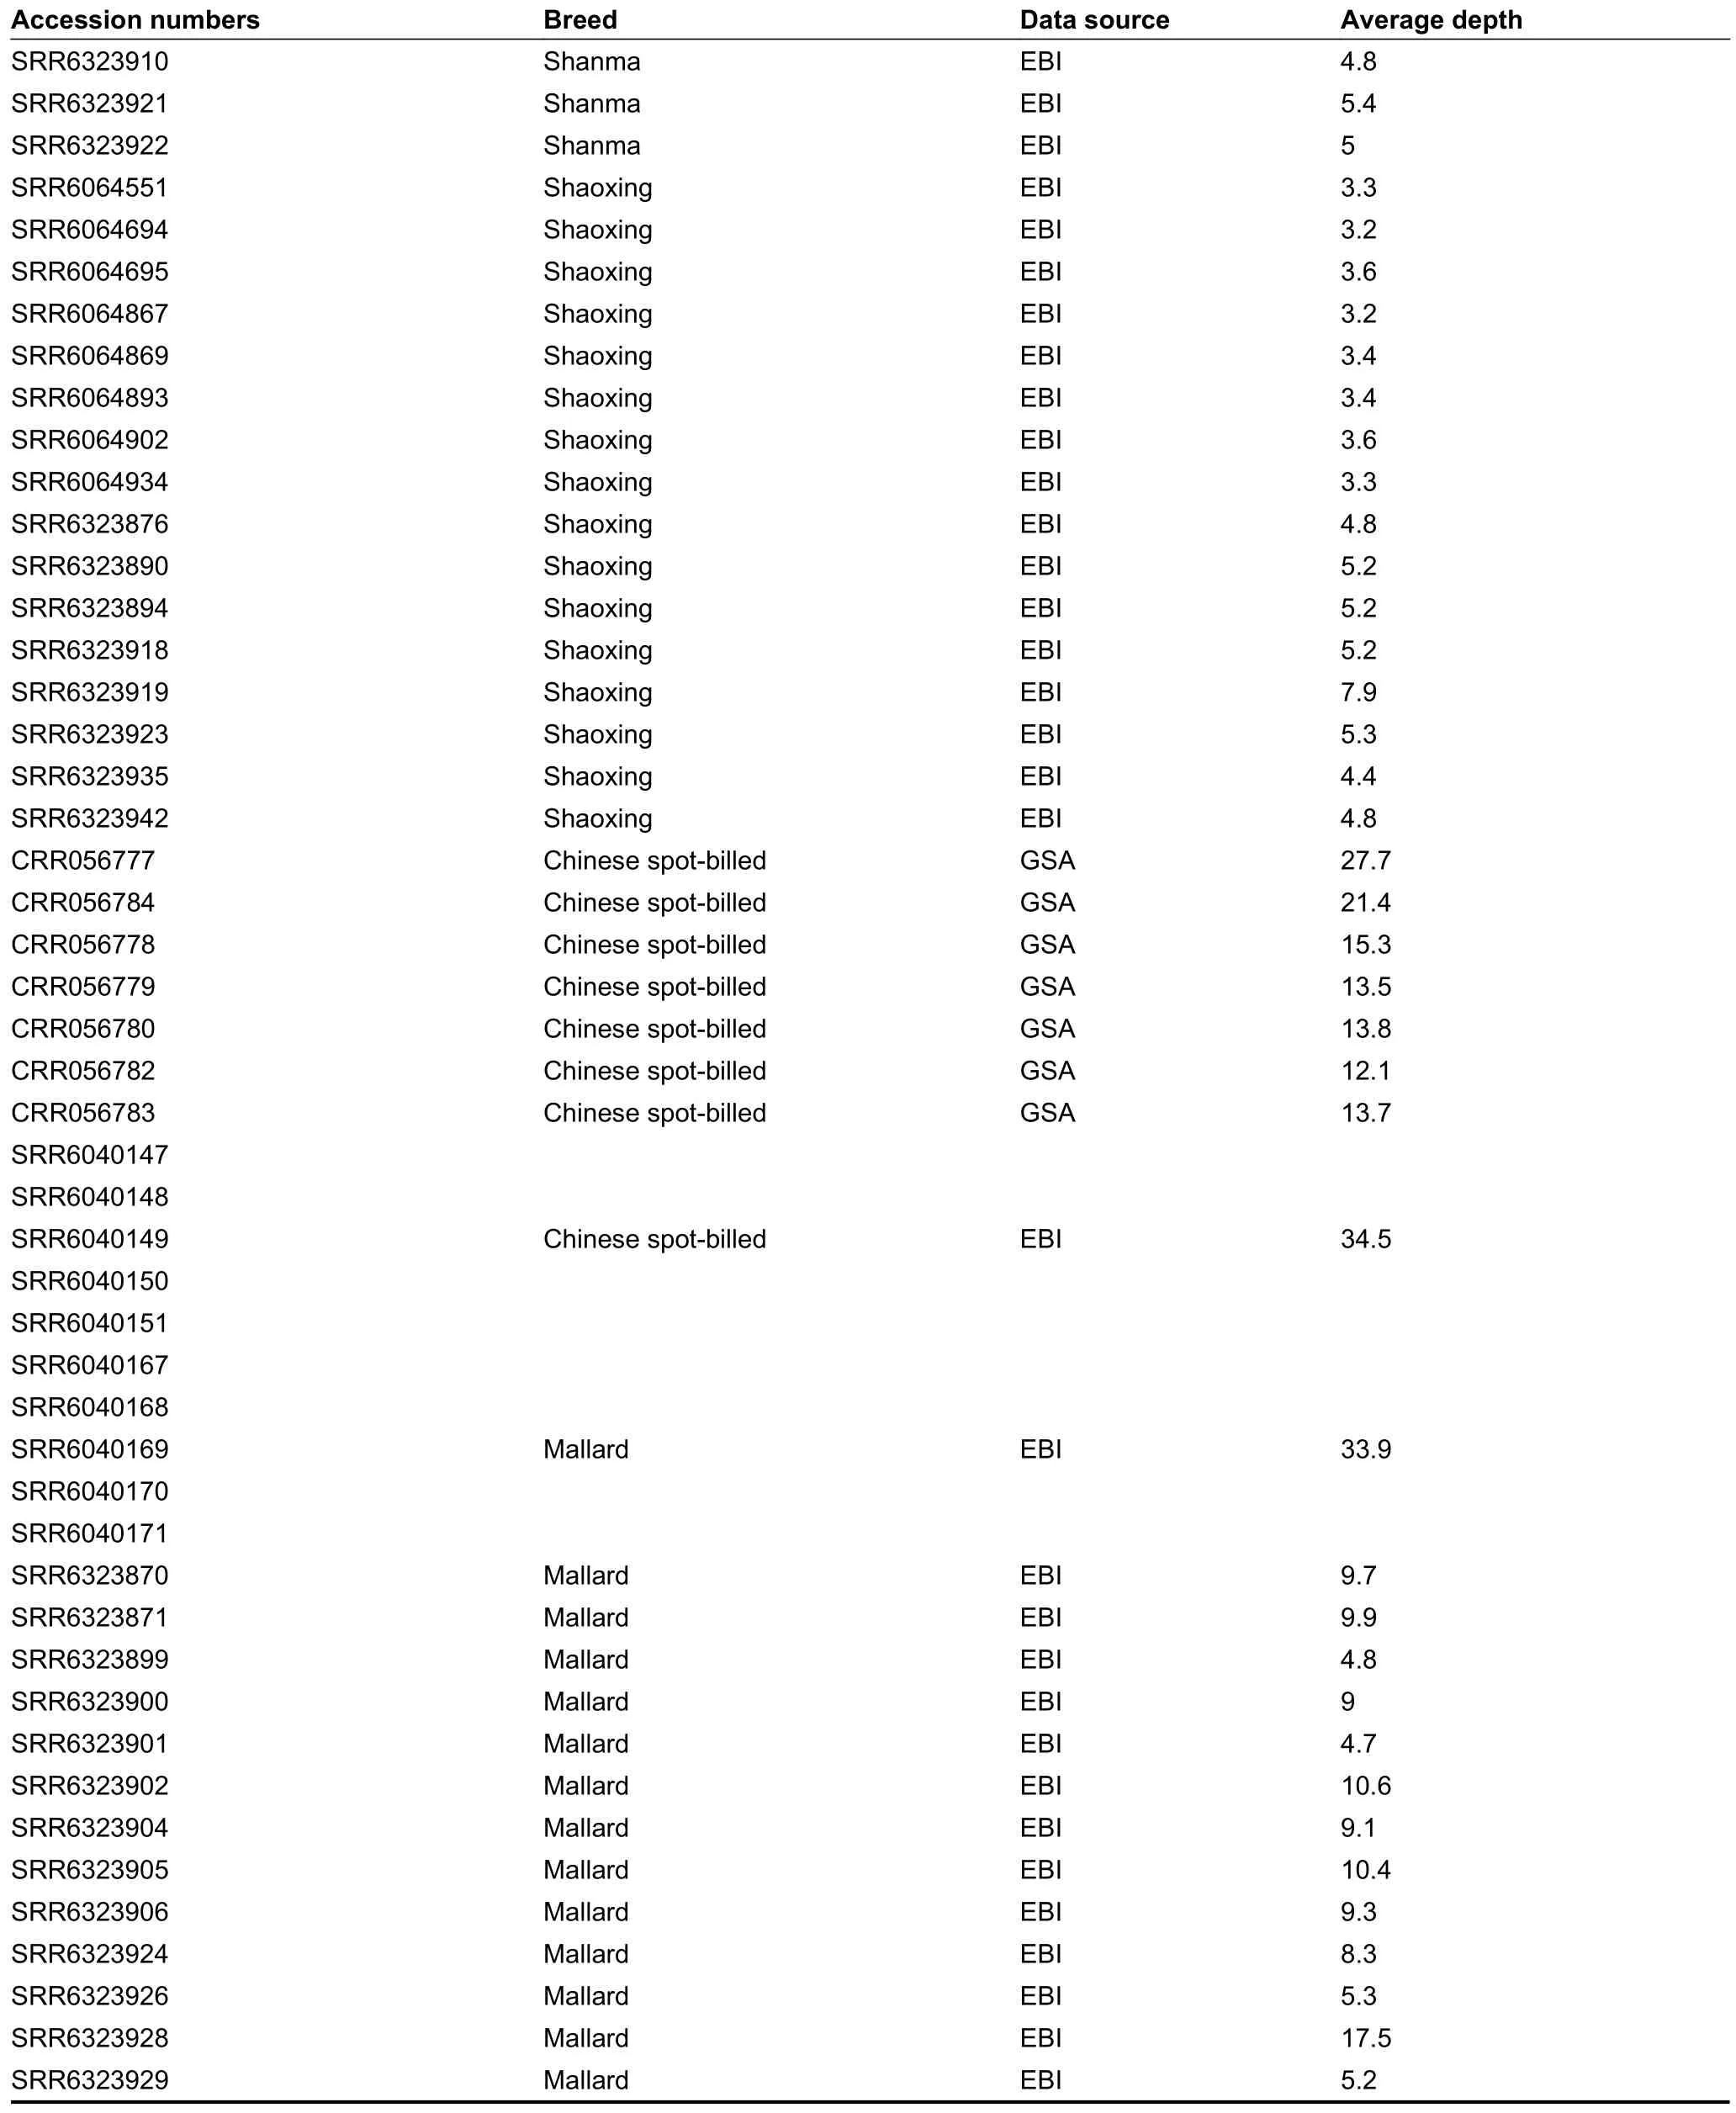
A total of 118 whole-genome sequences were analyzed in this study.After mapping the reads to the duck reference genome(Zhou et al.,2018),the average sequencing depth for the genomes was estimated at~7.5×,ranging from 3.2× to 33.9×(Supplementary Table S1). After alignment and quality filtration,more than 14.47 million SNPs were obtained and used for subsequent analysis.We estimated the nucleotide diversity (π) for each population and found that mallards and Chinese spot-billed ducks had higher levels of nuclear diversity than domestic ducks (Figure 1A).Domestic ducks also showed weaker LD decay than the two wild duck species(Supplementary Figure S2).These results are similar to observations reported in other species such as chickens(Wang et al.,2017) and dogs (Wang et al.,2016),suggesting that domestic ducks likely experienced a bottleneck during domestication and management. To clarify the genetic relationships among these populations,we performed PCA(Yang et al.,2011).The main component of genetic variation(PC1) clearly distinguished the wild ducks (Chinese spot-billed ducks and mallards) from the domestic ducks.Within the domestic ducks,EDT and MET were grouped as separate clusters,suggesting potential genetic differentiation within the two populations.We also found that some mallard and Chinese spot-billed duck individuals clustered together(Figure 1B).Population structure analysis using ADMIXTURE(Alexander et al.,2009) showed that Chinese spot-billed ducks and mallards share ancestry (Figure 2A and Supplementary Figures S3,S4),corroborating earlier work based on mtDNA (Wang et al.,2019).Specifically,whenK=2,we found a division between the wild and domestic ducks,whereas the Chinese spot-billed ducks and mallards both harbored a component found predominantly in modern ducks(Figure 2B).WhenK=3,we detected a division between EDT and MET.Furthermore,up toK=11,Chinese spot-billed ducks and mallards presented their own components (Figure 2B).These results suggest that Chinese spot-billed ducks and mallards are closely related.
Both PCA and admixture approaches infer genetic clusters based on data and cannot be used to infer phylogenetic relationships. Therefore, we constructed ML and NJ phylogenetic trees based on whole-genome variants.The mallards and Chinese spot-billed ducks were monophyletic and intermixed,which was strongly supported in both NJ and ML analyses (bootstrap score=100) (Figure 1C and Supplementary Figure S5).Relationships between domestic ducks were identical in both analyses with high bootstrap support (bootstrap score=100).All domestic ducks clustered together and formed a monophyletic clade sister to wild ducks,consistent with previous research (Zhou et al.,2018),suggesting that modern ducks originated from single domestication.Moreover,we found that theFSTvalues for mallards and spot-billed ducks were extremely low (~0.01,Supplementary Figure S6),suggesting low differentiation.Altogether,these results support a close genetic relationship for the two wild populations,such that it was difficult to distinguish which wild duck group was most closely related to domestic ducks.
Introgression between two wild populations and between wild and domestic duck populations
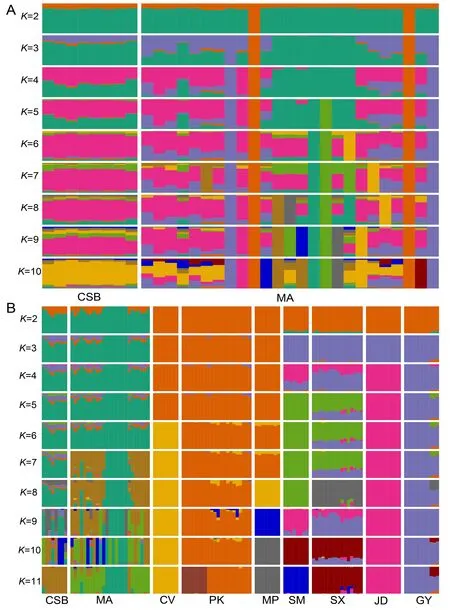
Figure 2 Admixture analysis of mallards and Chinese spot-billed ducks (A) and mallards,Chinese spot-billed ducks,and domestic ducks (B)
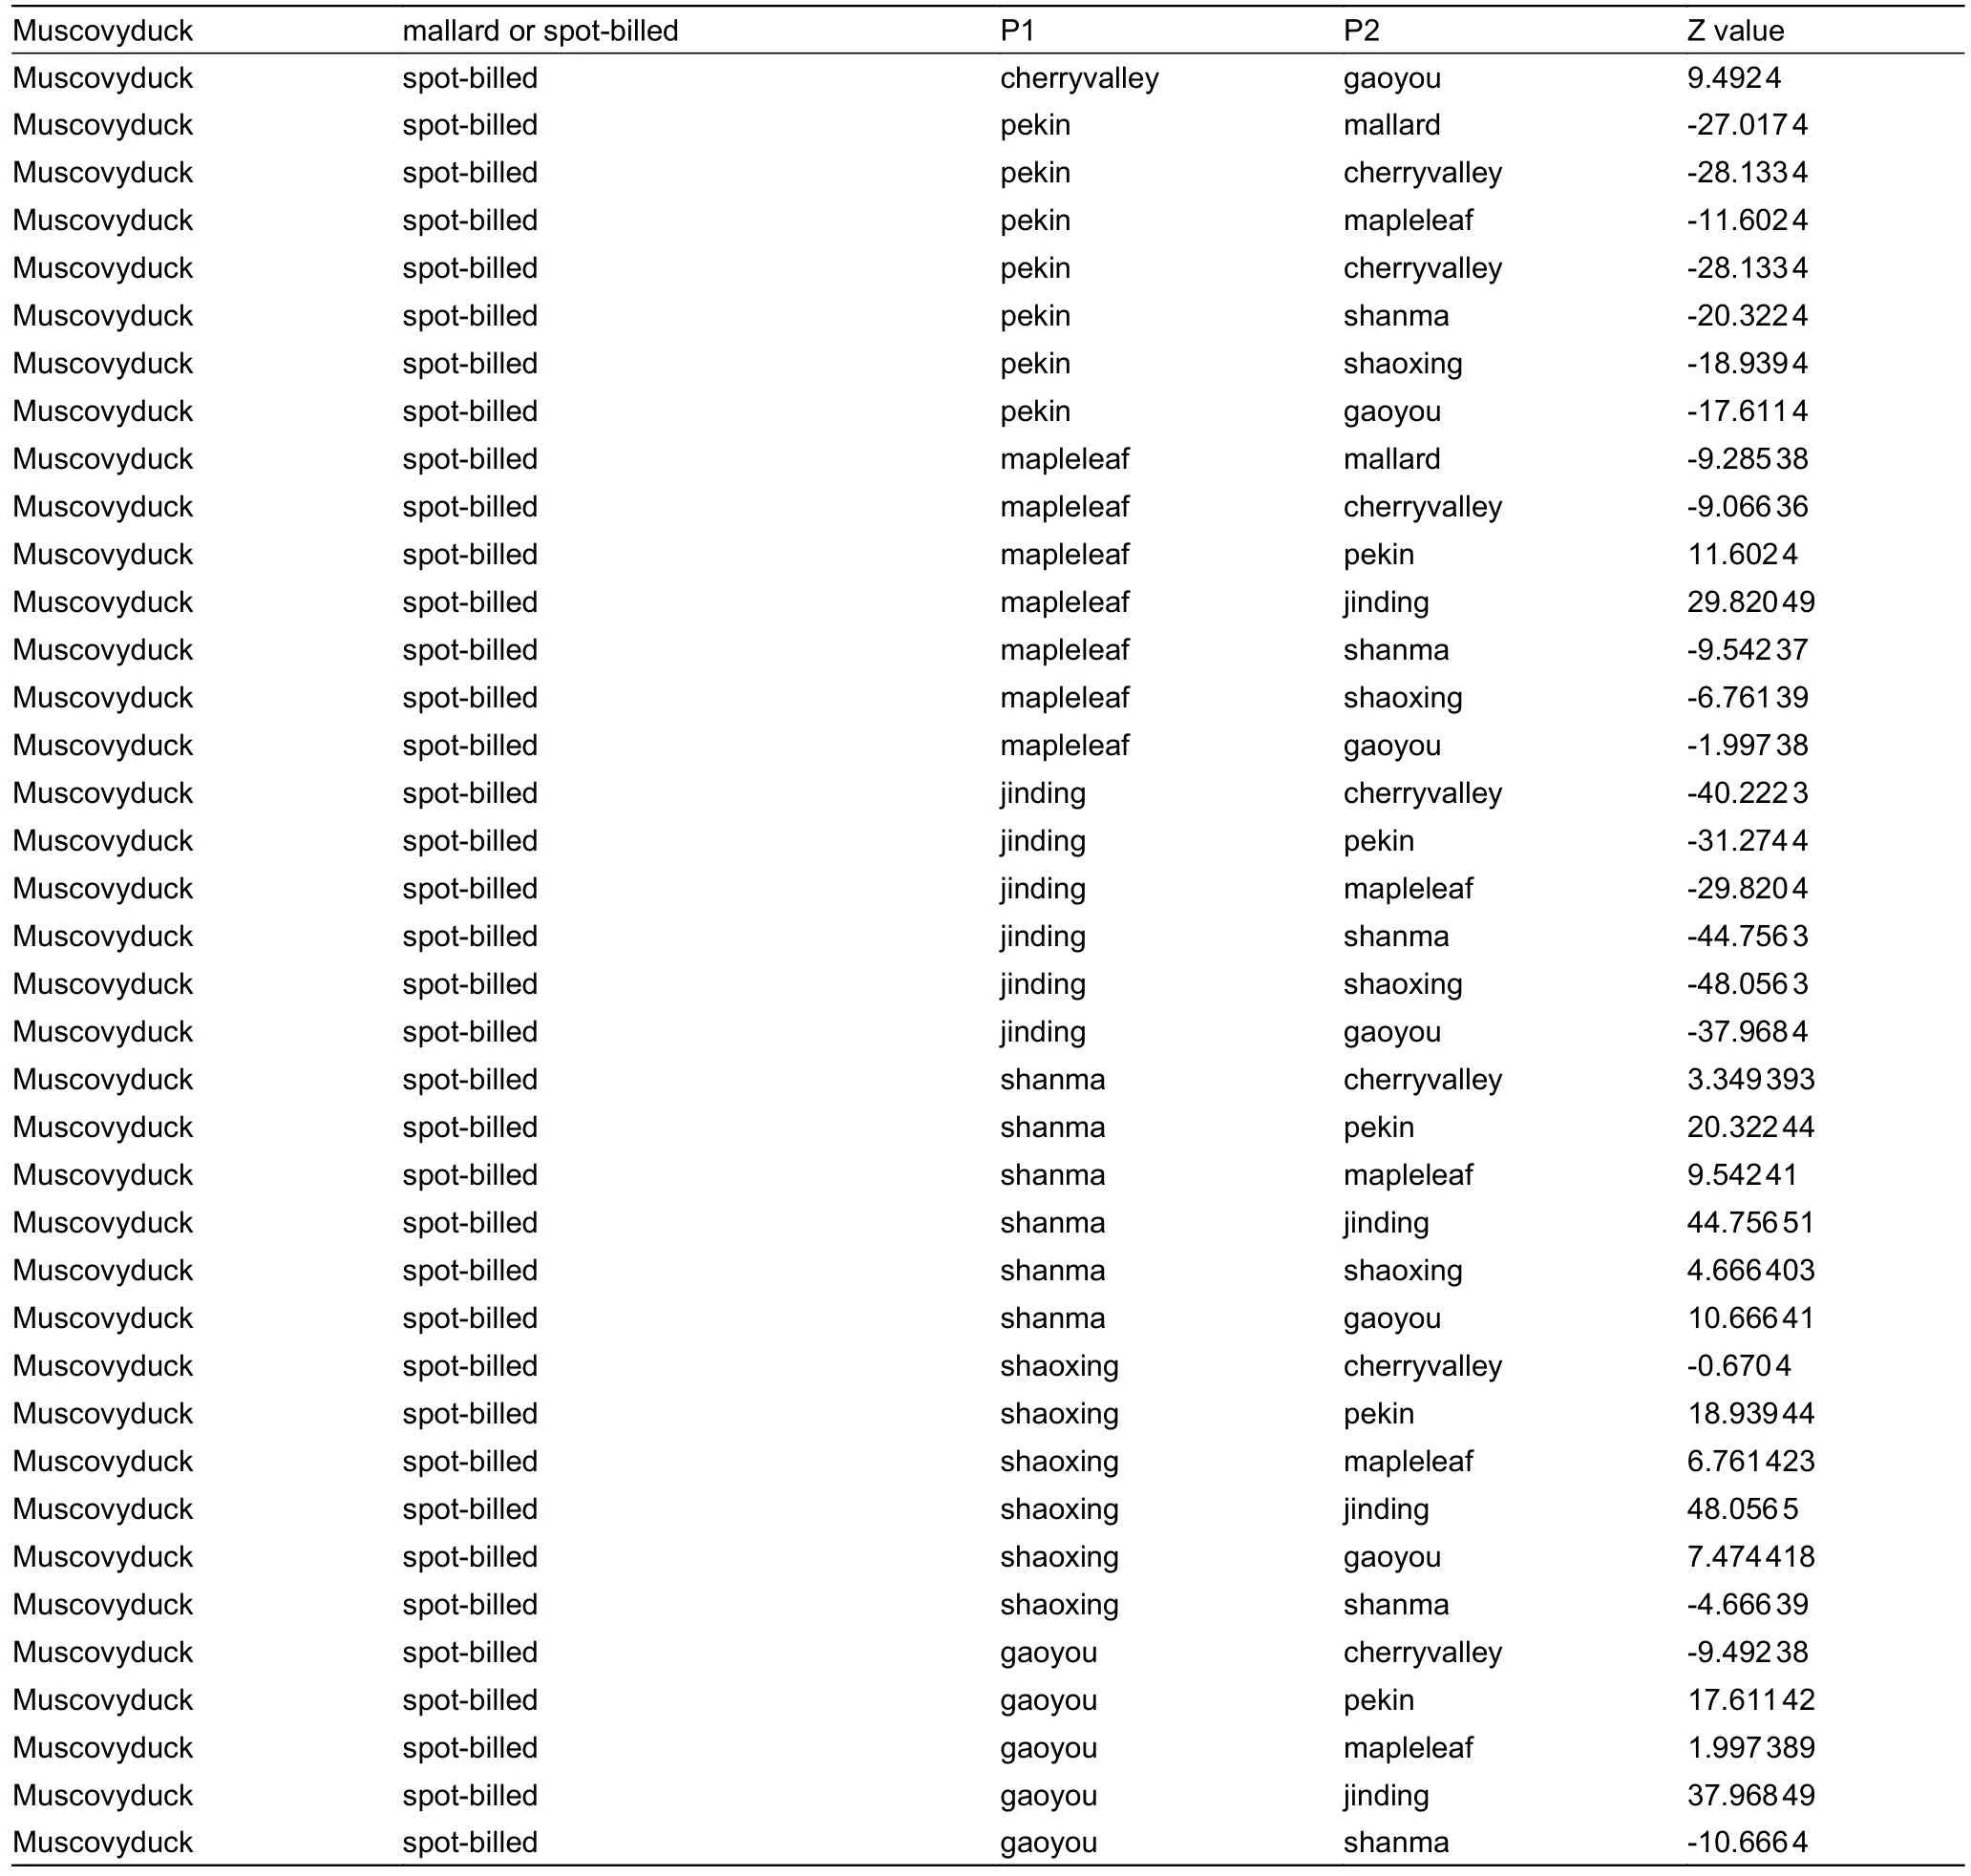
We performed D-statistics (Patterson et al.,2012) in the form ofD(Muscovy duck,mallard,Chinese spot-billed duck,P2) to verify the existence of gene flow between Chinese spot-billed ducks and mallards.When P2 represented Cherry valley,Shanma,Shaoxing,and Gaoyou domestic breeds,it yielded significantly negativeZ-scores ranging from–17.8 to–6.1,indicating that Chinese spot-billed ducks were admixed with mallards (Supplementary Figure S7).Additionally,we also performed D-statistics in the form ofD(Muscovy duck,mallard; P1,P2) andD(Muscovy duck,Chinese spot-billed duck; P1,P2) to test for admixture between wild and domestic ducks.Our results suggested pervasive introgression patterns between the domestic and wild ducks (Supplementary Table S2).For example,when P3,P2,and P1 represented mallard,Shaoxing,and other domestic ducks,respectively,they yielded scores ranging from–20.1 to–4.6.These results are not surprising as hybridization is common in birds (Grant &Grant,1992),particularly in Anatidae (Lavretsky et al.,2020;Muñoz-Fuentes et al.,2007; Peters et al.,2007).Mallards have a wide distribution,spanning the British Isles through Europe and Russia to northern Japan and northeastern China,while spot-billed ducks are abundant in northern and western China,the Korean Peninsula,and Japan (Kulikova et al.,2003).In some regions,their distribution range overlaps and hybridization between the two species has been pervasive and frequent.During the last decade,spot-billed duck and mallard hybridization has been reported in Khanka Lake and Hong Kong (Kulikova et al.,2003).The complex introgression patterns among these duck populations may confound domestic duck origin and evolutionary history results when using mtDNA and short nuclear segments.
Demographic history and divergence time
If domestic ducks originated from one of the two wild duck species,we would expect them to have a demographic history similar to that of wild ducks before the Holocene (Larson et al.,2014).We used PSMC analysis (Li & Durbin,2011) to estimate the evolution of historical effective population sizes(Ne) of the wild and domestic ducks.Domestic ducks were found to have undergone a moderate expansion ofNe beginning approximately one million years ago (mya),which peaked~120 kya and then declined for an estimated period of tens of thousands of years (Figure 3A).The two wild duck populations showed similarNe trajectories.TheNe for Chinese spot-billed ducks and mallards increased~1 mya and reached a maximum~40 kya,after which it contracted dramatically (Figure 3A).TheseNe fluctuations are similar to those observed in chickens and ostriches (Nadachowska-Brzyska et al.,2015; Wang et al.,2015).During the Mid-Brunhes event (430–110 kya),an interglacial period in which the climate was warm,many species showed population size expansion.However,when entering the last ice age (110–10 kya),global temperatures declined drastically (Kozma et al.,2016), which induced loss of habitat and distribution contraction for many species,resulting in reductions in population size (Nadachowska-Brzyska et al., 2015).Therefore,we suggest that,similar to other birds,climate change during the most recent glaciations likely affected theNe of ducks.
To our surprise,the evolutionary trajectories of the two wild duck populations were found to be distinct from those of domestic ducks beginning 100 kya (Figure 3A).We used MSMC analysis (Schiffels & Durbin,2014) to measure the divergence time between the wild and domestic ducks.Results showed that domestic ducks separated from mallards and Chinese spot-billed ducks nearly 38 kya and 54 kya(based on CCR=0.5) (Figure 3B),respectively,which are largely outside the time period of animal domestication and presumed duck domestication (Hitosugi et al.,2007; Larson et al.,2014).However,MSMC estimation mainly depends on the number and density of heterozygotes,and strong selection in modern ducks may have induced the accumulation of homozygotes and a reduction in heterozygotes,thereby confounding our estimation.To test this,we performed simulations using a model with two populations (split 10 kya),in which one experienced multiple bottleneck events beginning 3 kya (Hitosugi et al.,2007).The obtained estimates indicated that our MSMC analysis was sufficient for estimating divergence (Figure 3C,D).These results suggested that Chinese spot-billed ducks and mallards are unlikely to be the wild relative from which domestic ducks descended.Thus,we used the joint site frequency spectrum (SFS) approach implemented in fastsimcoal2 to compare four scenarios.The simulation results also supported the origination of domestic ducks from a ghost duck species (Figure 4 and Supplementary Figure S8).These findings imply that both Chinese spot-billed ducks and mallards are unlikely to be the direct wild ancestor of modern ducks.
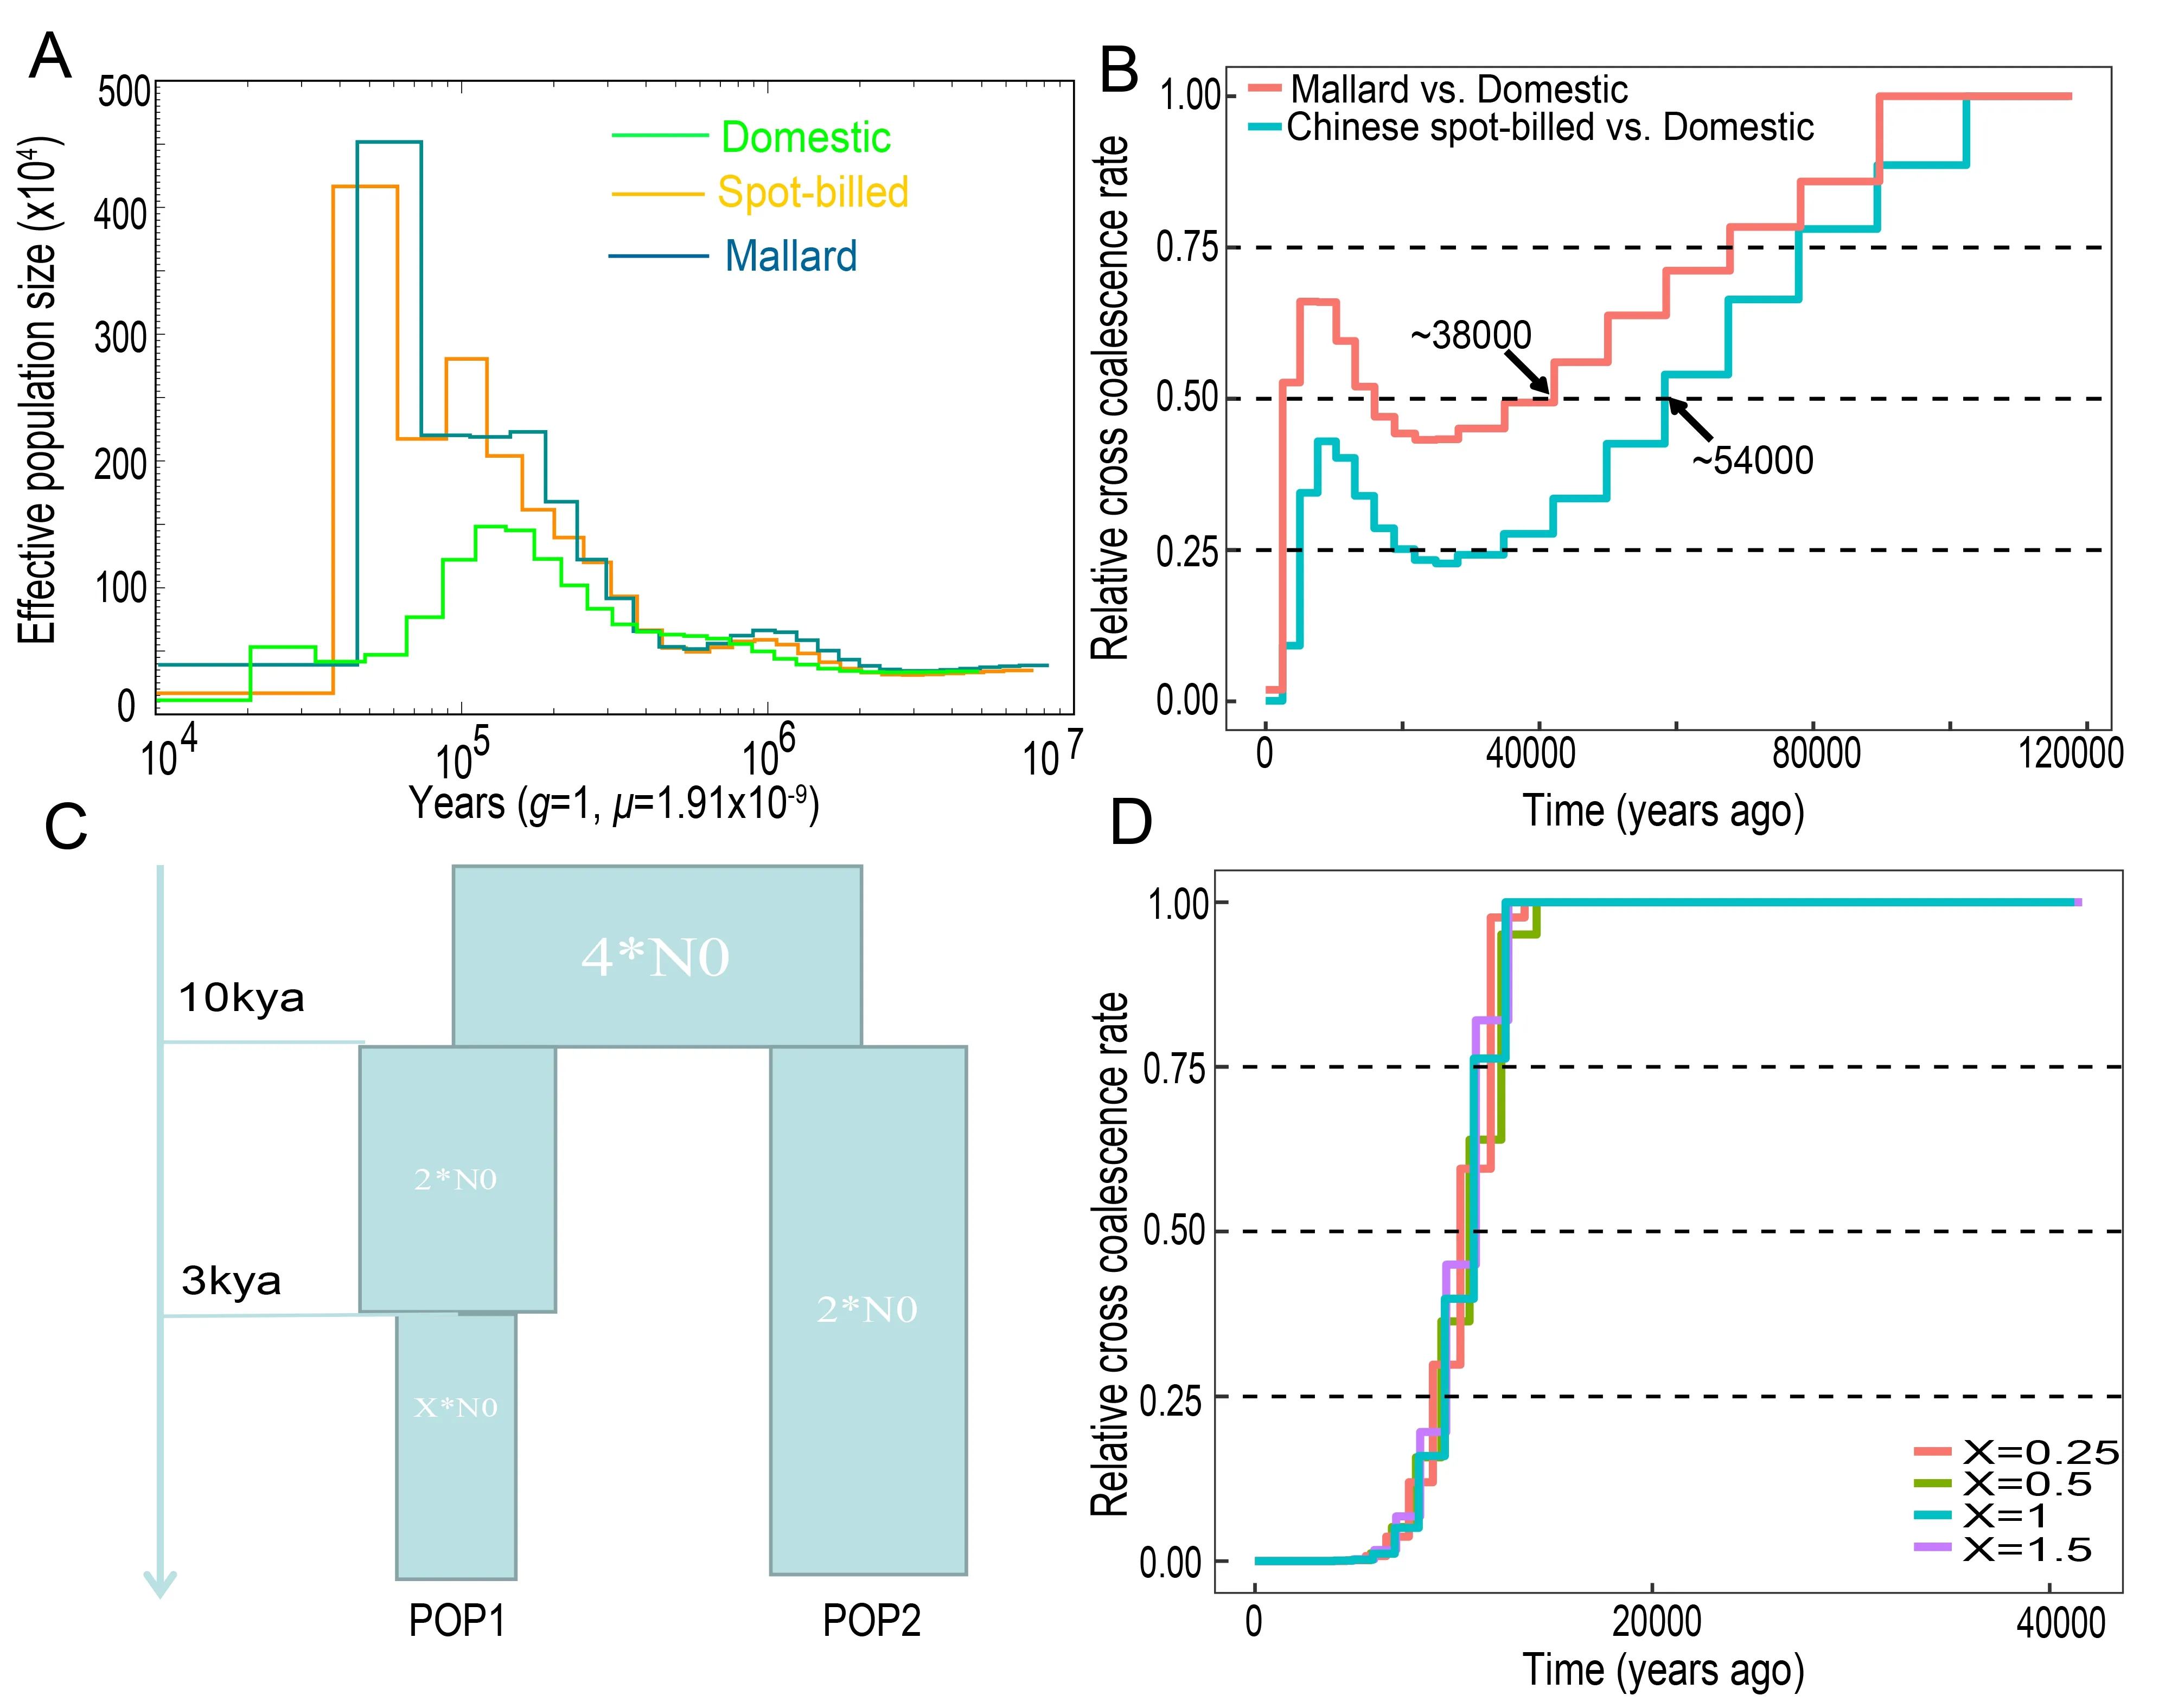
Figure 3 Demographic history of ducks
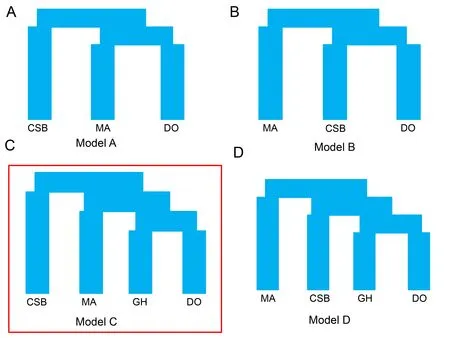
Figure 4 Demographic scenarios tested by fastsimcoal2
As wild mallards and spot-billed ducks are widely distributed,they habitually undergo long-distance annual migrations (Kulikova et al.,2005; Shin et al.,2015; Williams et al.,2020).Therefore,it is plausible that there are some substructure wild duck populations that have not been sampled or have gone extinct. Domestic ducks likely descended from such unknown wild duck populations and not from present-day Chinese mallards or spot-billed ducks,as previously assumed (Hou et al.,2012).Interestingly,our results are similar to observations for other domestic species.For example, genomic analysis has shown that dogs originated from an extinct wolf population (Fan et al.2016)and domestic horses were derived from an extinct horse population (Fages et al.,2019; Gaunitz et al.,2018).Our study suggests that the evolutionary history of ducks is more complex than previously thought and provides a possibility for future exploration.Further studies incorporating additional wild,domestic,and ancient samples covering all duck domestication sites are necessary to test our hypothesis and elucidate the evolutionary history of this important poultry species.
CONCLUSIONS
Our results provide consistent and compelling evidence that Chinese spot-billed ducks and mallards are genetically closely related.Moreover,we also found a pervasive and complex introgression pattern between wild and domestic ducks.In particular,our results suggest that domestic ducks are unlikely to have originated from present-day mallards and Chinese spot-billed ducks,as previously assumed,but may have originated from a ghost wild duck population that is likely undefined and/or not included in the present study.Overall,our study provides new insight into the complex evolution of ducks and provides a scenario for further study.
SUPPLEMENTARY DATA
Supplementary data to this article can be found online.
COMPETING INTERESTS
The authors declare that they have no competing interests.
AUTHORS’ CONTRIBUTIONS
R.S.J.and M.S.W.designed the study and revised the paper;X.G.,H.C.,Z.C.W.,and H.F.L.conducted bioinformatic analyses; X.G.wrote the draft manuscript.All authors read and approved the final version of the manuscript.
SUPPLEMENTARY DATA
Supplementary data to this article can be found online.
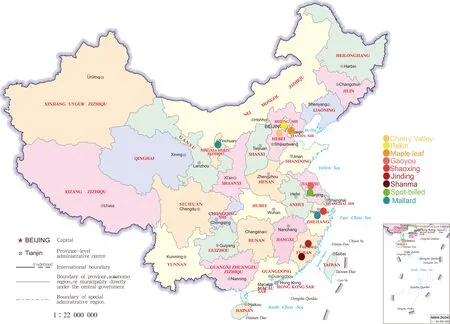
Figure S1 Geographic distribution of samples used in this study.
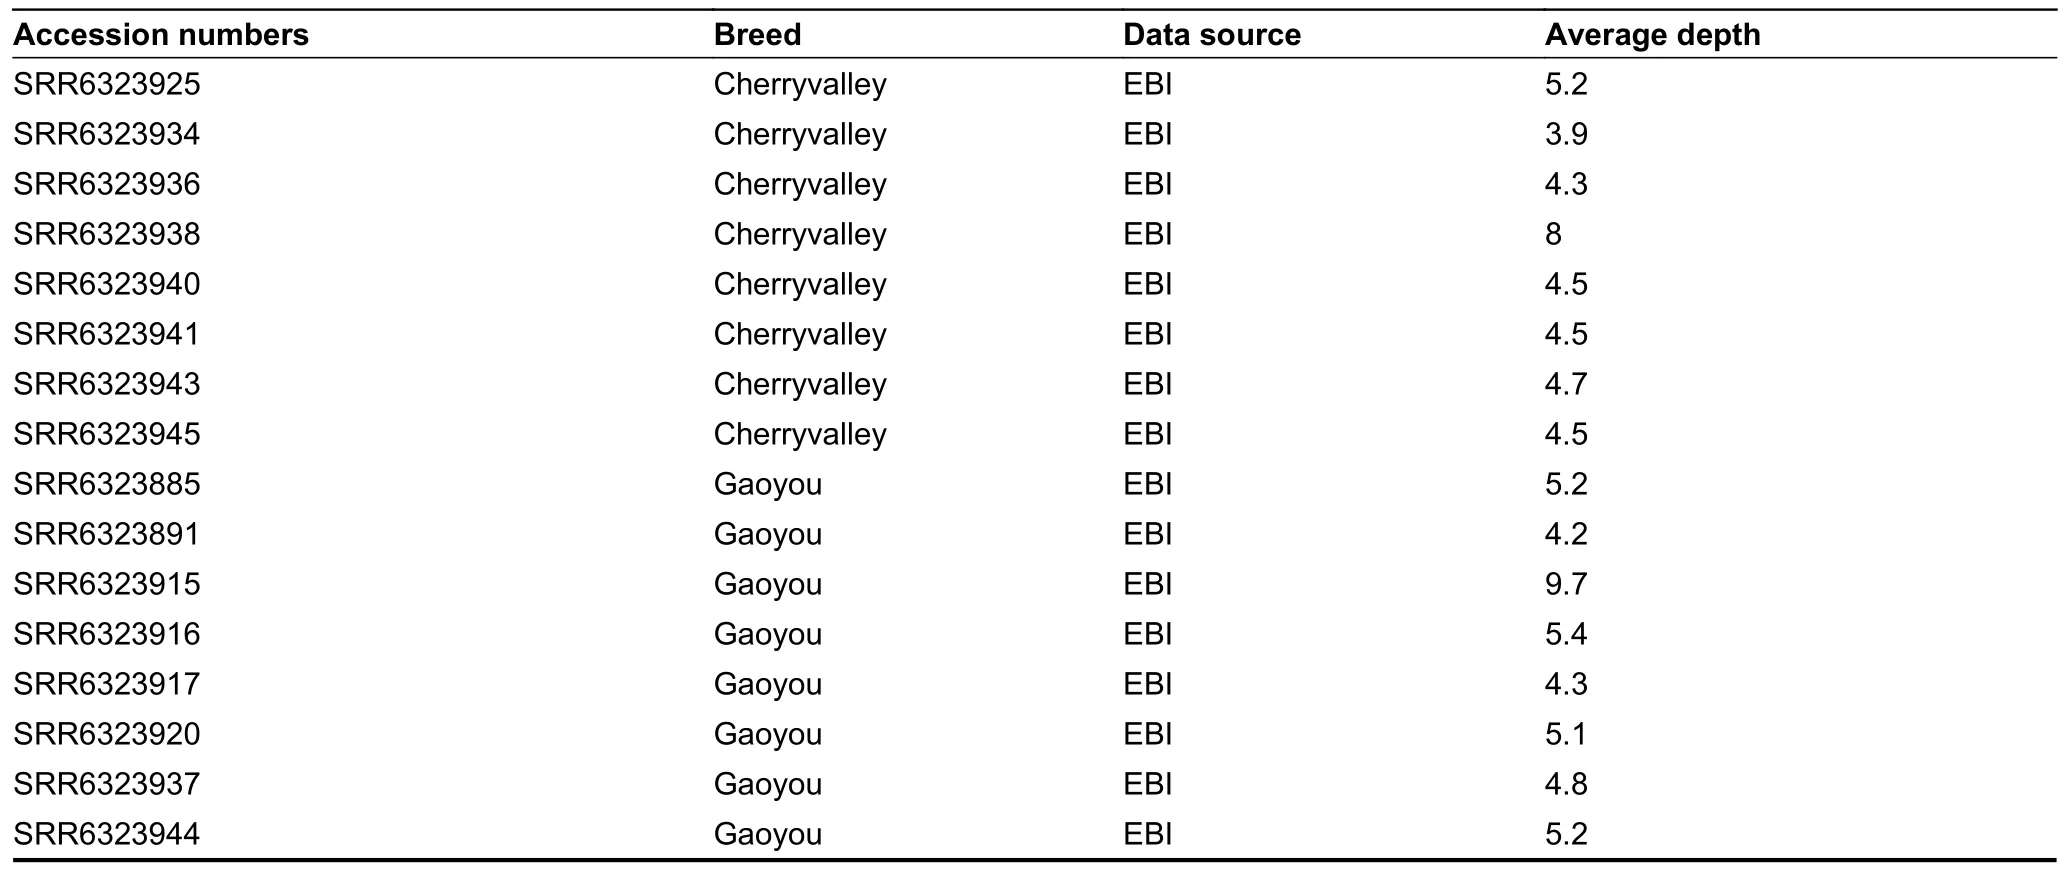
Table S1 Summary of genomic data for 118 ducks.

Continued
Continued
Continued

Figure S2 LD decay determined by squared correlations of allele frequencies (R2) against distance between polymorphic sites.

Figure S3 CV error for ADMIXTURE analysis of two wild duck species.K values ranged from 2 to 10.K=2 is best.

Figure S4 CV error for ADMIXTURE analysis of 117 ducks.K values ranged from 2 to 11.K=3 is best.
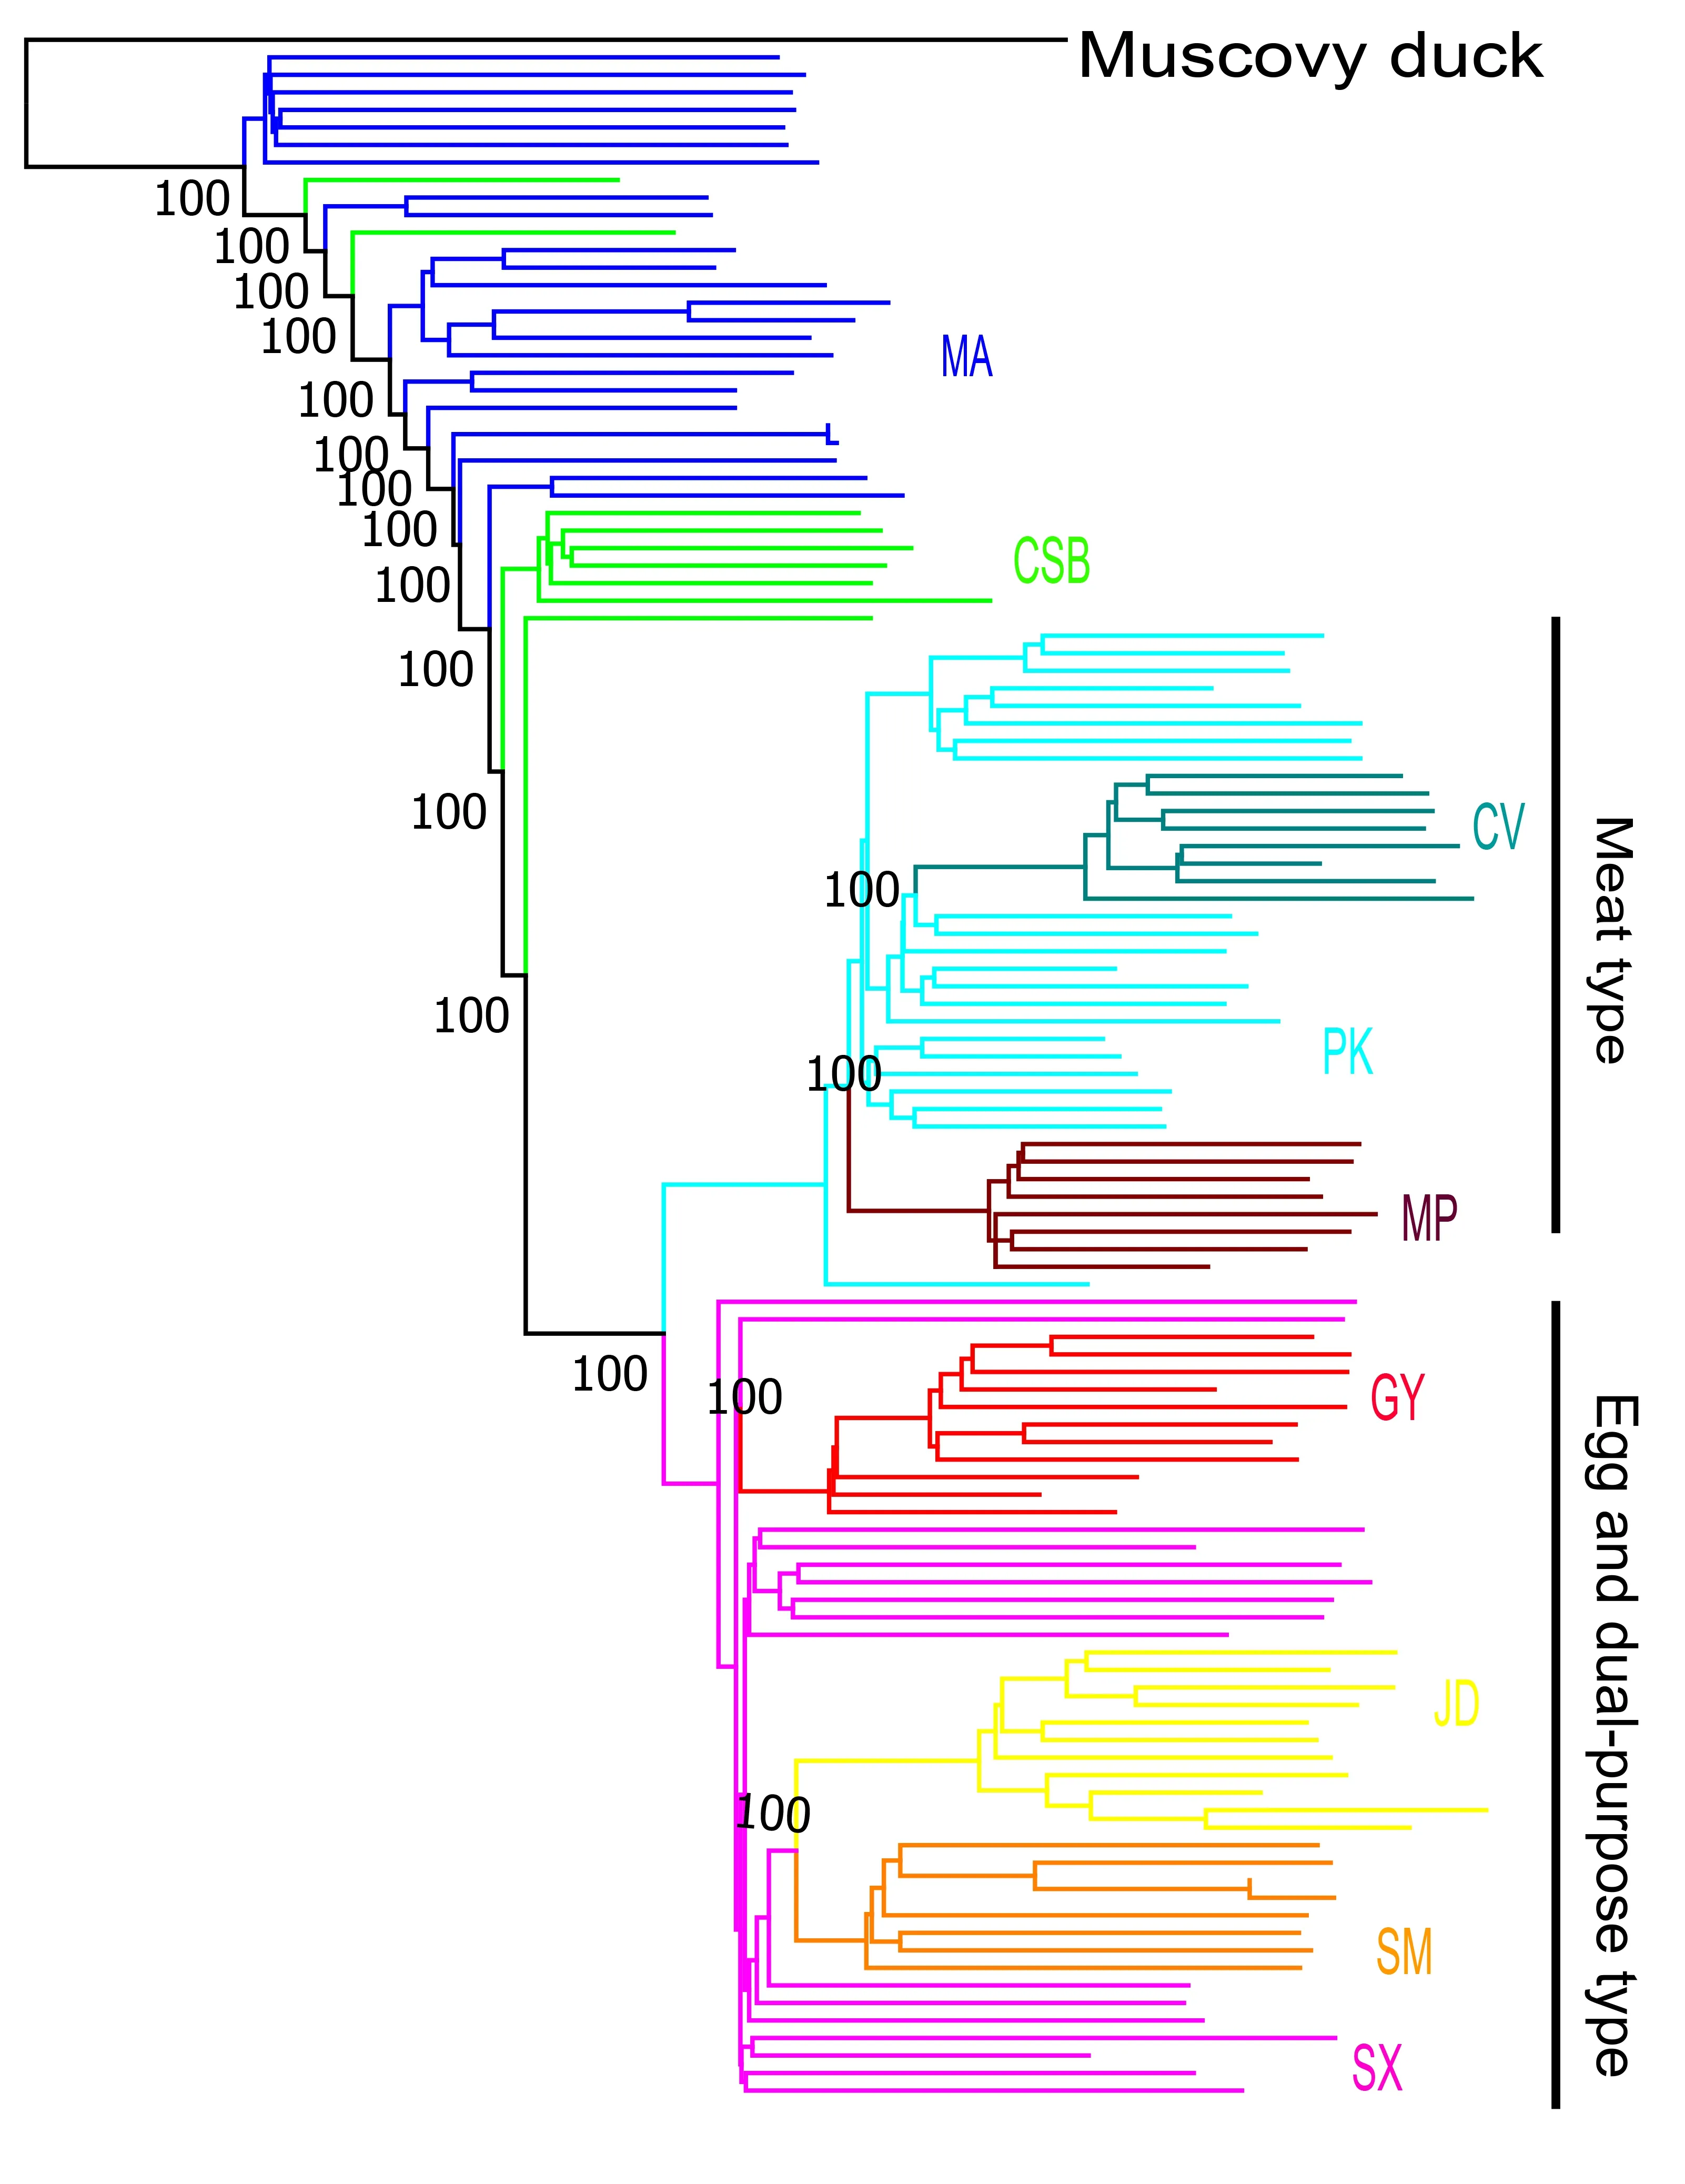
Figure S5 Phylogenetic trees constructed using neighbor-joining method based on variants along autosomes.MA,mallard; CSB,Chinese spot-billed; PK,pekin; CV,cherry valley; MP,maple leaf; GY gaoyou; JD,jinding; SM; shanma; SX,shaoxing.

Figure S6 FST for all possible pairwise combinations of nine duck populations.
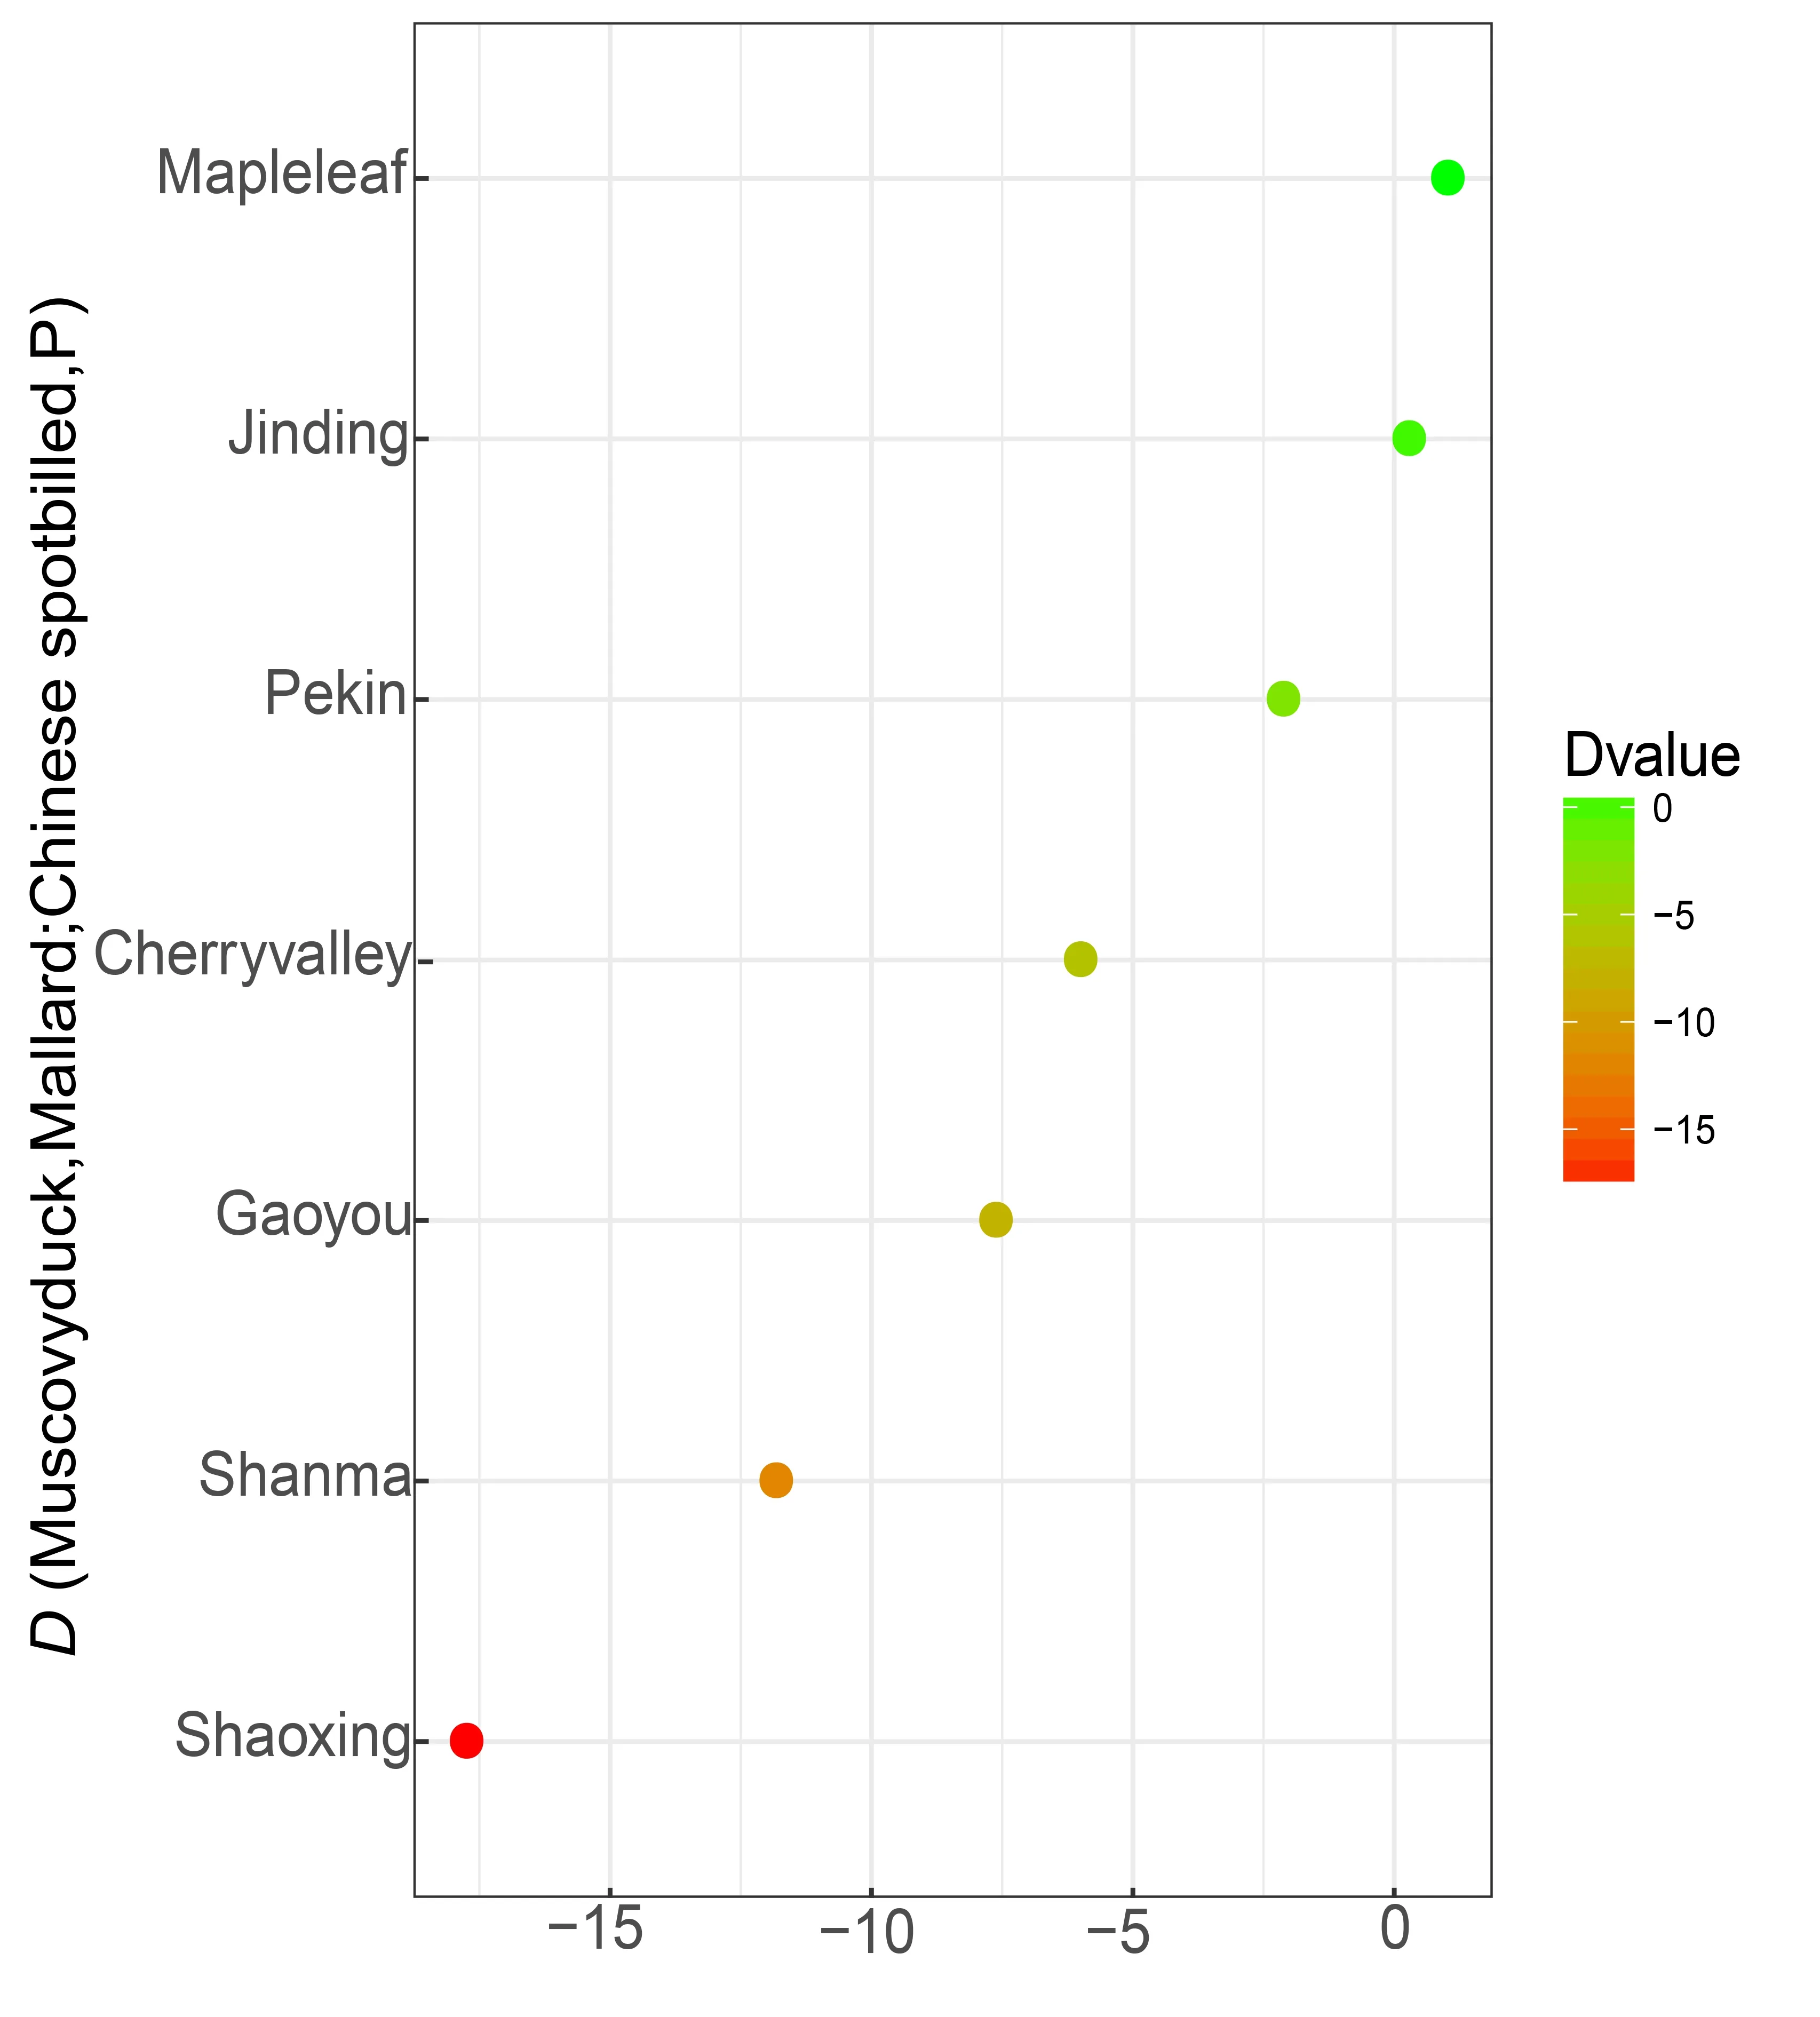
Figure S7 D-statistics for D (Muscovy duck,Mallard; Chinese spot-billed duck,P).Z<–3 indicates admixture between mallards and Chinese spot-billed ducks.
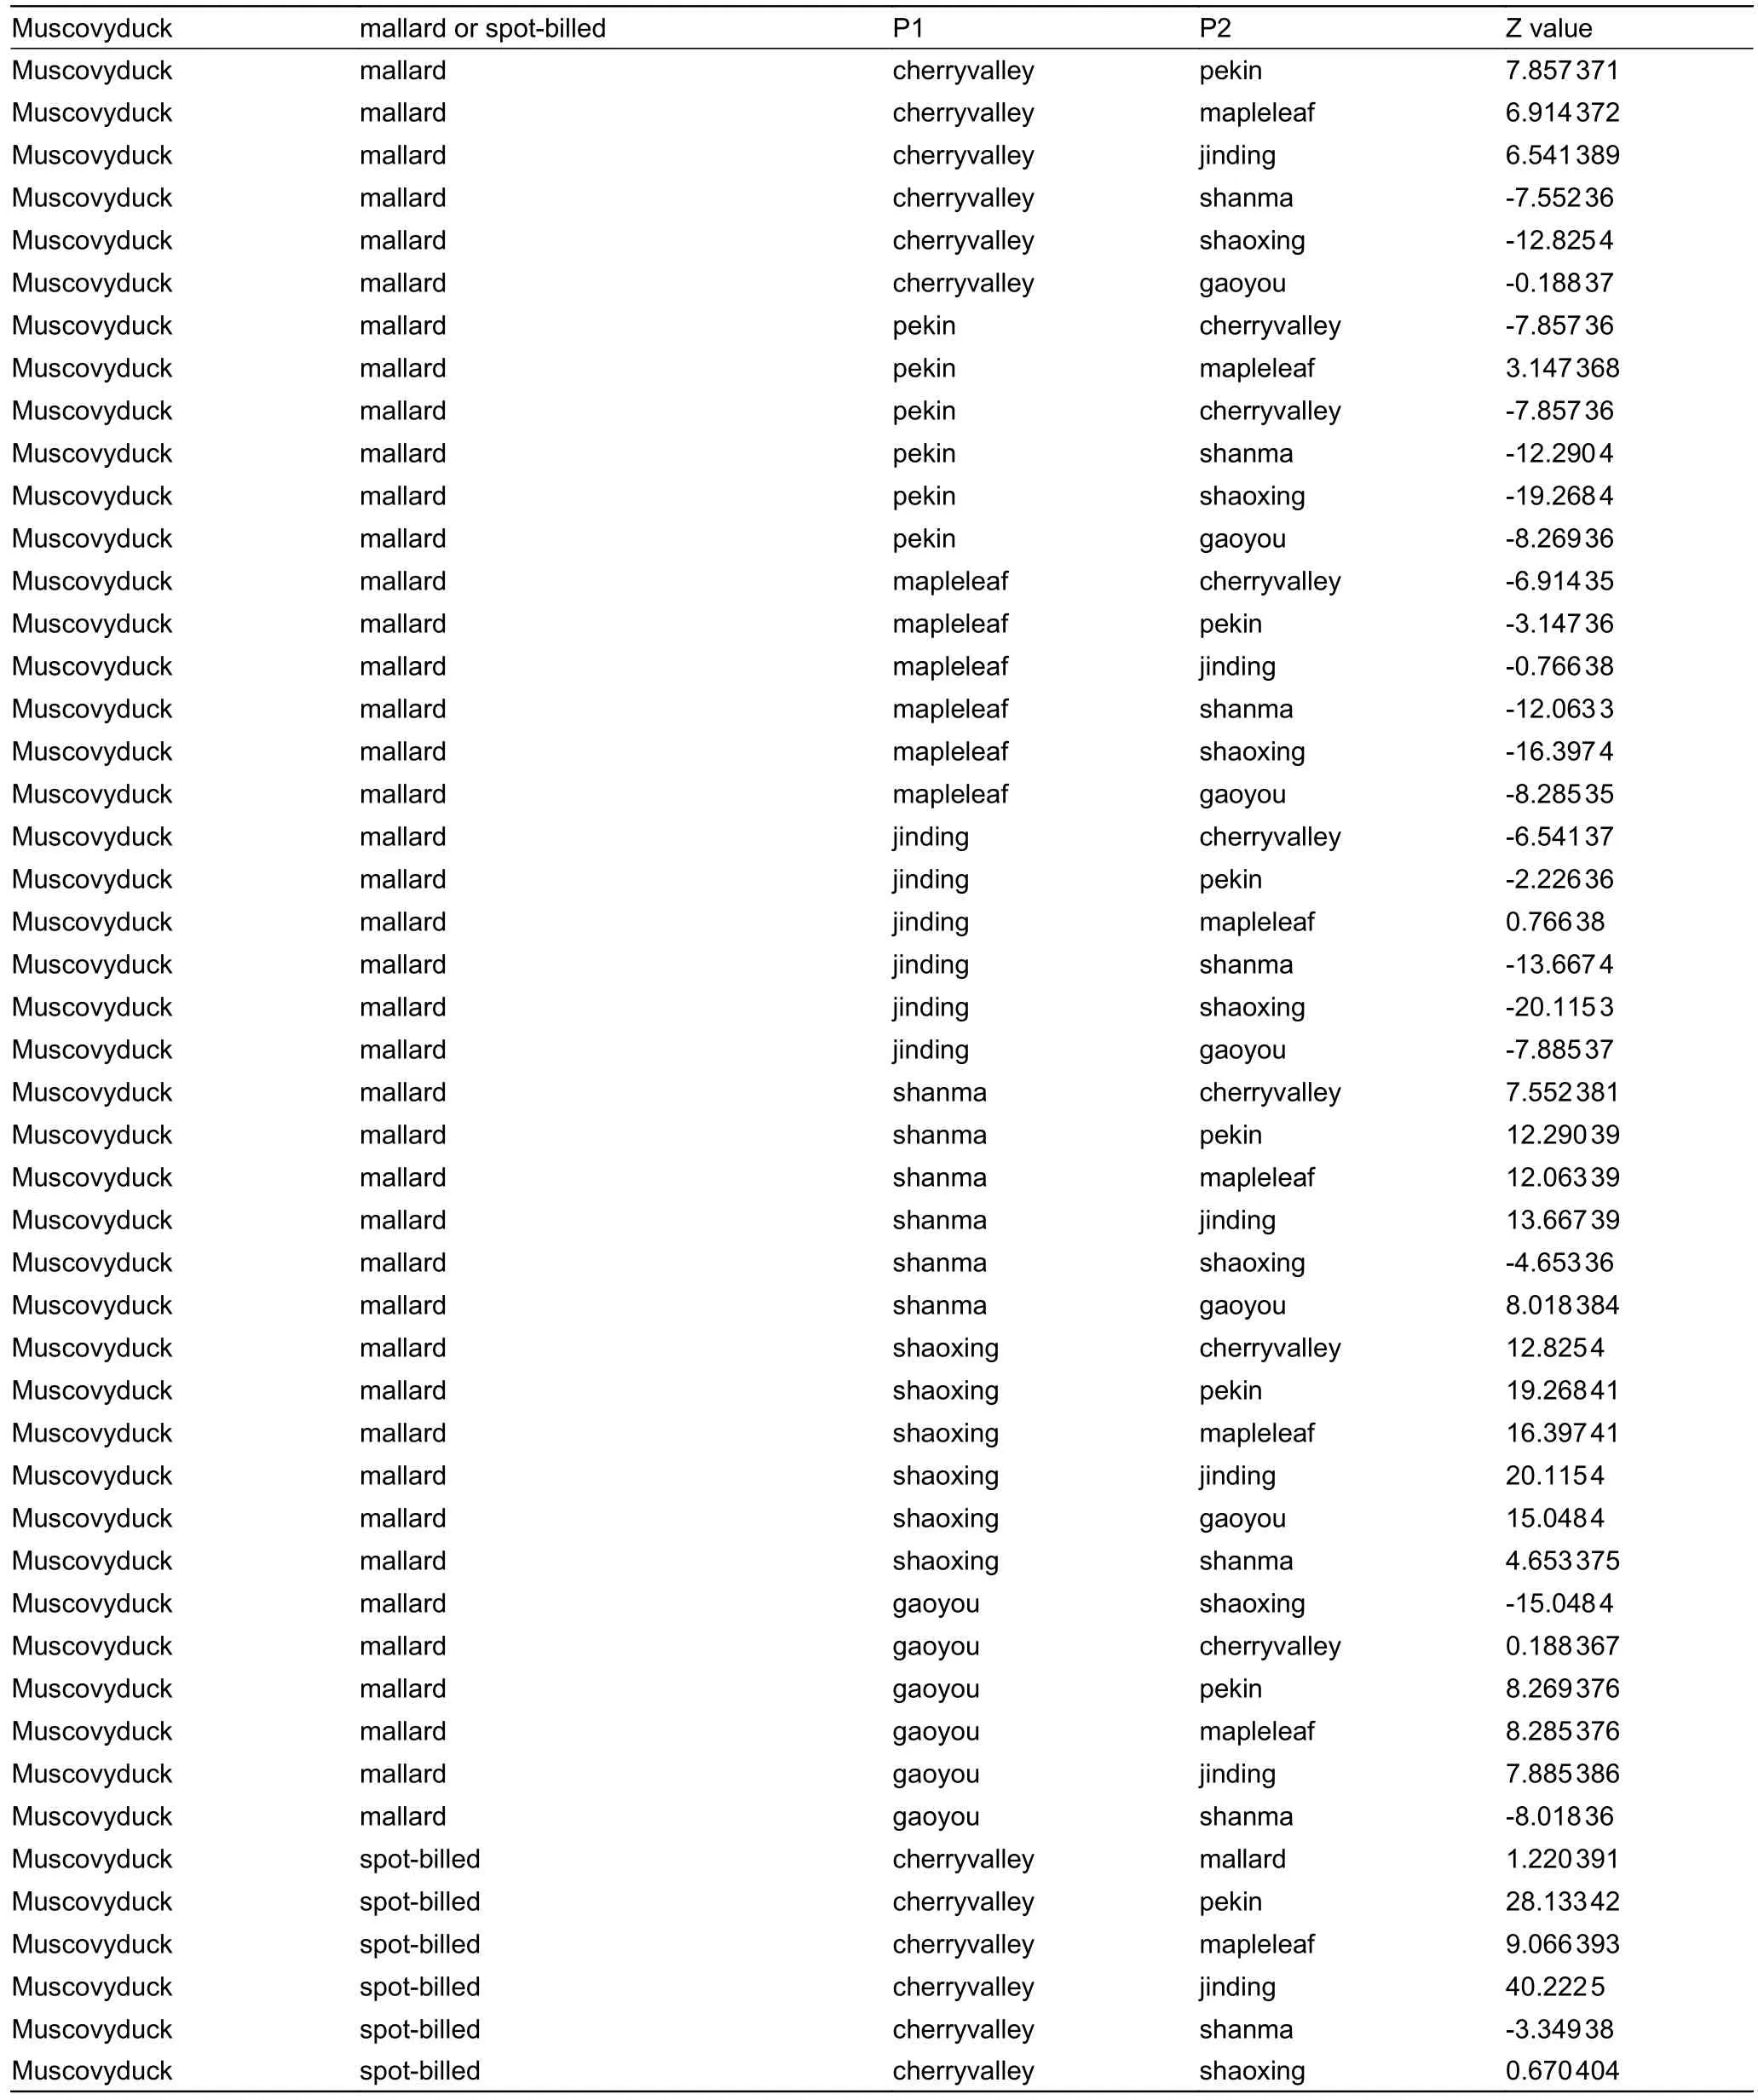
Table S2 D-statistics for D (Muscovy duck,mallard; P1,P2) or D (Muscovy duck,Chinese spot-billed duck; P1,P2).P1 and P2 represent different domestic duck groups.Z<–3 indicates admixture between mallards or Chinese spot-billed ducks and P1.
Continued

Figure S8 Boxplot of AIC values for four demographic scenarios (Model C is best).
- Zoological Research的其它文章
- Multilocus phylogeny suggests a distinct species status for the Nepal population of Assam macaques (Macaca assamensis):implications for evolution and conservation
- Dmrt1 regulates the immune response by repressing the TLR4 signaling pathway in goat male germline stem cells
- Fluoxetine ameliorates depressive symptoms by regulating lncRNA expression in the mouse hippocampus
- Dynamic evolution of transposable elements,demographic history,and gene content of paleognathous birds
- Contribution to the taxonomy of the genus Lycodon H.Boie in Fitzinger,1827 (Reptilia:Squamata:Colubridae) in China,with description of two new species and resurrection and elevation of Dinodon septentrionale chapaense Angel,Bourret,1933
- Pitfalls of barcodes in the study of worldwide SARSCoV-2 variation and phylodynamics