
Effects of heat transfer in a growing particle layer on microstructural evolution during solidification of colloidal suspensions∗
2021-03-11 08:34JiaXueYou游家学YunHanZhang张运涵ZhiJunWang王志军JinChengWang王锦程andShengZhongLiu刘生忠
Chinese Physics B 2021年2期
关键词:王志军
Jia-Xue You(游家学), Yun-Han Zhang(张运涵), Zhi-Jun Wang(王志军),Jin-Cheng Wang(王锦程), and Sheng-Zhong Liu(刘生忠)
1Key Laboratory of Applied Surface and Colloid Chemistry,Ministry of Education;Shaanxi Key Laboratory for Advanced Energy Devices;Shaanxi Engineering Laboratory for Advanced Energy Technology;Institute for Advanced Energy Materials;School of Materials Science and Engineering,Shaanxi Normal University,Xi’an 710119,China
2State Key Laboratory of Solidification Processing,School of Materials Science and Engineering,Northwestern Polytechnical University,Xi’an 710072,China
Keywords: solidification,colloidal suspensions,heat transfer,microstructural evolution
1. Introduction
Solidification of colloidal suspensions is ubiquitous in nature and engineering.[1–5]It involves frost heaving, cryosurgery, freeze casting, and the relevant applications such as in new energy materials and bio-inspired materials.[6–8]The key processing in freezing colloidal suspensions is solidification which requires the removal of heat, first to cool the fluid to its freezing temperature, then to effect the transformation itself.[9–11]Thus heat transfer is the foundation of colloidal solidification and a key factor for the interface movement.[12]
So far, the heat transfer in colloidal suspensions that has been investigated by the researchers is restricted in the field of phase change materials and thermal energy storage.[13–15]They found that some kinds of nanoparticles can enhance the thermal conductivities of phase change materials.[16]They also investigated the effect of diffusivity of particles on the interface instability.[15,17]However, submicron- or micronsized particles with a limited diffusion are usually used in experiments.[18]The Brownian motion or the diffusivity does not suffice to characterize the submicron particles.[19]The main characteristic is that a concentrated particle layer appears in front of the freezing interface when particles are rejected by the growing interface and accumulate in the front during planar growth.[20]The concentrated particle layer will grow as more particles are attached. Usually, the thermal conductivity of particles is different from that of liquid and solid crystalline.[21]In dilute suspensions, researchers investigated how thermal conductivity of a single particle affects local interfacial morphology and behaviors of engulfed particles.[22,23]However,how the heat transfer of the growing particle layer in concentrated suspensions affects the interface movement and freezing microstructural evolution remains unknown.
Some other characteristics in the heat transfer of colloidal solidification include a discontinuity in the enthalpy function always occurring at equilibrium temperature Tmbetween the two-phase existence lines.[9]This enthalpy jump will cause the release of latent heat at the solidifying interface,disturbing the thermal conduction in a thermal gradient.On the other hand,if a pulling speed is attached,more heat will be transferred from the warm part to the cold part,inducing an isotherm shift compared with scenario at the liquidus isotherm positions at rest and during pulling.[24]This shift of isotherms can be seen as the“instrumental recoil,”which is due to the evolution of thermal exchanges induced by pulling.[25]Therefore, it is important to evaluate the effects of a growing particle layer,pulling speed, and latent heat on the heat transfer and the interface movement of colloidal solidification.
In the following,we build up a mathematical model to investigate the effects of a growing particle layer,pulling speed,and latent heat on the interface movement under a thermal gradient.The effects of pulling speed and thermal conductivity of the particle on the interface shift can be proposed.Some experiments are conducted to confirm the tendency prediction of the model. Finally,we investigate the effect of thermal conductivity of the particle on the interfacial force and microstructure evolution.
2. Modeling and experiments
2.1. Mathematical model
Directional thermal conduction-dominated solidification of colloidal suspensions in a semi-infinite domain was considered in order to compare with the experimental results. As illustrated in Fig.1,the initial condition for the entire domain is a linear thermal gradient with two fixed temperatures at the edges of the system. In the heating zone, the temperature is denoted as TLat x=L, while the temperature is denoted as T0at x=0 in the cooling zone. We solve a one-dimensional,two-phase,three-region Stefan problem in a finite slab.

Fig.1. (a) Schematic diagram of planar growth in colloidal solidification,with blue solid line denoting ice interface and blue dashed line representing the edge of the particle layer. (b) Experimental observation of freezing polystyrene microsphere suspensions,showing that eew particles are engulfed at grain boundaries of ice and premelting layers between glass surfaces and ice.
The entire domain is initially kept at a linear temperature gradient from T0to TLthrough length L, where TLis higher than the freezing point Tmon the right boundary(x=L),and T0is lower than Tmon the left boundary(x=0). A planar solidification interface starts from the left cold boundary. As solidification proceeds, particles are rejected in the front, forming a concentrated particle layer due to the differences in interface energy among ice, water, and particles. The ice/water interface (xf) and the edge of the particle layer (xp) can be separated into three regions,i.e.,the solid crystalline and suspensions,and the concentrated particle layer in between. The freezing interface moves toward the positive x direction.
If a pulling speed V is attached to the sample cell,the linear thermal gradient will be changed and the heat transfer will be

where T is temperature, t is time, and αTis the thermal diffusivity. In the transient initial stage before the phase transformation occurs, both solid and liquid move along with the sample. However, the interface speed of freezing front will quickly increase to keep up with the pulling speed. Therefore,we use the pulling speed V in the initial stage to simplify the calculation. We obtain non-dimensional lengths for the three different regions

where ζ is the non-dimensional length for the region of ice,β for the particle layer and η for the suspensions, x is the real position, xfis the position of ice interface and xpthe edge of the particle layer.
For the region of ice (0 ≤ζ <1), the thermal diffusion equation is

where αiis the thermal diffusivity of ice, and it is obtained from

where Cp,iis the specific heat capacity of ice, and ρiis the density of ice.
Boundary condition is

The initial condition is
With the release of latent heat, Stefan condition at the freezing interface xfis

where Lais the latent heat of fusion, kcis the effective thermal conductivity of the concentrated particle layer,[20,26]ki,kwand kpare the thermal conductivities of ice,water,and particles,respectively,and v=dxf/dt+V is the growth speed of the freezing interface.
For the region of the particle layer(0 <β ≤1),the thermal diffusion equation is

where αcis the thermal diffusivity of the particle layer
where kcis the thermal conductivity of the particle layer from Maxwell model,[27]ρcis the density of the particle layer,and Cp,cis the mixed thermal capacity of the particle layer.[26]
The boundary condition can be

where G is the thermal gradient.
The initial condition can be

At the edge of the particle layer,the mass conservation of particles is

For the region of suspensions (0 <η ≤1), the thermal diffusion equation is

where αwis the thermal diffusivity of water.
The boundary condition is

The initial condition is
From the above non-dimensional equations, we analyze the heat transfer at two interfaces and in three regions. In the following, we calculate the interface movement varying with time. Implicit Euler method is adopted in the calculation.Therefore, the numerical calculation is absolutely stable and has a second-order accuracy.[28]
2.2. Computational parameters
The above parameters are cited from Refs.[29,30]. Note that the initial thickness of the particle layer is set to be 10µm,because in experiment it is very hard to make no particles in front of the freezing interface at the initial time.[11]After nucleation and fast growth of ice, many particles are engulfed into ice. Then the whole system relaxes and forms a planar interface,and particles will migrate to the liquid and form an initial particle layer due to effects of thermal regelation[31]at the initial time. The initial thickness of the particle layer also avoids the singularity at t=0 in numerical calculations.

Symbols Meaning Value L(mm) length of the whole calculation system 5 Tm (K) melting point 273.15 cp,i (kJ/(kg·K)) thermal capacity(ice) 2.1 cp,w (kJ/(kg·K)) thermal capacity(water) 4.2 cp,p (kJ/(kg·K)) thermal capacity(polystyrene) 1.3 thermal capacity(Al2O3) 0.75 ki (W/(m·K)) thermal conductivity(ice) 2.5 kw (W/(m·K)) thermal conductivity(water) 0.56 kp (W/(m·K)) thermal conductivity(polystyrene) 0.11 thermal conductivity(Al2O3) 20 ρi (g/m3) density of ice 0.9 ρw (g/m3) density of water 1 ρp (g/m3) density of polystyrene 1.05 density of Al2O3 3.97 φp volume fraction of close-packed particles 0.64 La (J/kg) latent heat 3.34×105 x0f (mm) initial position of the freezing interface 2.5 x0p (mm) initial position of the edge of the particle layer 2.51
2.3. Experiments
In experiments, α-alumina powder (Wanjing New Material, Hangzhou, China, >99.95% purity) with an average diameter of 50 nm (manufacturer’s data) and a density of 3.97 g·cm−3was used to prepare suspensions. Alumina powder was washed by deionized water and dispersed by adding a little HCl and applying ultrasonic pulsation (Branson Sonifier 250) at 30 kHz for 10 min until the pH of the suspensions was 5.[11,20]Polystyrene-microsphere (PS) suspensions were bought from the company Bangs Lab, USA. The average diameter of PS is 100 nm(manufacturer’s data). No sedimentation was in PS suspensions because the density of PS particles (1.03 g·cm−3) matches with water (1 g·cm−3) very well.[18]Sedimentation in alumina suspensions could be ignored because the thickness of the cell was only 50µm. The real sizes of particles were analyzed by transmission electron microscope(TEM,Themis Z,FEI)as indicated in Fig.2. The real diameter of PS particles is 93 nm,similar to the manufacturer’s data 100 nm. The uniform shapes of PS show their uniform sizes. The real diameter of alumina particles is 135 nm,much larger than the manufacturer’s data 50 nm, but close to PS diameter 93 nm.
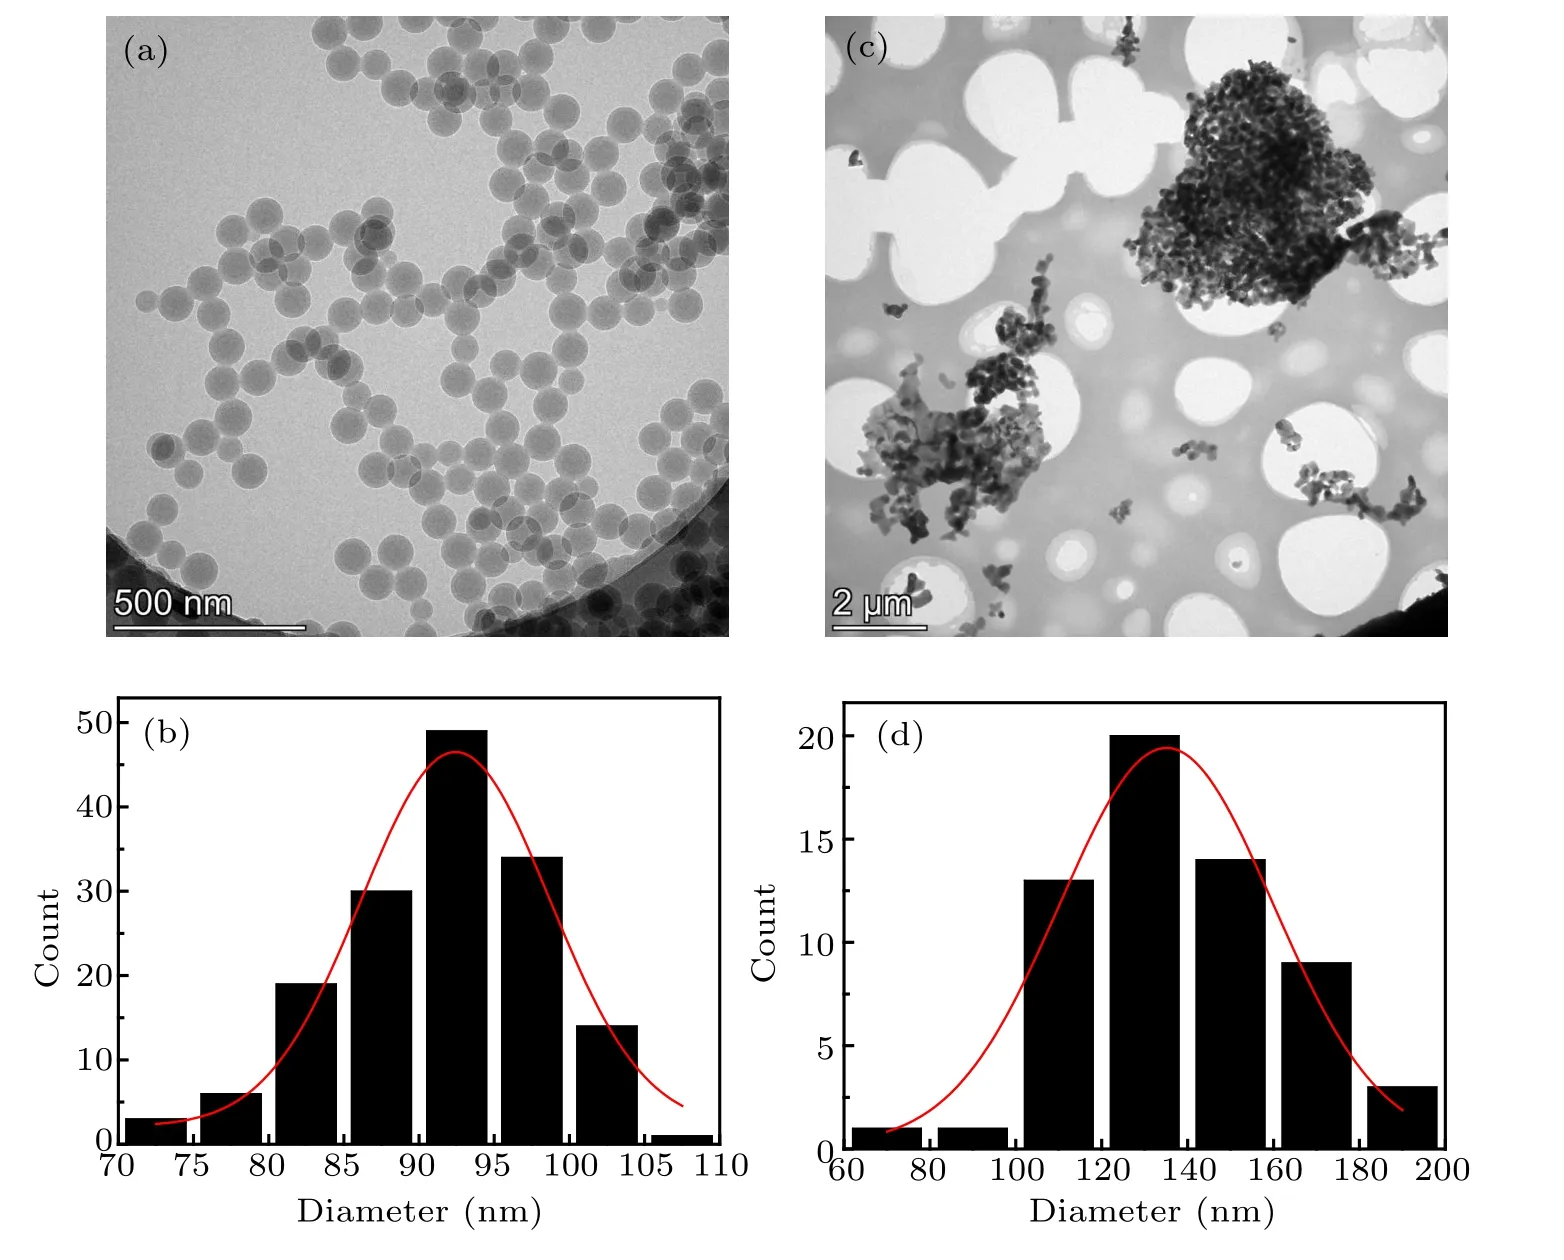
Fig.2. TEM characterization and size distribution,where real size of PS particles is 93 nm[(a)and(b)]and that of alumina particles is 135 nm[(c)and(d)].
The prepared suspensions were added into rectangular glass capillary sample cells with a size of 100 mm(length)×1 mm (width) ×0.05 mm (thickness) before freezing.Single cells were independently placed in a freezing setup to reveal the effect of the difference in thermal conductivity among particles,liquid water and ice on the measurements of interfacial positions. The Bridgman freezing setup and experimental procedure have been described in Ref. [24]. In the setup, the thermal gradient was produced by two heating and cooling zones which were separated by a gap. Sample translation across the thermal gradient was provided by a servodrives motor.Observation was achieved through an optical microscope stage equipped with a charge-coupled device(CCD)camera. During directional freezing, different pulling speeds were given in the relevant figure captions. The thermal gradient was kept at G=723 K/m. The images were recorded via a CCD camera with 2580×1944 sensitive elements on a time-lapse video recorder and further analyzed by the software image processing(Image Pro plus 6.0 and Photoshop). In all images presented,segregated ice was bright and particles were dark.
3. Results and discussion
Here we use MATLAB (version R2017a) to obtain numerical solutions of the above equations. Effects of pulling speeds and the thermal conductivity difference between particles and liquid on the interface movement of ice are investigated.
3.1. Effects of pulling speed
Particles are rejected by the freezing interface at a low growth speed. The particle layer grows with time in front of the freezing interface. Freezing of PS suspensions is simulated under different pulling speeds. The thermal gradient is kept at G=800 K/m and the initial volume fraction of particles φ0=0.2. Freezing interface movement is influenced by both external pulling and spontaneous phase transformation which have two opposite directions. In the initial stage, external pulling speed is stronger than the speed of phase transformation. Therefore, the freezing interface moves back to the cold side, which is consistent with external pulling. After the initial stage,the phase transformation keeps pace with the external pulling. Therefore,the position of the freezing interface remains unchanged in the steady-state growth(Fig.3).The position gap between the initial and the steady-state is named drifting distance and the time to reach the steady-state position is termed drifting time. In Fig.3(b),the drifting distance increases with the enhancement of pulling speeds,while the drifting time decreases with the increase of pulling speed.Note that the position change caused by pulling speed does not mean the temperature change of the freezing interface,because the position change originates from thermal lag and the temperature of the freezing interface remains unchanged.
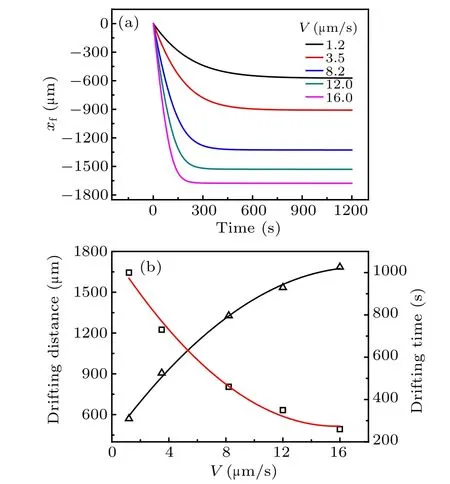
Fig.3. (a) Computational modeling for freezing interface movement when PS particles are rejected by growing interface,and(b)calculated relation between drifting distance/drifting time and pulling speed,with thermal gradient G=800 K/m and volume fraction of particles φ0=0.2 under different pulling speeds.
3.2. Effects of particle thermal conductivities
On the other hand,the movement of the freezing interface is influenced by thermal conductivities of the particle layer.Generally, thermal conductivities of particles can be divided into two types: (i) lager than the conductivity of initial suspension such as alumina (α =kp/kw>1) and (ii) less than the conductivity of initial suspension such as PS (α <1). In Fig.4,simulated temperature distribution of freezing suspensions with α =2.0,α =1.0,and α =0.2 are presented. The ice region extends from position zero to the first kink point which is freezing interface. The particle layer is from the first kink point to the second kink point. The second kink point is the edge of the particle layer. The last part in the curve is the region of initial suspensions. The thickness of the particle layer grows with time increasing according to Eq. (6), which can also affect the microstructural evolution in later time.Here we focus on the effect of particle thermal conductivity on interfacial motion in the initial stage and the later microstructural evolution will be discussed in Section 5. The pulling speed V = 8 µm/s, thermal gradient G = 800 K/m, volume fraction of particles φ0=0.2,and the growth time 100 s are used.When the particle thermal conductivity is greater than that of initial suspension(α>1),the freezing interface will retreat to the cold side while the freezing interface will go to the warm side if α <1. These results are consistent with those of single particles. In single particle model,the local freezing interface becomes convex near to warm side when α <1,while it will become concave back to cold side when α >1. The thermal conductivity of the two-dimensional single particle model is similar to that of the present model. The nearest point of the freezing interface under a particle is considered in the present model, which is the most important in the two-dimensional single particle model. Other points are determined by the local curvature and the thickness of the premelted film.[32]The nearest point goes forward,corresponding to the convex shape in single particle model, and the nearest point goes back, becoming a concave shape, which were confirmed by Shangguan et al. (1992),[22]Stefanescu et al. (1998),[23]Rempel et al. (2001),[32]Kao et al. (2009),[33]and Saint-Michel et al.(2017).[21]Note that the position change caused by thermal conduction of particle does not mean the temperature change of the freezing interface as indicated in Fig.4.

Fig.4. Temperature distributions versus position in simulations, with pulling speed V =8 µm/s, thermal gradient G=800 K/m, initial volume fraction of particles φ0=0.2,and growth time 100 s.
4. Experimental confirmation
The freezing of alumina suspensions with mean particle diameter 135 nm were in-situ observed. The thermal gradient was G=723 K/m and initial volume fraction of particles φ0=3.63%. The movement of the freezing interface under pulling speed V = 3.5 µm/s, 8.2 µm/s, and 16.0 µm/s, are shown in Fig.5. There are two premelting regions around the solid ice, i.e., the grain boundaries of ice and the premelting layers between the glass surface and ice. These two regions are easy to engulf nanoparticles due to their quasiliquid properties.[34]Therefore,a few particles were engulfed in the grain boundaries of ice at the growth speed. And the premelting layers are close to the upper and lower surfaces of the glass engulfed some nanoparticles uniformly. Meanwhile,due to the inhomogeneity of suspensions in the local region in Figs. 5(d)–5(f), their particle layers (the darker shadow near the phase interface)are narrower than those in Figs.5(a)–5(c)and 5(g)–5(i) in the initial stage. After the initial stage, the suspensions become uniform as indicated in Fig.A1 (in Appendix A). The final microstructures (Fig.A1) and the characteristic length of particle banding and ice banding will be strongly affected by pulling speed. The length of particle banding and ice banding will decrease with pulling speed increasing.
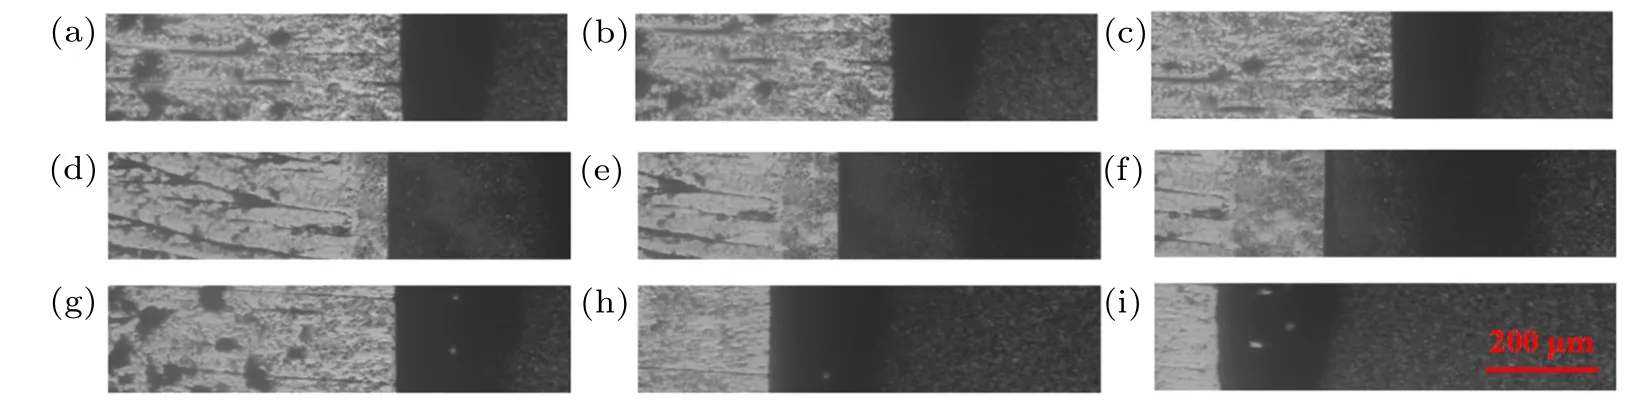
Fig.5. Movement of freezing interface under different pulling speeds: (a)V =3.5µm/s,t=0 s;(b)V =3.5µm/s,t=32 s;(c)V =3.5µm/s,t =52 s; (d)V =8.2µm/s,t =0 s; (e)V =8.2µm/s,t =32 s; (f)V =8.2µm/s,t =52 s; (g)V =16.0µm/s,t =0 s; (h)V =16.0µm/s,t=32 s;(i)V =16.0µm/s,t=50 s. In each panel,the left is cold side and the right is heat side. Pulling velocity directs from right to left.
The freezing interface retreats to cold side under all pulling speeds. The position–time curves are quantified in Fig.6. The experimental error bars are shown in Fig.A2 in Appendix A. The drifting distance increases with the pulling speed increasing in Fig.6(b),while the drifting time decreases with pulling speed increasing.These experimental results confirm the tendency predictions in Fig.2. The quantitative comparison of position–time curve between the calculation and experiment is presented in Fig.A2 showing that the drifting distances and drifting times in experiments are less than those in simulations. The reason for the discrepancy is likely to be due to the fact that the lateral thermal conduction between the sample cell and ambient temperature in experiment is not considered in the simulation. The ambient temperature is much higher than that of the sample cell and the lateral thermal conduction between them will reduce the drifting distances and drifting time in experiment.
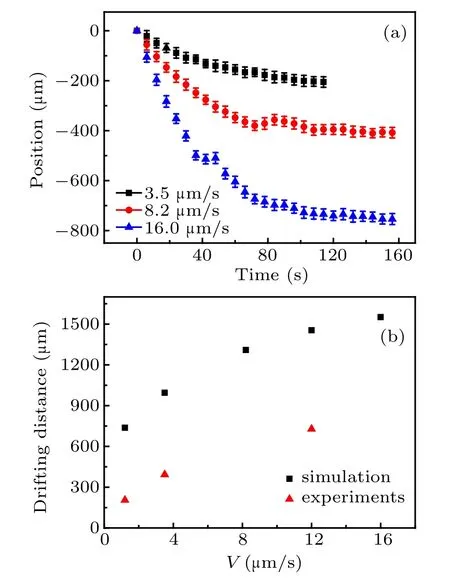
Fig.6. (a) Measured position–time curves of freezing interface under different pulling speeds, and (b) comparison of drifting distance between simulation and measurement.
Effects of particle thermal conductivities on the interface movement are also confirmed in Fig.7. Freezing alumina suspensions and PS suspensions compared with freezing pure water are shown in Figs. 7(a) and 7(b), respectively. The freezing interface moves to warm side in PS suspensions, while the freezing interface of alumina suspensions retreats to the cold side compared with the interface of freezing pure water.These experimental results confirm the tendency predictions in Fig.4.

Fig.7. Position of the freezing interface with two different particle layers:(a)Al2O3 particles,with initial volume fraction of particles φ0=1.31%and particle diameter 50 nm,and(b)PS particles,with initial volume fraction of particles φ0=10%and particle diameter 100 nm. Pulling speed V =1µm/s and thermal gradient G=723 K/m.
These interface drifts in Fig.7 can be explained by microstructures of the local freezing interface contacting single particles as shown in Fig.8.
When the thermal conductivity of particle is greater than that of the surrounding environment(α>1),the local freezing interface will become concave.[22,33]Therefore, the freezing interface of alumina suspension retreats to the cold side.However, the local freezing interface will become convex when the thermal conductivity of particle is lower than that of the surrounding environment (α <1).[22,33]In this situation, the freezing interface moves to the warm side in PS suspension.The local interfacial shape can be observed by cyro-TEM when the particle size is less than 100 nm.[35]And a far-field optical microscope can be used when the particle size is larger than 100 nm.[36]In addition, the effect of particle size on the thermal conductivity can be ignored in the present work, the effective thermal conductivity,[37]where kbis the bulk thermal conductivity of the solid particle,λs usually 10 nm,is the heat carrier mean free path in solid particle, and d is the diameter of the particles. In the present work, d is in a range of 100 nm–130 nm, much larger than λ. Therefore, the size effect of particles can be ignored.

Fig.8. Schematics of local freezing interface contacting different particles:(a)PS particles with convex shape(α <1),where the tip of convex shape is lowered due to premelting dynamics between particles and ice,and(b)Al2O3 particles with concave shape(α >1).
5. Modified phase diagram by particle thermal conductivity
The changes in the local interface shapes (Fig.8) will affect local premlting film flow which determines force balance and finally microstructural evolution in freezing suspensions. The thickness of premelting layers d will decrease when the local interface is concave according to the following equation:[22,23]

where Rpis the radius of particle. RIis the local radius of the freezing interface underneath the particle,RI>0 for α>1,resulting in a decreased d. The decreased d will lead to a greater drag force Ffcaused by the film flow.[11,21]However,a convex local interface(RI<0 for α <1)leads to a smaller drag force caused by the film flow. Therefore, the drag force caused by the film flow, Ff, increases with the increase of α as shown below:[22]

where Ff0is the film-flow-induced drag force when α = 1.Besides the film drag force Ff, viscous forces resulting from Darcy flow FDand the disjoining forces between ice and particles FTalso determine the force balance at the freezing interface. Both Ffand FDplay a role in dragging the particle layer,while FTplays a role in pushing the particle layer. When considering that the scales are much larger than the size of individual particles, this net disjoining force FTdepends only on the interfacial temperature but not on surface energy nor on the morphology of the local freezing interface.[31,38]The position change in this system does not bring about the temperature change of the freezing interface. Therefore,the changes in the local interface shapes will not affect the calculation results of disjoining force. Darcy viscous force FDis irrelevant to the local interface shapes either. The growth speed of the freezing interface v can be determined from[11,29]

where the Darcy coefficient D is related to the pressure drop across the particle layer,while the film coefficient F is related to the pressure drop in the pre-melted film,h is the dimensionless thickness of the particle layer, and −ziis the dimensionless distance of the ice front below the isotherm of equilibrium melting point.
The thickness of the particle layer and the position of the ice interface both evolve linearly at early stage but the growth rate of the layer decreases to zero while the growth rate of the freezing interface increases to the pulling speed at later stage once the flow resistance in the premelted film is dominant as indicated in Fig.9. Position −zi=1 corresponds to the isotherm of the ice-entry temperature. When α >1, the time dominated by the premelted film resistance will be advanced. The top of the particle layer recedes below the zerodegree isotherm(h <−zi)before −zireaches 1. The interior of the layer and the suspension above the layer becomes supercooled,so ice spears appear in Fig.9(b). However,when α decreases to less than 1,−zireaches 1 while the particle layer extends above the zero-degree isotherm, and the supercooled area in front of ice vanishes. So, a frozen fringe of pore ice forms within the particle layer in Fig.9(a). Therefore, with the decrease of α, the freezing microstructures changes from ice spears to frozen fringe.

Fig.9. Predicted dimensionless distance −zi (red curves)of ice front below the zero-degree isotherm and dimensionless thickness h of the consolidated layer of particles(black curves)for different values of α: (a)α <1 and(b)α >1.
Figure 10 is obtained according to the latest researches in the field of freezing colloidal suspensions. You et al.(2018)[11]and Scotti et al. (2019)[7]confirmed the force analysis and microstructural evolution among bandings,spears and dendrites. Now, we modify the force balance at the freezing interface by considering different thermal conductivities of particles, and we use the previous model to determine the microstructures, The result shows the effect of particle thermal conductivity on the morphological selection in freezing colloidal suspensions. When the thermal conductivity of particles is smaller than that of surrounding liquid (α <1), the freezing system tends to form the frozen fringe.Therefore,the region boundary of frozen fringe extends to the black dashed line (see Fig.10). Nevertheless, the freezing system tends to form ice spears when the thermal conductivity of particle is larger than that of surrounding liquid (α >1). Therefore,the region boundary of ice spears extends to the red dashed line (see Fig.10). These tendency predictions can explain why the polystyrene suspensions (α <1) are slightly harder to freeze into ice spears than the alumina suspensions(α >1)in experiment.[11]In future, some detailed experiments will be designed to confirm the local interfacial shapes and different microstructural evolutions under different particle thermal conductivities.

Fig.10.Modified morphological selections by particle thermal conductivity.
6. Limitations of work
The present work shows that the particle thermal conduction can affect interface movement,local interfacial shapes and interfacial forces(e.g.premelted viscous forces)in freezing colloidal suspensions through calculation and experiments. Therefore, the freezing microstructures can be disturbed by particle thermal conduction. However, some limitations still exist in the work. First, how strongly the particle thermal conduction affects the microstructural evolution is not verified in experiment. Meanwhile, how these effects are influenced by particle size remains unknown since thermal conduction in nanofluids is totally different from that in macrofluid. Second, the present model can predict the tendency in experiment but fails to make quantitative comparisons in Fig.6. Third, if a large glass plate is placed underneath the single cells in experiment, the thermal conduction of the cells will be strongly dependent on that of the large glass plate.[19]The effect of particle thermal conduction will be strongly disturbed by the large glass plate. These presented effects may be amplified in the freezing of nanofluids with size less than 10 nm. Here in this paper, we present some solutions to solve these limitations. In future,the local interfacial shape can be observed by cyro-TEM or a far-field optical microscope.[35,36]These nanostructures of the phase interface will elucidate the origin of microstructural evolution. And a detailed experiment should be designed to eliminate the lateral thermal conduction between the sample cell and the ambient. Or the lateral thermal conduction should be considered in simulation to satisfy the quantitative comparisons between simulations and experiments. In experiment, asbestos board insulation should be used to reduce radiative and convective perturbations in the gap of thermal gradient because the ambient temperature(16◦C–20◦C)is much higher than that of the sample cell(0◦C).Two thermocouples can be used to quantify the heat losses in the lateral thermal conduction between the sample cell and ambient temperature.One is for measuring the ambient temperature,and the other is for measuring the inner temperature in the setup. Then heat transfer from the ambient to the sample cell can be analyzed.
7. Conclusions
In the present work, we build up a mathematical model to investigate the thermal interactions between a growing particle layer/pulling speed and the interface movement under a thermal gradient. Experiments are conducted to confirm the tendency prediction of the model.
With the increase of pulling speed, the drift distance of the freezing interface increases and the time to finish drifting decreases. When the thermal conductivity of particles is smaller than that of the surrounding(α <1), the freezing interface tends to go forward to the warm side. Contrarily, the freezing interface tends to go back to the cold side when the thermal conductivity of particles is larger than that of the surrounding(α >1). It originates from the single particle model and the shape of local freezing interface. In the single-particle model,the local freezing interface becomes convex near to the warm side when α <1, while it becomes concave back to the cold side when α >1. These morphological changes in the local interface modify the premelting drag force Ff. When α <1, Ffdecreases and the freezing morphology tends to be the frozen fringe. When α >1, Ffincreases and the freezing morphology tends to be the ice spears. The understanding of how the thermal conductivity of particles affects the microstructural evolution in freezing colloidal suspensions may optimize the production of freeze-casting materials and their structural-functional properties.
Appendix A:Supporting information
Figure A1 shows the micro-morphologies of the particle layer,ice layer,and solidification interface at different pulling speeds. The thickness of the particle layer decreases with pulling speed increasing.

Fig.A1. Steady-state morphologies of freezing alumina suspensions under different pulling speeds: (a) 16.0 µm/s, (b) 8.2 µm/s, and (c)3.5µm/s.
Figure A2 shows that the drifting distances and drifting times in experiments are less than those in simulations. Their discrepancy is likely to be due to the difference in lateral thermal conduction between the sample cell temperature and ambient temperature in experiment,while the lateral thermal conduction is not considered in the simulation. The ambient temperature is much higher than that of the sample cell and the lateral thermal conduction between them will reduce the drifting distance and drifting time in experiment.

Fig.A2. Comparison of position–time curve between experiments and calculations.
Acknowledgement
Jia-Xue You thanks Prof. M Grae Worster and Dr. Gunnar G Peng in University of Cambridge,UK for their help with mathematics.
猜你喜欢
Chinese Physics B(2022年10期)2022-10-26
农业工程学报(2022年11期)2022-08-22
女友(2021年12期)2021-12-22
中国农资(2018年25期)2018-08-07
Chinese Physics B(2017年9期)2017-08-30
Chinese Physics B(2017年9期)2017-08-30
南方文学(2015年3期)2015-07-15
Defence Technology(2011年4期)2011-07-25
Defence Technology(2011年4期)2011-07-25
当代矿工(2011年8期)2011-03-31
- Chinese Physics B的其它文章
- Novel traveling wave solutions and stability analysis of perturbed Kaup–Newell Schr¨odinger dynamical model and its applications∗
- A local refinement purely meshless scheme for time fractional nonlinear Schr¨odinger equation in irregular geometry region∗
- Coherent-driving-assisted quantum speedup in Markovian channels∗
- Quantifying entanglement in terms of an operational way∗
- Tunable ponderomotive squeezing in an optomechanical system with two coupled resonators∗
- State transfer on two-fold Cayley trees via quantum walks∗