
DFT study of solvation of Li+/Na+in fluoroethylene carbonate/vinylene carbonate/ethylene sulfite solvents for lithium/sodium-based battery∗
2021-03-19 03:21QiLiu刘琦GuoqiangTan谭国强FengWu吴锋DaobinMu穆道斌andBorongWu吴伯荣
Chinese Physics B 2021年3期
Qi Liu(刘琦), Guoqiang Tan(谭国强), Feng Wu(吴锋), Daobin Mu(穆道斌), and Borong Wu(吴伯荣)
Beijing Key Laboratory of Environment Science and Engineering,School of Material Science and Engineering,Beijing Institute of Technology,Beijing 100081,China
Keywords: elelctrolyte,solvation,lithium ion battery,sodium ion battery
1. Introduction
Lithium ion battery has been applied in kinds of electric devices,[1-4]and sodium ion battery is very promising for large-scale grid energy storage system.[5-7]The electrochemical performance is closely related to the electrolyte property of lithium/sodium ion battery.[8-12]The functional solvents are necessary to optimize lithium/sodium battery electrochemical performance.[13-16]
Vinylene carbonate(VC),fluorinated ethylene carbonate(FEC), and ethylene sulfite (ES), etc. solvents were usually used as electrolyte additives to improve the lithium/sodium ion battery interface stability.[17-26]The research on their potential application as electrolyte solvents is also important.Wang et al. have investigated FEC organic solvent containing LiTFSI(0.75 mol·kg−1)salt as electrolyte to improve the safety of graphite||NMC based lithium ion battery by reducing flammability.[27]The 1.2 M FEC based electrolyte with LiPF6salt has been used in Li/Li and Cu/LiFePO4cells,forming nanostructured LiF particles SEI film and improving the electrochemical performance.[28]Lee et al.have demonstrated that FEC-based electrolyte with 1 M NaFSI salt stabilizes Na metal deposition during electrochemical cycling, the FECNaFSI constructs the NaF, Na2CO3, and sodium alkylcarbonates mechanically strong and ion-permeable interlayer.[29]FEC based co-solvent of FEC+DMC has been proposed for Mg2Si anode of lithium ion battery to improve cycling stability by forming LiF-rich SEI.[30]The FEC based FEC/TTE/DEC(2:2:1 vol.) mixed electrolyte has been used in anode-free battery of LiNi0.5Mn0.3Co0.2O2/Cu, forming LiF-richer SEI on the anode surface, improving the cycling performance of the battery.[31]FEC solvent in the Li4Ti5O12/LiNi0.5Mn1.5O4battery for the anti-oxidation electrolyte system has improved the electrochemical performance, FEC solvent is responsible the formation of stable,uniform SEI films on individual Li4Ti5O12particles.[32]FEC based electrolyte with FEC/dimethyl carbonate/HFE mixed solvents has been used to improve the performance of both lithium metal anode and high voltage LiCoO2cathode material.[33]Zeng et al. have proposed a fluorinated intermixture of FEC and di-(2,2,2 trifluoroethyl) carbonate (TFEC) based non-flammable electrolyte for lithium/sodium ion battery, improving the compatibility with Prussian blue sodium ion battery cathode and the cycling stability of the silicon nanoparticle anode of lithium ion battery.[34,35]In-situ Na deposition image has indicated that the use of ethylene carbonate(EC),DEC,and PC based electrolyte produces a large number of dendrites and gas releasing, and FEC co-solvent dramatically reduces the dendrite growth and gas releasing, meanwhile improves the cycling stability.[36]Kuratani et al. have studied the density, viscosity,and conductivity of 1.5-2.0 mol·dm−3XClO4(X=Li and Na)based electrolyte in PC and γ-butyrolactone,the NaCIO4based electrolyte enjoys higher ionic conductivity and lower viscosity compared with LiClO4, and the ionic conductivity of NaClO4based electrolyte is 10%-20% higher than that of LiClO4.[37]The density, viscosity, and ionic conductivity of Li- and Na-TFSI in γ-butyrolactone and PC based electrolytes at the condition of 0.1 mol/L ≤C ≤2.0 mol/L and 278 K ≤T ≤328 K have been investigated to understand the electrolyte solution chemistry, it is indicated that sodium ion electrolyte occupies more volume compared with lithium ion electrolyte, and sodium ion electrolyte enjoys higher mobility and conductivity.[38]Zhang et al. have reported vinylethylene carbonate (VEC) single solvent based electrolyte with 1 M lithium hexafluorophosphates salt, enabling high safety and long cycle life for Li-metal batteries, which is attributed to unique interphase property and easy Li+desolvation in VEC.[39]Jin et al. have found that the aliphatic chain and cross-linking poly(ethylene oxide) (PEO) with carboxylate and carbonate species SEIs are formed in pure VC or FEC electrolytes.[40]Sulfur-containing sulfolane based solvent has been developed,which enhances the Li+conductivity of NCA cathode SEI film and the interfacial stability.[41]Wu et al.have reported a novel ES based electrolyte for Li-O2batteries which shows excellent round-trip efficiency and high specific capacity.[42]Wang et al.’s study has indicated that the Li plating potential dropping is ascribed to the carbonate-containing unstable SEI layer,[43]and LiFSI improved lithium deposition in carbonate electrolyte.[44]Cosolvation of Li+and solvent reductive decomposition have been studied by density functional theory(DFT)method,indicating that the different interactions with Li+affect the formation of SEI film.[45]Quantum chemistry (QC) calculations have been used for the prediction of oxidation and reduction stability of electrolyte components such as EC, FEC, and VC.[13]Liu et al.’s study has indicated that the different solvation ionic numbers lead to the different HOMO levels.[9]DFT calculation also has been used to study the reduction mechanism of VC, ES, and FEC for lithium/sodium battery.[15,46]The oxidation/reduction potentials and decomposition of VC have been studied by quantum chemistry calculation.[47-49]The concerns of the researchers are mainly focused on the influence of electrolyte solvents to the SEI formation mechanism and the improvement of the electrochemical performance of the battery, the research on the solvation mechanism of Li+/Na+in FEC, VC, ES, etc.organic solvents is absent. We have studied the Li+/Na+solvation in commonly used carbonate esters and ethers based on previous studies.[50,51]It is important for understanding the performance improvement mechanism of lithium/sodium ion battery by comparing the Li+/Na+solvation property in these organic solvents.
The Li+/Na+solvation property in organic electrolyte solvents of VC, ES, and FEC is mainly investigated in this work. The energy,solvation structures,infrared spectrum,Raman spectrum, Gibbs free energy, and enthalpy of Li+/Na+-solvation complexes are compared. It is demonstrated that the solvation complexes of Li+with VC, ES, and FEC solvents are more stable compared with Na+solvation complexes. The discussion of detail method and result will be shown in the next part.
2. Computation method
B3LYP nonlocal correlation functional was used for the DFT calculations. The optimizations of structure and calculation of frequency were completed at B3LYP/6-311++G(d,p) level, the theoretical spectra analysis was obtained from frequency calculation. For more accurate calculation, B3LYP/6-311++G(3df,3dp) was used for all of the single point energy computation, and the energy was revised by zero-point energy calculation. ΔG = ΔThermal correction to Gibbs free energy (B3LYP/6-311+G(d,p)) +ΔE (B3LYP/6-311++G(3df,3dp)). ΔH = ΔThermal correction to enthalpy (B3LYP/6-311+G(d,p)) + ΔE (B3LYP/6-311++G(3df,3dp)). Enthalpies and Gibbs free energies were calculated at 298.15 K. Gaussian 09 program package was used for all DFT calculations.[52]
3. Results and discussion
3.1. Li+/Na+solvation in VC solvent
The Gibbs free energy curves of stepwise Li+and Na+solvation reactions to VC solvent in different ions concentration are shown in Fig.1(a). It is clearly exhibited that with VC molecule increasing, the ΔG for the stepwise reaction gradually increases, and when forming 4VC-Li+and 4VC-Na+solvation complexes, thermodynamic equilibrium for the reactions is reached. The ΔE, ΔH, and ΔG of the VC stepwise solvation reactions with Li+and Na+are exhibited in Table 1.

Table 1. The ΔE,ΔH,and ΔG of VC stepwise solvation reactions with Li+ and Na+,the unit is kcal·mol−1.

Fig.1. (a) The Gibbs free energy curves of stepwise Li+ and Na+ solvation reactions to VC solvent in different ions concentration. (b)nVC-Li+and nVC-Na+(1 ≤n ≤5)solvation complexes models. IR spectra of(c)nVC-Li+and(d)nVC-Na+complexes by DFT calculation.
It can be seen that the ΔG of stepwise solvation reactions VC+4VC-Na+=5VC-Na+and VC+4VC-Li+=5VC-Li+are 2.73 kcal·mol−1and 6.23 kcal·mol−1, respectively, indicating that stepwise reactions to form 5VC-Li+and 5VC-Na+solvation complexes are non-spontaneous processes.
Table 2. Lengths of all Li-O and Na-O bonds and the average length after optimization for nVC-Li+ and nVC-Na+ complexes,the units are.

Table 2. Lengths of all Li-O and Na-O bonds and the average length after optimization for nVC-Li+ and nVC-Na+ complexes,the units are.
VC-Li+ 1.75 1.75(average)2VC-Li+ 1.80 1.80 1.80(average)3VC-Li+ 1.86 1.86 1.86 1.86(average)4VC-Li+ 1.94 1.94 1.94 1.94 1.94(average)5VC-Li+ 2.15 2.00 2.00 2.12 2.02 2.06(average)VC-Na+ 2.13 2.13(average)2VC-Na+ 2.17 2.17 2.17(average)3VC-Na+ 2.22 2.22 2.21 2.22(average)4VC-Na+ 2.27 2.27 2.27 2.26 2.27(average)5VC-Na+ 2.36 2.31 2.36 2.31 2.32 2.33(average)
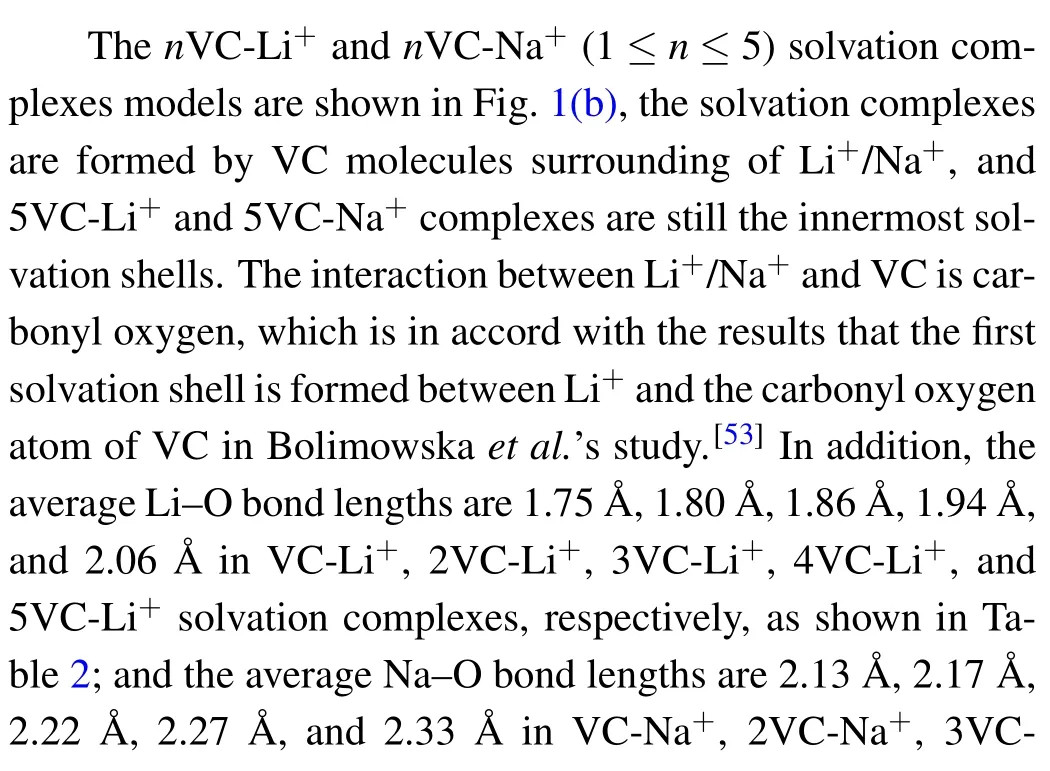

Figure 1(c) exhibits the theoretical IR spectra of nVCLi+. The vibration peak in 1815.01-1873.59 cm−1frequency range represents the stretching vibration of O=C in nVC-Li+solvation complexes,and with the Li+concentration reducing in nVC-Li+,the O=C peak evidently shifts to high frequency and the C=O bond is shortened(Table S1),it is in accord with the experimental FTIR spectrum results that O=C stretching vibration of VC is attributed to the peak at 1836 cm−1.[54]Besides,the three peaks in 1362.82-1385.38 cm−1,1181.17-1185.41 cm−1, and 1111.97-1168.08 cm−1frequency ranges represent different O-C stretching and H-C twist vibrations,when the Li+concentration decreases, all the above three vibration peaks shift to low frequency,and the peak in 1111.97-1168.08 cm−1exhibits the maximum frequency shift. The peak in 762.18-822.216 cm−1frequency range represents Li-O stretching accompanying with carbonate stretching in nVCLi+solvation complexes, when the concentration of lithium ion decreases from 2VC-Li+to 5VC-Li+, the vibration peak moves to low frequency, while the peak shifts to high frequency from VC-Li+to 2VC-Li+. The peak in 731.559-748.953 cm−1represents C-H twisting vibration in different nVC-Li+solvation complexes,the vibration shifts to low frequency with the decrease of Li+concentration. The Li-O stretching vibration in nVC-Li+solvation complexes is assigned to 376.039-619.7 cm−1frequency range which moves to low frequency when the complex changes from 2VC-Li+to 5VC-Li+. Figure 1(d) exhibits the theoretical IR spectra for nVC-Na+. From the figure, the peak in 1828.89-1878.62 cm−1represents the stretching vibration of O=C in nVC-Na+solvation complexes, with the sodium ion concentration decreasing, the vibration peak moves to high frequency and the C=O bond is shortened(Table S2). The frequency movement rule of nVC-Na+solvation complexes is in agreement with that of nVC-Li+. The results show that the different interactions of Li+and Na+with VC lead to the different C=O bond vibration peaks for the two kinds of solvation complexes, and the C=O vibration peak frequency in the nVC-Na+solvation complexes is higher than that of nVC-Li+, the difference becomes smaller when the solvent number increases in the complexes. Besides,the three peaks in 1360.26-1373.95 cm−1,1180.81-1182.38 cm−1,and 1109.49-1148.71 cm−1represent different stretching of OC and H-C twisting in nVC-Na+solvation complexes, the vibration peak shifts to low frequency with the decrease of Na+concentration. The vibration frequencies of the above three peaks in nVC-Na+solvation complexes are lower than those in nVC-Li+complexes. The vibration peak in 759.056-782.01 cm−1represents stretching of Na-O accompanying with carbonate stretching vibration, which moves to low frequency with the Na+concentration decreasing in the complexes. The vibration peak in 729.712-744.412 cm−1represents the twisting of H-C in the solvation complexes of nVCNa+, the peak shifts to low frequency with the decrease of Na+concentration. The twisting vibration frequency of H-C in nVC-Na+complexes is slightly lower than that in nVC-Li+.The stretching vibration of Na-O in nVC-Na+solvation complexes is assigned to 208.76-310.102 cm−1frequency range,the vibration peak shifts to low frequency when the sodium ion concentration changes from 2VC-Na+to 5VC-Na+.
On the other hand, the theoretical Raman spectra analysis of nVC-Li+complexes is exhibited in Fig.2(a), the vibration peaks in 3294.66-3321.08 cm−1represent stretching vibration of H-C in nVC-Li+solvation complexes. The C=C bond stretching vibration peak in nVC-Li+complexes is assigned to the frequency range of 1654.26-1661.37 cm−1,which slightly moves to high frequency when the Li+concentration decreases in the solvation complexes. The two Raman vibration peaks in 1183.43-1185.41 cm−1and 1089.18-1102.01 cm−1represent stretching of O-C accompanying with twisting vibration of C-H. The three vibration peaks in 1046.16-1050.88 cm−1,941.29-986.518 cm−1,and 911.503-918.111 cm−1represent different stretching of O-C in nVCLi+solvation complexes. The C-H twisting vibration peak in nVC-Li+solvation complexes is assigned to 847.531-857.607 cm−1, which moves to low frequency when the Li+concentration decreases. Besides, the Raman vibration peak in 768.177-817.172 cm−1represents Li-O stretching accompanying with carbonate stretching in nVC-Li+complexes,it is fundamentally in accord with the peak frequency of IR spectra. Figure 2(b)shows the theoretical Raman spectra of nVCNa+, the two peaks in 3293.52-3320.97 cm−1and 1658.01-1662.73 cm−1represent the stretching vibrations of C-H and C=C bonds respectively in the nVC-Na+solvation complexes. There is small difference for C-H and C=C vibration peak frequencies in nVC-Na+and nVC-Li+complexes,indicating that the interaction to C-H and C=C bonds is negligible between Li+/Na+and VC.In addition,the C-O stretching vibration in nVC-Na+complexes is assigned to the two peaks of 1039.52-1049.47 cm−1and 929.064-964.543 cm−1,which move to low frequency with the sodium ion concentration decreasing. The Raman vibration peak in 843.097-854.053 cm−1frequency range represents twisting of H-C in nVC-Na+complexes. The Raman vibration peak in 759.056-782.01 cm−1represents stretching of Na-O accompanying with carbonate stretching in nVC-Na+.

Fig.2. Raman spectra of(a)nVC-Li+ and(b)nVC-Na+ by DFT calculation.
3.2. Li+/Na+solvation in ES solvent
Except for VC solvent, the solvation of Li+/Na+in ES solvent is also studied. The Gibbs free energy curves of stepwise Li+and Na+solvation reactions to ES solvent in different ions concentration are exhibited in Fig.3(a). The thermodynamic equilibrium is reached after forming 4ES-Li+and 4ES-Na+for the stepwise solvation reactions.Table 3 exhibits ΔE, ΔH, and ΔG of the ES stepwise solvation reactions with Li+and Na+. The ΔG for reactions ES + 4ES-Li+= 5ESLi+and ES+4ES-Na+=5ES-Na+are 12.96 kcal·mol−1and 3.49 kcal·mol−1,respectively,suggesting non-spontaneous reaction processes to form 5ES-Li+and 5ES-Na+complexes.

Table 3. The ΔE,ΔH,and ΔG of ES stepwise solvation reactions with Li+and Na+,the unit is kcal·mol−1.

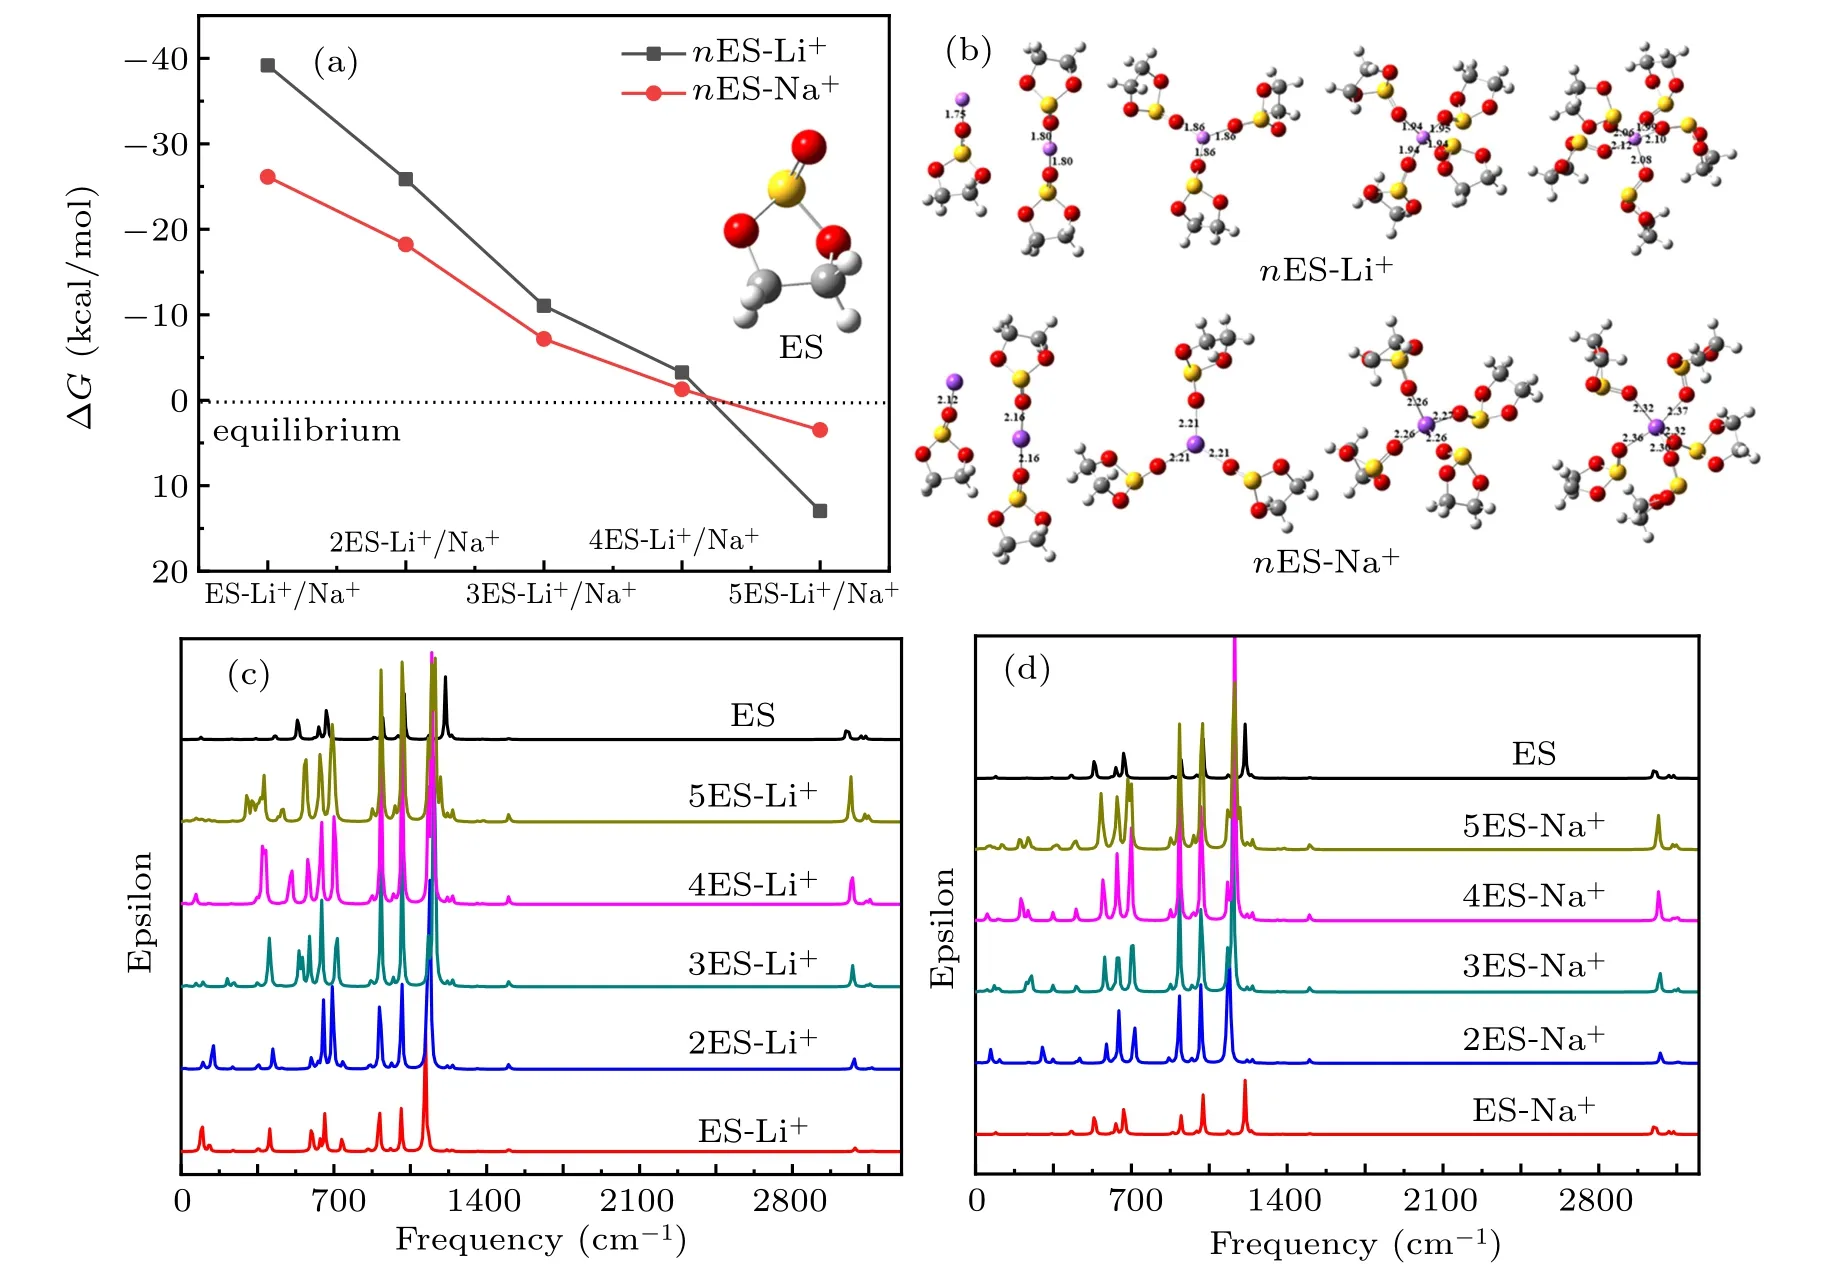
Fig.3.(a)The Gibbs free energy curves of stepwise Li+and Na+solvation reactions to ES solvent in different ions concentration. (b)nES-Li+and nES-Na+ (1 ≤n ≤5)solvation complexes models. IR spectra of(c)nES-Li+ and(d)nES-Na+ complexes by DFT calculation.
In addition, IR spectra of nES-Li+complexes by DFT calculation are shown in Fig.3(c),the S=O stretching vibration in nES-Li+solvation complexes is assigned to 1118.3-1189.37 cm−1frequency range, which moves to high frequency with the decrease of Li+concentration,and the S=O bond is also shortened(Table S3). The two peaks in 1008.79-1020.66 cm−1and 907.372-922.035 cm−1represent different stretching vibrations of O-C-C-O bonds,which move to high frequency with Li+concentration decreasing. Besides, the O-S-O symmetrical stretching vibration in nES-Li+solvation complexes is assigned to 692.627-742.714 cm−1, which moves to low frequency from 2ES-Li+to 5ES-Li+. The peak in the frequency range of 640.685-658.844 cm−1represents the asymmetric vibration of O-S-O in nES-Li+solvation complexes, the peak moves to low frequency with Li+concentration decreasing in the complexes. The peak in 565.743-598.221 cm−1represents the asymmetric vibration of O-S-O;and it shifts to low frequency from 2ES-Li+to 5ES-Li+. The peak in the frequency range of 303.443-421.853 cm−1represents O-Li stretching driving sulfite stretching,and the vibration peak shifts to low frequency from 2ES-Li+to 5ES-Li+.

Table 4. Length of all Li-O and Na-O bonds and the average length after optimization for nES-Li+ and nES-Na+ complexes,the units are ˚A.
On the other hand,the IR spectra of nES-Na+complexes by DFT calculation are exhibited in Fig.3(d), the peak in the frequency range of 1126.8-1165.37 cm−1represents the stretching vibration of S=O in the nES-Na+. The two peaks in 1012.19-1016.07 cm−1and 912.811-917.813 cm−1are on behalf of different stretching vibrations of O-C-C-O. Besides, the symmetric stretching vibration of O-S-O group in nES-Na+complexes is assigned to the frequency of 681.309-719.991 cm−1,which moves to low frequency with Na+concentration decreasing; because of the different interaction of ES molecules to Li+/Na+,the symmetric stretching vibration peak frequency in the nES-Na+complexes is evidently lower than that in nES-Li+complexes. The two peaks in 638.527-647.396 cm−1and 558.312-593.845 cm−1represent asymmetrical O-S-O stretching vibration in the nES-Na+complexes. Furthermore, the stretching vibration of Na-O in the nES-Na+complexes is assigned to the frequency of 200.708-302.905 cm−1.
Figure 4(a) shows the Raman spectra of nES-Li+by DFT calculation. The C-H stretching vibration in nES-Li+complexes is assigned to the peak in the frequency range of 3070.12-3167.78 cm−1. Besides, the three peaks at about 1500 cm−1, 1242 cm−1, and 1218 cm−1represent different C-H twisting vibrations in nES-Li+complexes. The S=O Raman stretching vibration frequency in the nES-Li+complexes is assigned to 1118.3-1178.31 cm−1. The two Raman peaks in 1008.79-1012.39 cm−1and 907.372-919.306 cm−1represent different stretching vibrations of O-C-C-O in the nES-Li+complexes. The Raman vibration peak in 708.235-737.643 cm−1represents symmetrical O-S-O stretching vibration in the nES-Li+complexes.
On the other hand, the Raman spectra of nES-Na+by DFT calculation are shown in Fig.4(b), the Raman stretching vibration of C-H in the nES-Na+solvation complexes is assigned to the peak of 3063.18-3162.13 cm−1. The three Raman peaks in 1500.38-1503.32 cm−1, 1242.33-1243.68 cm−1, and 1218.87-1221.83 cm−1represent the different twisting vibrations of C-H in the nES-Na+solvation complexes, the vibration peak frequency of C-H twisting in nES-Na+complexes is slightly higher than that in nES-Li+.The S=O Raman stretching vibration in nES-Na+is assigned to the frequency of 1126.8-1186.42 cm−1, and the S=O vibration frequency in nES-Na+complexes is higher than that in nES-Li+. In addition, the two Raman peaks in 1012.19-1016.07 cm−1and 912.811-919.593 cm−1represent different stretching vibrations of O-C-C-O in nES-Na+complexes.The symmetric O-S-O Raman stretching vibration in nESNa+is assigned to the peak of 689.831-719.991 cm−1.

Fig.4. Raman spectra of(a)nES-Li+ and(b)nES-Na+by DFT calculation.
3.3. Li+/Na+solvation in FEC solvent

Table 5.The ΔE,ΔH,and ΔG of FEC stepwise solvation reactions with Li+ and Na+,the unit is kcal·mol−1.
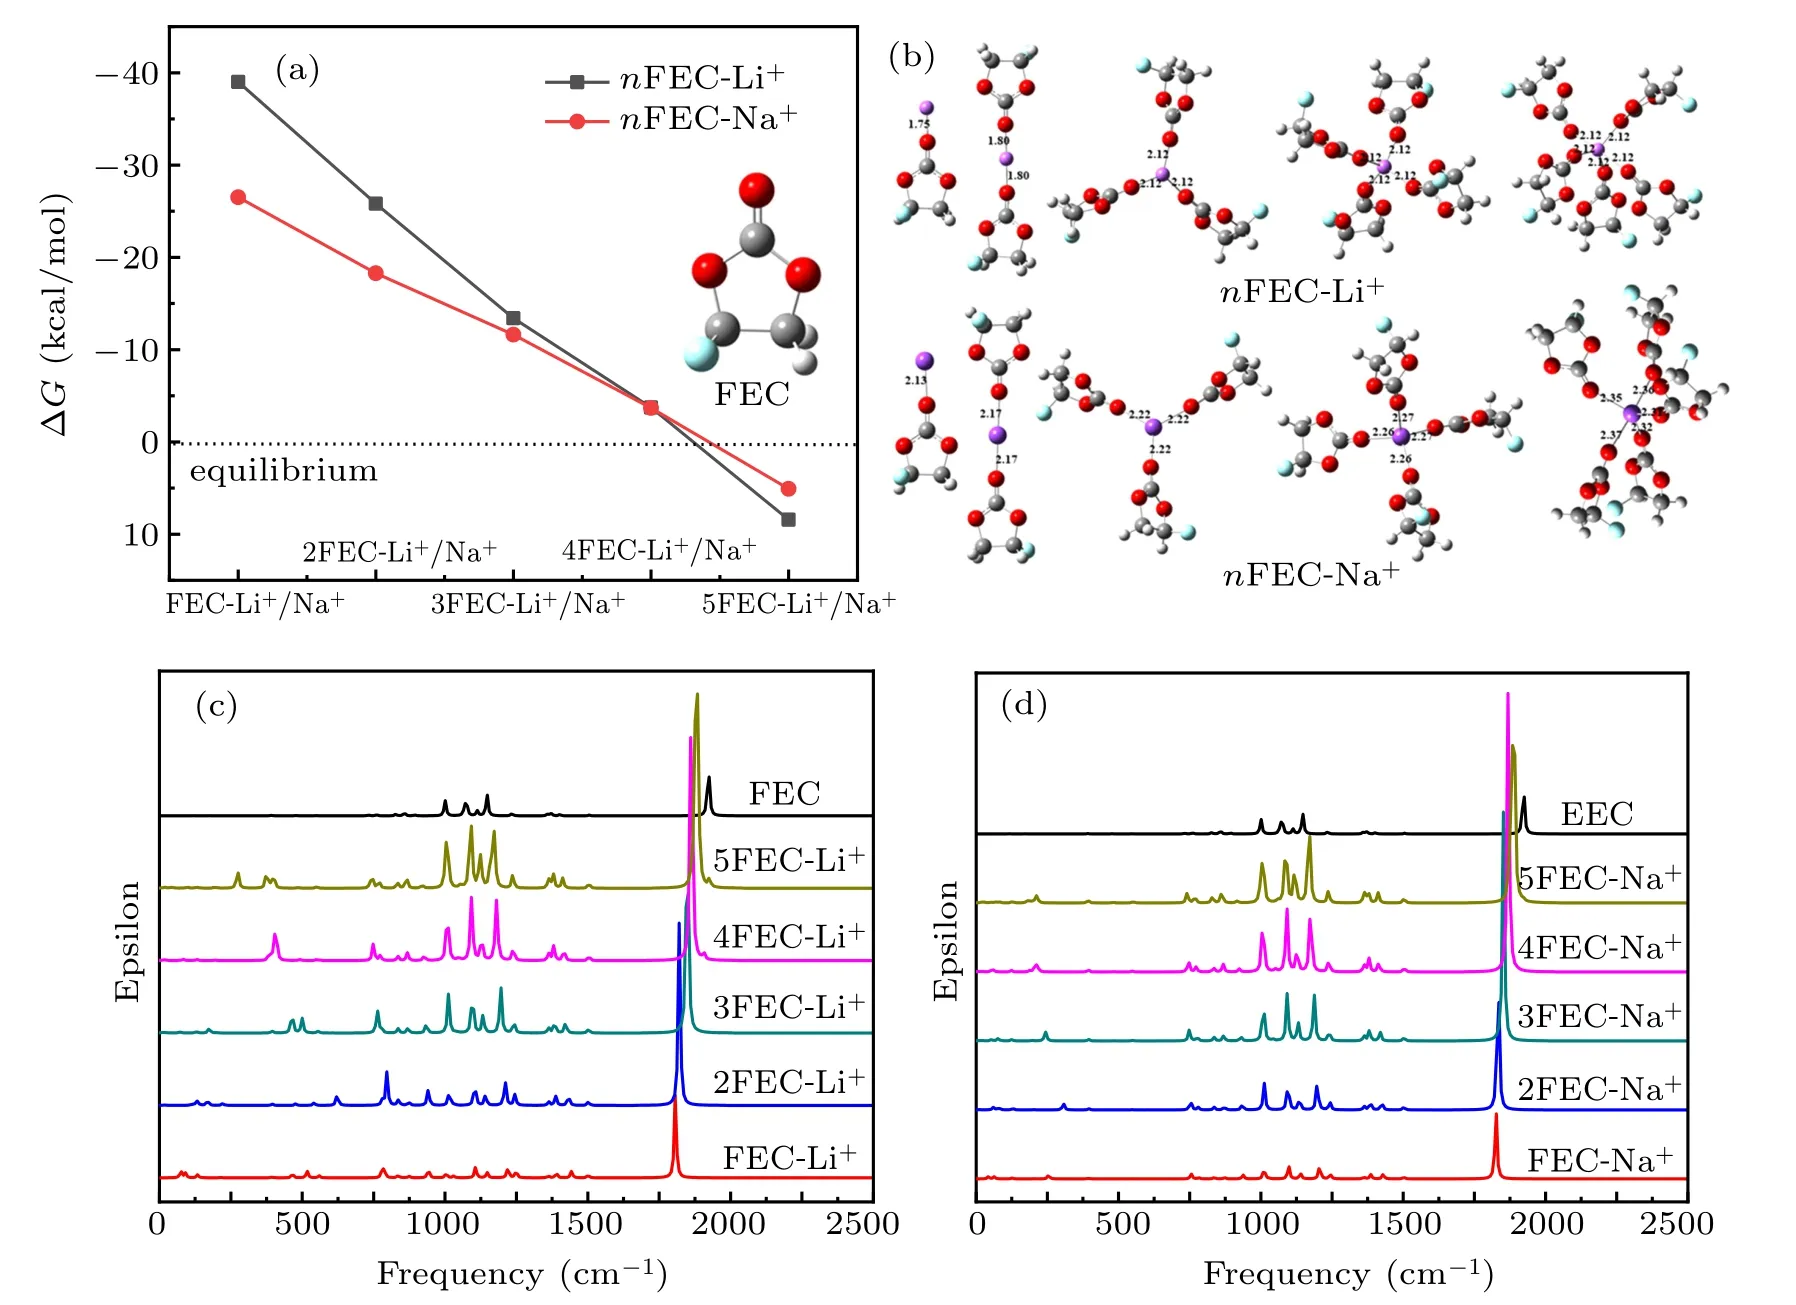
Fig.5. (a)The Gibbs free energy curves of stepwise Li+ and Na+ solvation reactions to FEC solvent in different ions concentration. (b)nFEC-Li+and nFEC-Na+ (1 ≤n ≤5)solvation complexes models. IR spectra of(c)nFEC-Li+ and(d)nFEC-Na+ complexes by DFT calculation.
On the other hand, the IR spectra of nFEC-Na+complexes by DFT calculation are exhibited in Fig.5(d),the C=O stretching vibration peak in the nFEC-Na+complexes is assigned to the frequency of 1825.67-1889.31 cm−1, with the concentration of Na+decreasing the peak shifts to high frequency and the C=O bond is shortened (Table S6). The frequency of C=O stretching vibration peak for nFEC-Na+complexes is higher than that of nFEC-Li+. The two peaks in 1238.07-1243.58 cm−1and 1168.54-1206.39 cm−1represent stretching of O-C accompanying with twisting of C-H vibration in nFEC-Na+, and the vibration frequency moves to low frequency with the sodium ion concentration decreasing. Besides, the two peaks in 1119.07-1138.99 cm−1and 1088.06-1097.41 cm−1represent stretching of C-O accompanying with stretching of C-F,and the peaks also shift to low frequency with the sodium ion concentration decreasing in the nFEC-Na+complexes. The CH2-O stretching driving C-F stretching vibration in the nFEC-Na+is assigned to the peak in the frequency range of 1007.36-1011.62 cm−1. Furthermore,the peak in 741.512-755.315 cm−1represents O-Na stretching accompanying with carbonate stretching vibration in the nFEC-Na+complexes,which moves to low frequency with the sodium ion concentration decreasing in the complexes. The O-Na stretching vibration peak in the nFEC-Na+is assigned to the frequency of 211.156-306.307 cm−1.
Table 6. Lengths of all Li-O and Na-O bonds and the average length after optimization for nFEC-Li+ and nFEC-Na+ complexes, the units are .

Table 6. Lengths of all Li-O and Na-O bonds and the average length after optimization for nFEC-Li+ and nFEC-Na+ complexes, the units are .
FEC-Li+ 1.75 1.75(average)2FEC-Li+ 1.80 1.80 1.80(average)3FEC-Li+ 1.86 1.86 1.86 1.86(average)4FEC-Li+ 1.94 1.94 1.94 1.94 1.94(average)5FEC-Li+ 1.98 2.32 1.99 1.98 2.06 2.07(average)FEC-Na+ 2.13 2.13(average)2FEC-Na+ 2.17 2.17 2.17(average)3FEC-Na+ 2.22 2.22 2.22 2.22(average)4FEC-Na+ 2.27 2.27 2.26 2.26 2.27(average)5FEC-Na+ 2.31 2.37 2.32 2.35 2.36 2.34(average)
Figure 6(a) shows the Raman spectra of nFEC-Li+by DFT calculation. The C-H stretching vibration in the nFECLi+solvation complexes is assigned to the frequency of 3099.54-3319.78 cm−1. The peak at about 1501 cm−1represents twisting vibration of C-H in the nFEC-Li+complexes.The FEC ring enlargement vibration in the nFEC-Li+complexes is assigned to the frequency of 926.229-941.81 cm−1which moves to low frequency with the lithium ion concentration decreasing. The Raman peak in 867.656-873.965 cm−1represents stretching vibration of C-C in nFEC-Li+complexes, and the peak shifts to low frequency with the decrease of the Li+concentration. Besides, the Raman peak in 748.187-779.833 cm−1represents O-Li stretching accompanying with carbonate stretching vibration in the nFEC-Li+complexes.
On the other hand, figure 6(b) exhibits the Raman spectra of nFEC-Na+by DFT calculation. The C-H stretching vibration peak in the nFEC-Na+complexes is assigned to the frequency of 3085.76-3170.68 cm−1,which moves to low frequency with sodium ion concentration decreasing.The Raman peak at about 1503 cm−1represents twisting vibration of CH in the nFEC-Na+complexes. The FEC ring enlargement stretching vibration peak in the nFEC-Na+complexes is assigned to the frequency of 916.897-937.212 cm−1. The peak in 860.869-872.501 cm−1is ascribed to stretching vibration of C-C in the nFEC-Na+complexes,and the peak moves to low frequency with the sodium ion concentration decreasing. Besides,the peak in 742.024-755.315 cm−1represents stretching of Na-O accompanying with stretching vibration of carbonate,the vibration peak moves to low frequency with the sodium ion concentration decreasing.

Fig.6. Raman spectra of (a) nFEC-Li+ and (b) nFEC-Na+ by DFT calculation.
At last, the stepwise solvation reactions and total solvation reactions Gibbs free energy change ΔG for Li+/Na+in the potential electrolyte solvents of VC, ES, and FEC are analyzed. Figure 7(a) shows the Gibbs free energy curve for Li+/Na+stepwise solvation reactions in VC, ES, and FEC, respectively, with solvent numbers changed. The maximum thermodynamics stability solvation complexes are consisted of 4VC-Li+, 4VC-Na+, 4ES-Li+, 4ES-Na+, 4FECLi+, and 4FEC-Na+by spontaneous solvation reactions between Li+/Na+and VC,ES,FEC solvents. Figure 7(b)shows the Gibbs free energy curve for the overall Li+/Na+solvation reactions with the change of solvation numbers. It is clearly seen that the absolute value of Gibbs free energy releasing(ΔG)reaches the maximum by overall Li+/Na+solvation reactions forming 4sol-Li+/Na+complexes, which is in agreement with the above stepwise solvation reaction results. In addition,it is clearly exhibited that the absolute values of free energy releasing(ΔG)for forming lithium-ion solvation complexes of nVC-Li+, nES-Li+, nFEC-Li+are evidently larger than those for formation of nVC-Na+, nES-Na+, nFEC-Na+complexes, indicating that lithium ion is easier to combine with VC,ES,and FEC compared to sodium ion,and lithiumion solvation complexes of nVC-Li+, nES-Li+, and nFECLi+are more stable compared with nVC-Na+,nES-Na+,and nFEC-Na+sodium ion solvation complexes.
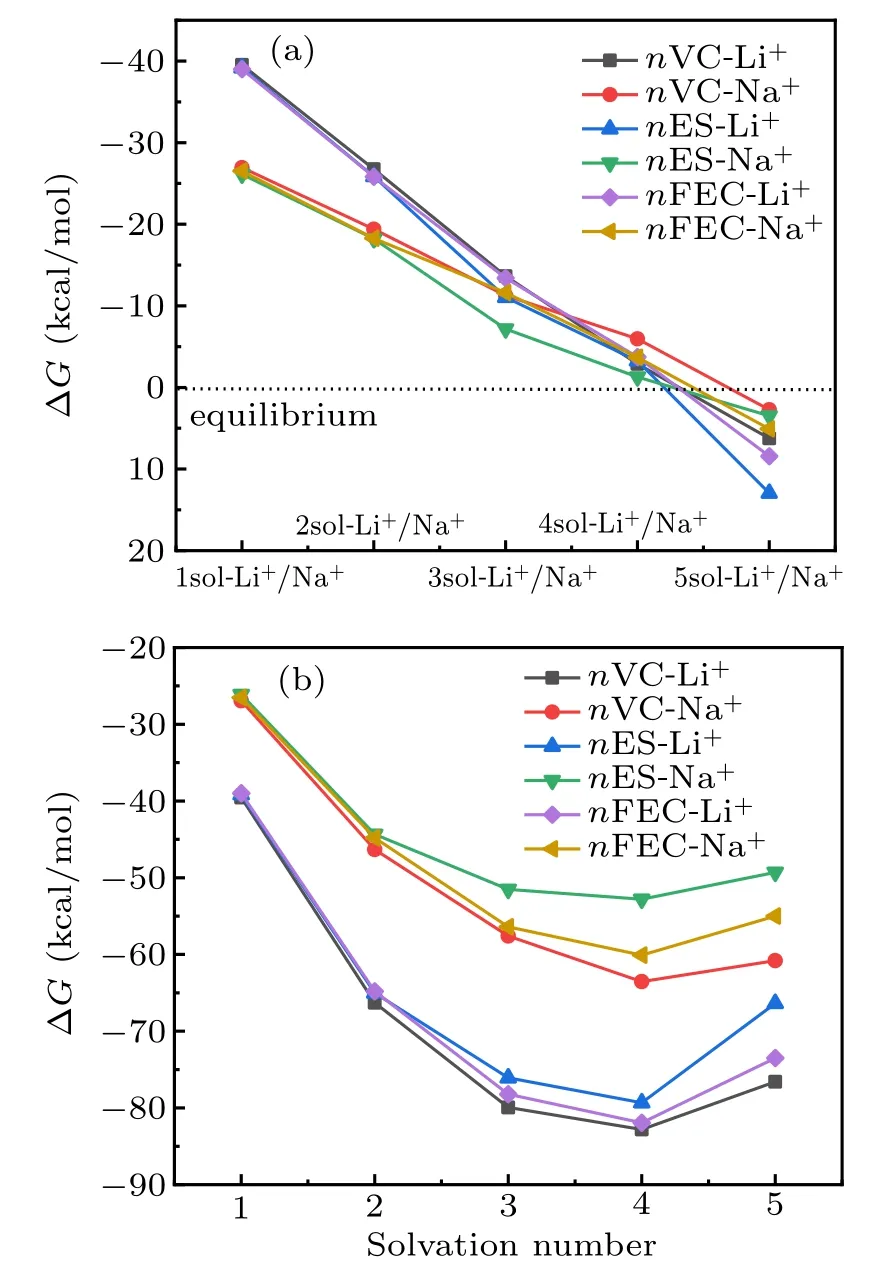
Fig.7. (a) Gibbs free energy curves for Li+/Na+ stepwise solvation reactions in VC,ES,and FEC,respectively,with solvent numbers changed. (b)Gibbs free energy curve for the overall Li+/Na+ solvation reactions with the change of solvation numbers.
4. Conclusion
Electrolyte solvents are very important to the electrochemical performance of lithium/sodium batteries. The solvation property of lithium/sodium ion in organic electrolyte solvents of VC, ES, and FEC is studied by DFT method.The results demonstrate that the maximum thermodynamics stability solvation complexes are consisted of 4VC-Li+,4VC-Na+, 4ES-Li+, 4ES-Na+, 4FEC-Li+, and 4FEC-Na+.The innermost solvation shells of 5VC-Li+, 5VC-Na+, 5ESLi+,5ES-Na+,5FEC-Li+,and 5FEC-Na+can be formed between Li+/Na+and solvent molecules. In addition, the results demonstrate that lithium ion is easier to combine with VC, ES, and FEC compared to sodium ion, and lithiumion solvation complexes of nVC-Li+, nES-Li+, and nFECLi+are more stable than nVC-Na+, nES-Na+, and nFECNa+sodium ion solvation complexes. Besides, the theoretical IR and Raman spectra analysis for the solvation complexes between Li+/Na+and VC, ES, FEC solvents demonstrates that the stretching vibration of O=C peak evidently shifts to high frequency when Li+/Na+concentration reducing in nVC-Li+,nVC-Na+,nFEC-Li+,and nFEC-Na+solvation complexes,and the O=C vibration in the Na+solvation complexes is higher than that of Li+complexes.The S=O vibration frequency in nES-Na+complexes is higher than that of nES-Li+,and the S=O stretching vibration in nES-Li+/Na+solvation complexes moves to high frequency with the decrease of Li+/Na+concentration. Besides, the stretching vibration of O-S-O group in nES-Na+/Li+complexes moves to low frequency with ion concentration decreasing, and the peak in nES-Na+complexes is lower than that of nES-Li+.The vibration peaks frequency occurs regular shift when the Li+/Na+concentration changes,and the different interactions for Li+and Na+with these solvents lead to the diverse characteristic peak frequencies for Li+/Na+solvation complexes.The results are important to guide the design of electrolyte and understand the performance improvement mechanism of lithium/sodium battery. In addition, different solvation complexes concentration may affect the reduction/oxidation potential, and solvation ionic is important for the initial stages of SEI formation. More studies on oxidation/reduction potentials of different solvation ionics are needed to deeply analyze the formation mechanism of the SEI film.

- Chinese Physics B的其它文章
- Transport property of inhomogeneous strained graphene∗
- Beam steering characteristics in high-power quantum-cascade lasers emitting at ~4.6µm∗
- Multi-scale molecular dynamics simulations and applications on mechanosensitive proteins of integrins∗
- Enhanced spin-orbit torque efficiency in Pt100−xNix alloy based magnetic bilayer∗
- Soliton interactions and asymptotic state analysis in a discrete nonlocal nonlinear self-dual network equation of reverse-space type∗
- Discontinuous event-trigger scheme for global stabilization of state-dependent switching neural networks with communication delay∗