
Parameterizations of drag coefficient and aerodynamic roughness length using the turbulence data collected during typhoons Hagupit and Chanthu*
2021-03-25 10:27ZHANGXiaohuaBIXueyanGAOZhiqiuLIUChangweiPENGWenwuZENGZhihuaYANGNanLIYubin
热带海洋学报 2021年2期
ZHANG Xiaohua , BI Xueyan , GAO Zhiqiu , , LIU Changwei , PENG Wenwu , ZENG Zhihua , YANG Nan , LI Yubin
1. Collaborative Innovation Center on Forecast and Evaluation of Meteorological Disasters, School of Atmospheric physics, Nanjing University of Information Science and Technology, Nanjing 210044, China;
2. Guangzhou Institute of Tropical and Marine Meteorology, China Meteorological Administration, Guangzhou 510640, China;
3. Guangdong Province Key Laboratory for Climate Change and Natural Disaster Studies, School of Atmospheric Sciences, Sun Yat-sen University, Zhuhai 510275, China;
4. State Key Laboratory of Atmospheric Boundary Layer Physics and Atmospheric Chemistry, Institute of Atmospheric Physics, Chinese Academy of Sciences, Beijing 100029, China;
5. Shanghai Typhoon Institute, China Meteorological Administration, Shanghai 200030, China
Abstract: The drag coefficient and aerodynamic roughness length of the sea surface are essential in calculating momentum, heat and water-vapor exchanges between the air and sea. With the observations collected by eddy covariance systems during typhoons Hagupit and Chanthu, we investigated parameterization relationships of 10-m wind speed with friction velocity, drag coefficient, and aerodynamic roughness length of the sea surface. Results show parabolic relationships between drag coefficient and friction velocity, and between drag coefficient and 10-m wind speed; results also show exponential relationships between aerodynamic roughness length and friction velocity, and between aerodynamic roughness and 10-m wind speed. We found that the critical friction velocity is 0.83 m·s–1 and critical 10m wind speed is 23.69 m·s–1.
Key words: aerodynamic roughness length; drag coefficient; parameterization; Typhoon Hagupit; Typhoon Chanthu
The dependent relationships of drag coefficient (Cd) and aerodynamic roughness length (z0) on 10-m wind speed and wave parameters (significant wave height and wave phase velocity) under the moderate wind speed regime have been extensively investigated (e.g., Donelan, 1990; Donelan et al, 1993, 2012; Gao et al, 2006, 2012; Ming et al, 2016; Peng et al, 2019). There was an increasing interest in developing parameterization schemes for Cdunder typhoon conditions in the last 20 years. Powell et al (2003) found that the drag coefficient reached its peak when wind speed was about 40 m·s–1in their Global Positioning System sonde observations. Donelan et al (2004) found constant drag coefficients under high winds in their laboratory measurements. Troitskaya et al (2012) examined theoretically and experimentally laboratory saturation of the drag coefficient at wind speed exceeding 25 m·s–1; and other attempts were made on the topic, including Alamaro et al (2002), Makin (2005), Black et al (2007), Kudryavtsev et al (2007), Soloviev et al (2014), and Golbraikh et al (2016). As Donelan (2018) pointed out these studies explored the physics behind field or laboratory observations, but they did not provide a simple prescription that may be used in a fully coupled (atmosphere-wave-ocean) typhoon prediction model. Donelan (2018) revealed a similar Reynolds number dependence of the oceanic sheltering coefficient, and a drag coefficient function of Reynolds number, wave age, and wind speed. They showed that the drag coefficient reached its peak at wind speed of 30 m·s–1. However, the equations derived by Donelan (2018) involve many wave parameters, bringing more challenges to modeling efforts because these parameters keep changing and cannot be measured easily during typhoon events. Green et al (2013, 2014) proposed an empirical quadratic equation to parameterize Cdusing 10-m wind speed. Peng et al (2015) proposed a parabolic model of the drag coefficient for storm surge simulation in the South China Sea. It is obvious that there is no general agreement in the scientific community regarding parameterization of Cdunder high wind conditions (Anctil et al, 2010; Zachry et al, 2013).
The objective of this paper is to develop new parameterization equations of Cdand aerodynamic roughness length (z0) under high wind conditions for use in an atmospheric typhoon model. To achieve this goal, we concentrated on analyzing the relationship between friction velocity and 10-m wind speed using turbulence data collected by Gill Wind-master Pro ultrasonic anemometers, which have a sampling frequency of 10 Hz and is quipped at a 100-m tower located at Zhizai Island during typhoons Hagupit and Chanthu. This tower was operated by the Guangdong Climate Center (Bi et al, 2015).
1 Materials and Methods
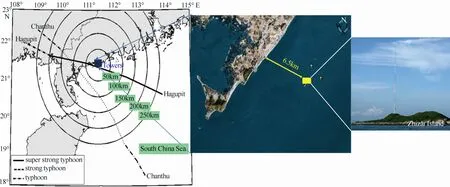
Fig. 1 Map of typhoons Hagupit and Chanthu along with the location of the observational tower. The black circles mark the radii to the tower of 50, 100, 150, 200, and 250 km [Drawing review No: GS(2019)3266]
Tracks of typhoons Hagupit and Chanthu are shown in Fig. 1, along with the location of the observation tower. The tower, operated by the Guangdong Climate Centre, is on Zhizai Island (21°27′12″N, 111°22′28″E), which has an above- water area of approximately 90 m × 40 m covered by sand and sparse weeds. The tower is 10 m above the sea level (Wang et al, 2013). Gill Windmaster Pro ultrasonic anemometers with a sampling frequency of 10 Hz were placed on the 2.5-m booms at a height of 60 m during Typhoon Hagupit and at a height of 40 m during Typhoon Chanthu. The instruments were placed on the east side of the tower facing the sea to minimize flow distortion. Turbulent three-dimensional wind speed quality control was made (Bi et al, 2015). To eliminate the influence of different heights on result comparison, the 10-m wind speeds were extrapolated from wind speeds measured at the heights of 60 and 40 m using the logarithmic wind profile. The logarithmic wind profile method may have some uncertainty in typhoon environment, but there is no better method to our knowledge.
Figure 2 shows the time series of neutral 10-m wind speed (V10n) and wind direction (α) of typhoons Hagupit (Fig. 2a) and Chanthu (Fig. 2b). The time intervals for both typhoons’ data are 10 minutes. It is obvious that the observed V10ndramatically increased (decreased) when the typhoon eye approached (departed from) the tower. The observed highest wind speed is 40.2 m·s–1for Typhoon Hagupit and 32.1 m·s–1for Typhoon Chanthu. The eye of Hagupit almost passed through the observation tower. On September 24, 2008, V10nreached 40.2 m·s–1at 4:30 local standard time (LST), and then dropped sharply to 10.8 m·s–1at 6:00 LST when the typhoon eye was the closest to the tower. With the typhoon eye moving away, V10nincreased rapidly, to 34.8 m·s–1at 7:00 LST. Typhoon Hagupit landed on 2008 September 24 as shown in Fig. 2a.

Fig. 2 Time series of neutral 10-m wind speed (V10n) and wind direction (α) measured during Typhoon Hagupit (a) and Typhoon Chanthu (b)
Under typhoon conditions, the surface layer is generally considered to be in neutral stratification. The neutral drag coefficient (Cdn) is defined as:
The wind profile equation as:
Then the surface aerodynamic roughness length (z0) is calculated as:
where u*is the friction velocity (units: m·s–1), V10nis neutral 10-m wind speed (units: m·s–1), k is the von Karman constant (no units), and z0is the sea surface aerodynamic roughness length (units: m). u*and V10nare obtained from turbulent 3-D wind speed measurements.
2 Results and Discussion
2.1 Variation of friction velocity against 10-m wind speed
Figure 3 is a scatterplot of friction velocity (u*) against 10-m wind speed (V10n). Overall, u*increased with increasing V10n. During the typhoon landing process, the change of typhoon underlying surface (switching from the sea surface to land surface) will lead to a sharp increase in friction velocity. Additionally, the data collected during the typhoon landing process is not comparable to the data collected before and after the landing, because of the different atmospheric stratification condition inside and outside of the eyewall. Therefore, we excluded the data collected during the landing process of Typhoon Hagupit in the following analysis (marked by a black dashed circle in Fig. 3). The landing site of Typhoon Chanthu was far away from the observation tower. Therefore, our sensor failed to capture the impact of typhoon landing process on wind speed and friction velocity. Figure 3 shows that most of our data were collected with the 10-m wind speed of less than 16 m·s–1during the two typhoons. Statistically, the non-uniformity of the sample distribution can affect statistical results, which means that if the data in Fig. 3 are used to regress the relationship between the friction velocity and 10-m wind speed, the relationship should be more representative when the wind speed is less than 16 m·s–1. Therefore, in Fig. 4 we group the data, with a 10-m wind speed range of 2 m·s–1per group. Figure 4 plots the median of each set of data, and we also label the number of samples for each set of data. For example, for groups with wind speeds greater than 10 m·s–1and less than or equal to 12 m·s–1, data samples for typhoons Hagupit and Chantha are 20 m·s–1and 44 m·s–1, respectively. Figure 4 shows the friction velocity (median) as a function of 10-m wind speed. The two curves are very close to each other. The slight differences between them may be caused by differences in wind direction, water depth and measurement footprints of the two typhoons. Considering that the number of data samples of the two typhoons decreased gradually with the increase of 10-m wind speed, and that the changes of frictional velocity with the 10-m wind speed are consistent in the two typhoons, we combine the observation data of the two typhoons, and show the medians of these observations in Fig. 4. The number of samples for each set of data is given in Fig. 4 as well.
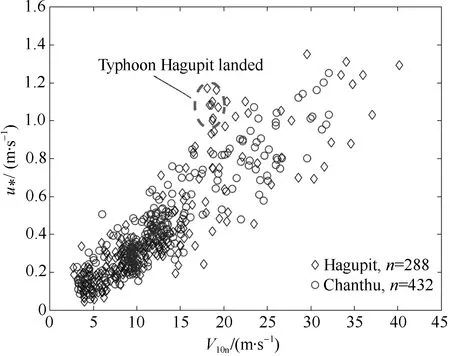
Fig. 3 Scattered plot of friction velocity (u*) against 10-m wind speed (V10n) measured during Typhoon Hagupit (diamonds) and Typhoon Chanthu (circles)
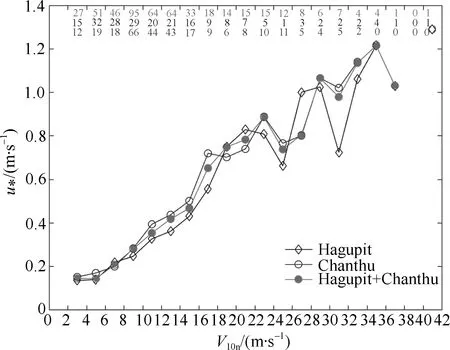
Fig.4 The median values of friction velocity (u*) against 10-m wind speed (V10n) measured during Typhoon Hagupit and Typhoon Chanthu. The black diamonds and black circles are the medium friction velocities for typhoons Hagupit and Chanthu, respectively. The gray circles are the medium friction velocity for the combined data of typhoons Hagupit and Chanthu. The number of samples for each set of data is shown at the top (data samples for combined data of typhoons Hagupit and Chanthu, Hagupit and Chantha, respectively)
2.2 Parameterizations of drag coefficient and aerodynamic roughness length
The drag coefficient (Cdn) is calculated using Equation (1). Using the best approximation method, we regressed the relationship between Cdnand friction velocity (u*) as follows:

and, the relationship between Cdnand V10nas follows:

A quadratic (parabolic) relationship is found between Cdnand u*(Fig. 5a). Based on the maximum value of Cdnof around (32.00 ~ 33.00 m·s–1) in the field measurements of Powell et al (2003) and Jarosz et al (2007), Peng et al (2015) proposed a parabolic model of Cdn(Equation 6) for storm surge simulation in the South China Sea, and found that it outperforms traditional linear models.
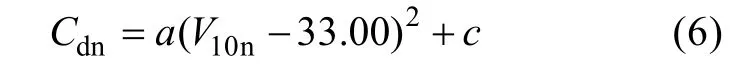
where a and c are regression coefficients. Comparison between Equations (5) and (6) shows that there is a quadratic (parabolic) relationship between Cdnand V10n(Fig. 5b), although the saturated wind speed and the regression coefficients are different in Equations (5 and 6).
In the early studies of Cdnunder low to moderate wind speed (about 20 m·s–1) conditions, Cdnis considered to be a linear function of V10n, i.e., Cdnincreases linearly with increasing wind speed. This linear relationship can be confirmed by many experiments because the parabolic single (left) branch does exhibit more or less the linear growth behavior in Figs. 5a and 5b.
We substituted the data in Fig. 4 into Equation (3) and calculated the aerodynamic rough length (z0) of the sea surface. Figure 5c shows z0as a function of u*, and Fig. 5d shows z0as a function of V10n. Using the error analysis method, Johnson et al (1998) showed in detail that Equation (3) means z0is extremely sensitive to measurement errors in both u*and V10n; so the distributions of the dots in Figs. 5c and 5d are very scattered. Even though z0depends on both u*and V10n, Fig. 5c only shows the change of z0with u*and Fig. 5d only shows the change of z0with V10n. This increases the scatter of the data distributions in Figs. 5c and 5d.
Correspondingly, using the best approximation method, we regressed the relationship between z0and u*as follows:

and, the relationship between z0and V10nas follows:
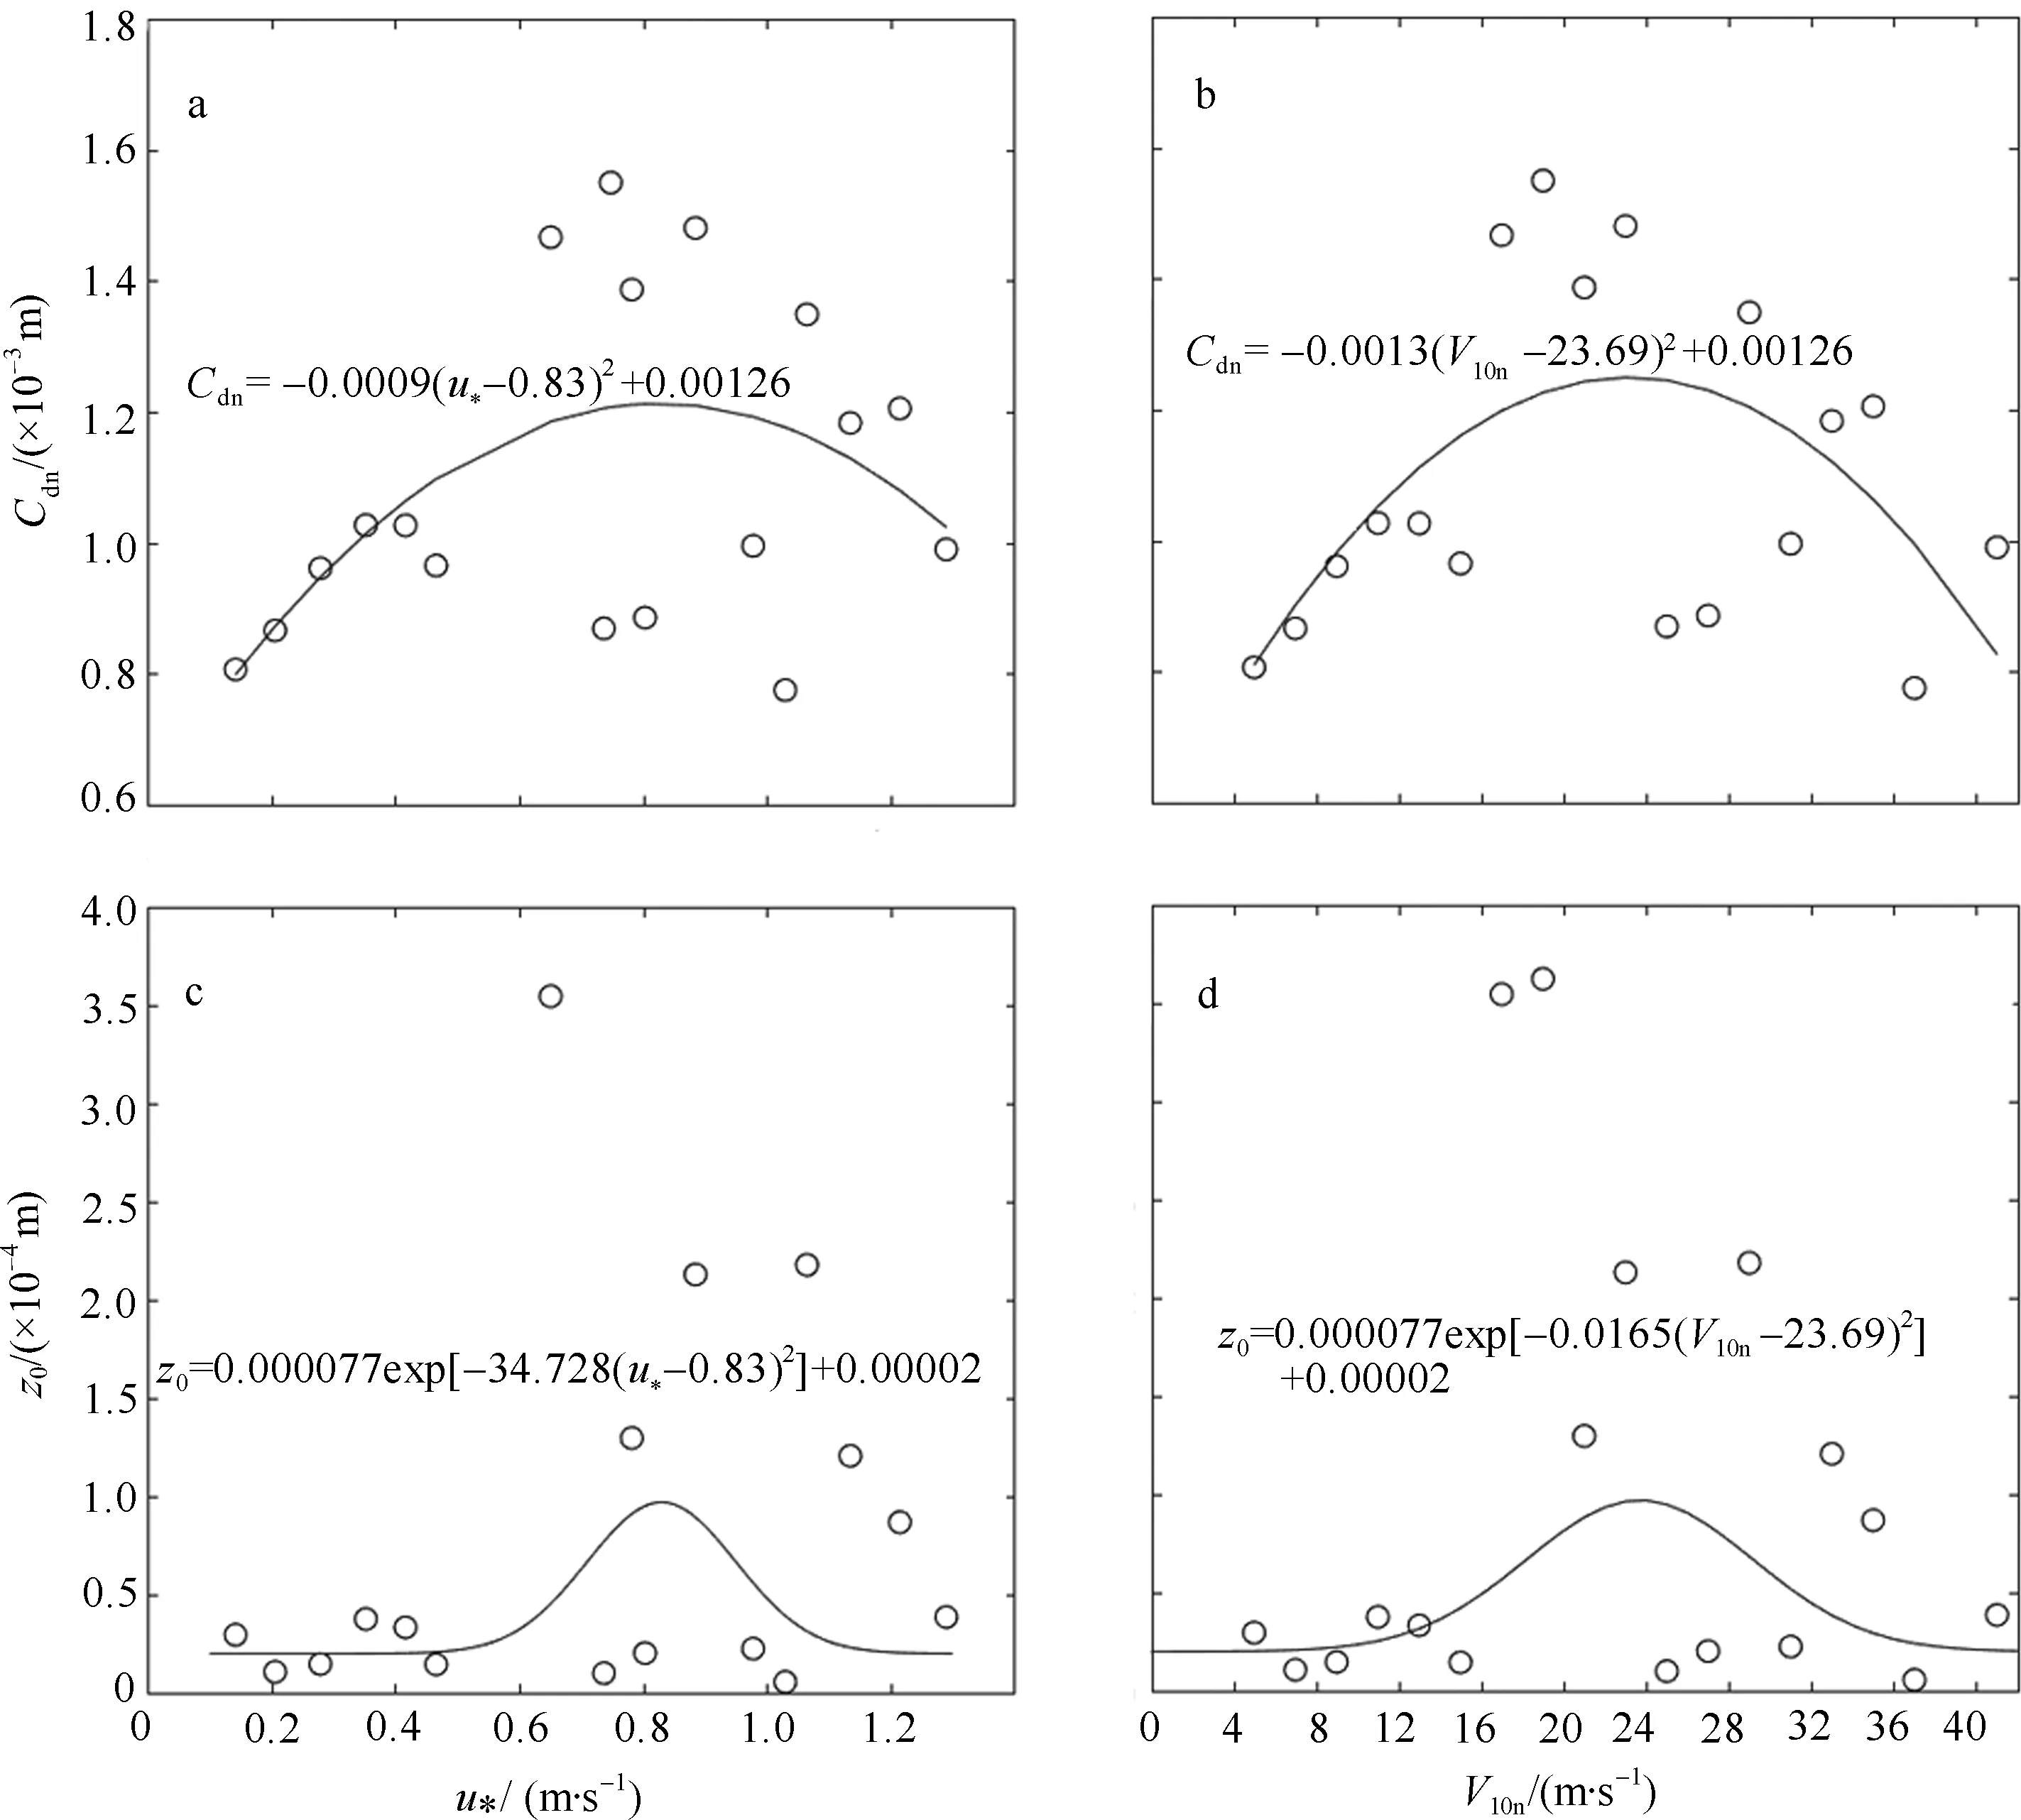
Fig. 5 Relationships between neutral drag coefficient (Cdn) and friction velocity (u*) (a), relationships between neutral drag coefficient (Cdn) and V10n (b), relationships between aerodynamic roughness length (z0) and friction velocity (u*) (c), relationships between aerodynamic roughness length (z0) and neutral 10-m wind speed (V10n) (d), and, the data used are from Fig. 4 regression results are included

It is obvious that the saturated u*is 0.83 m·s–1and the saturated V10nis 23.69 m·s–1.
Previous studies (e.g., Yelland et al, 1996; Oost et al, 2002, 2004; Gao et al, 2006, 2012) showed that z0and Cdndepend not only on u*and V10n, but also on wave state. Our current study does not consider wave parameters (i.e., wave height or wave steepness, and wave period or wave age), which should be another reason why the data distribution in Fig. 5 appears to be scattered. Because of this, if we use the field observation data to verify the ability of our statistical Equations (4, 5) and (7, 8) to simulate the roughness and drag coefficient, these equations may have large errors. The advantage of Equations (4, 5) and (7, 8) is that they are capable of simulating roughness and drag coefficients under high wind conditions, which is useful for the atmospheric models that do not include any wave parameters.
3 Summary
Turbulent data were collected by an eddy variance system installed on a 100-m tower off the costal South China Sea during typhoons Hagupit and Chanthu. Using these date, we derived the parabolic relationship between drag coefficient and friction velocity, and between drag coefficient and 10-m wind speed; we also obtained the exponential relationship between aerodynamic roughness and friction velocity, and between aerodynamic roughness and 10-m wind speed. We found that the critical 10-m wind speed is 23.69 m·s–1and the critical friction velocity is 0.83 m·s–1.
