
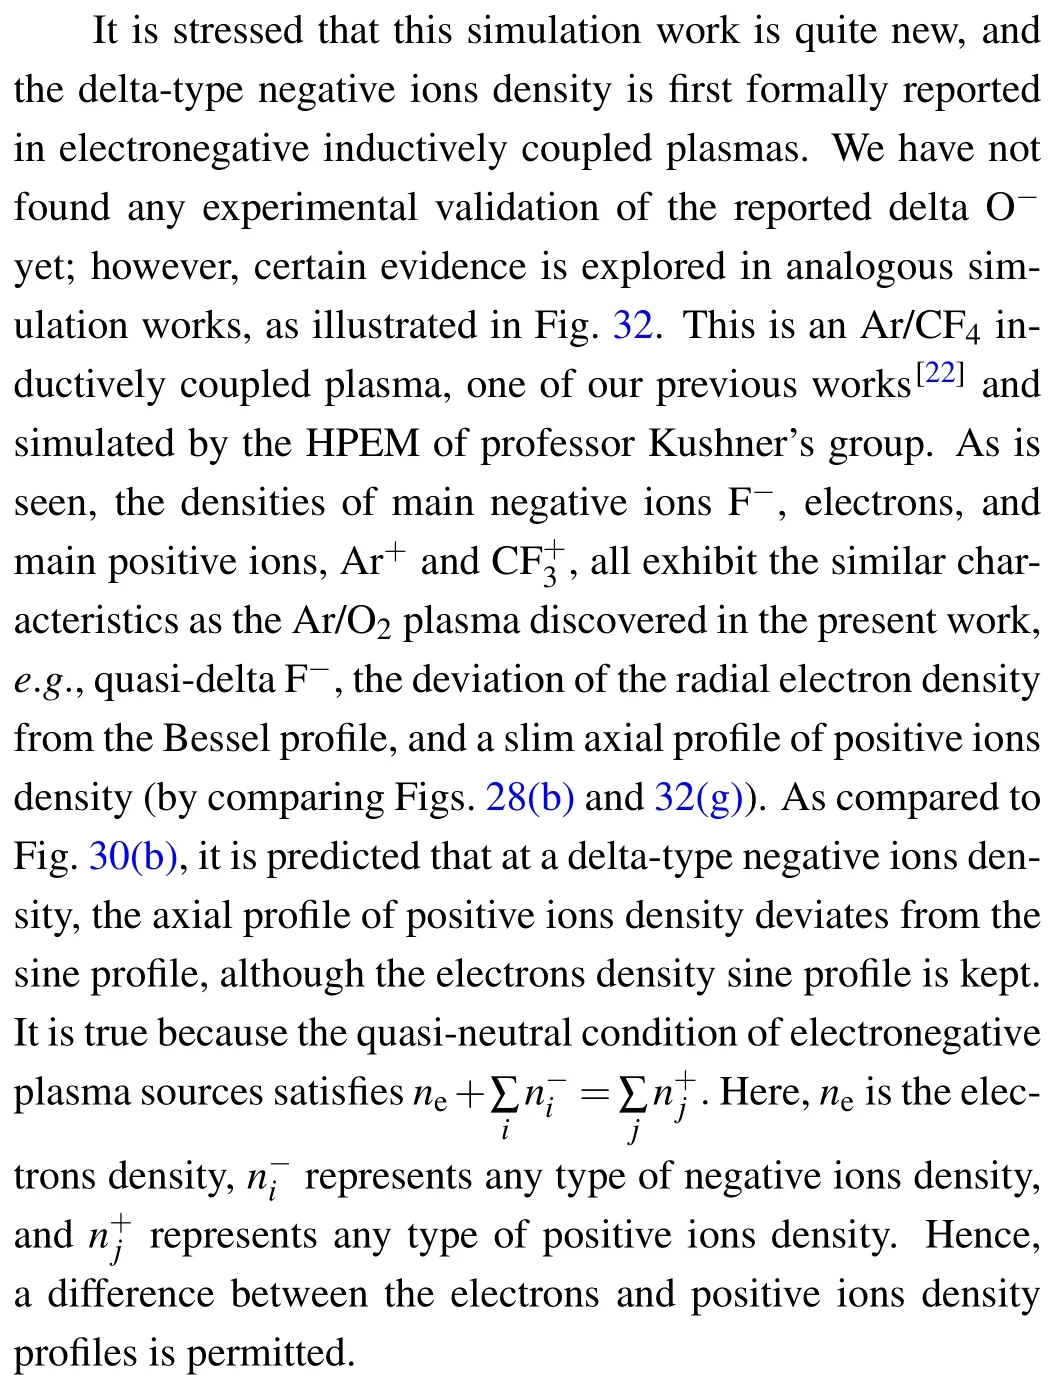
Quasi-delta negative ions density of Ar/O2 inductively coupled plasma at very low electronegativity
2021-05-24 02:23ShuXiaZhao赵书霞
Chinese Physics B 2021年5期
Shu-Xia Zhao(赵书霞)
Key Laboratory of Material Modification by Laser,Ion,and Electron Beams(Ministry of Education),School of Physics,Dalian University of Technology,Dalian 116024,China
Keywords: inductively coupled plasma,Ar/O2 discharge,very low electronegativity,delta distribution of anions
1. Introduction
The Ar/O2inductively coupled plasmas are very important electronegative plasma source in industry, such as chamber cleaning and photoresist striping techniques. The dynamic behavior of this plasma source has been widely investigated.For instance,in Ref.[1],the instability,i.e.,plasma parameters oscillating at kHz frequency range, was reported in this relatively weak electronegative plasma and the mechanism for oscillation occurrence was analyzed by means of global model.In Ref.[2],the E–H mode transition in the Ar/O2inductively coupled plasma was studied by using the Langmuir probe and optical emission spectroscopy. The transition threshold,electron energy distribution function, and O2dissociation at the mode transition were specified. In Ref. [3], the discharge kinetics of oxygen inductively coupled plasma was studied. By using Langmuir probes and laser-assisted photodetachment,it was discovered that the main negative ions loss is dominated by ion–ion recombination and electron detachment at low pressure,while it is dominated by detachment processes with the metastable and grounded oxygen molecules at high pressures. In Ref.[4],the charged species dynamics were reported by means of electrostatic probes. The scaling features,transition of operating region,and the radial distribution of charged species were specially discussed. In Ref. [5], by means of quadrupole mass spectrometer and fluid model,the neutrals kinetics were studied. They found the importance of the balance between gas phase O2dissociation and surface O recombination in controlling plasma characteristics,as well as the diffusive transport in determining the neutral density profiles. Still,they analyzed the respective role of different metastable oxygen atomic and molecular species in dissociation, ionization and attachment kinetics. In Ref. [6], the electronegativity of low-pressure high-density oxygen discharges was investigated by using global model. They found that the negative oxygen ion O−to be the dominated negative ion in the discharge,the density of the negative ion O−2to be small and the density of the negative ions O−3to be negligible in the pressure of interest, 1 mTorr–100 mTorr (1 Torr=1.33322×10²Pa). The respective creation and loss of these anions at different pressures were given.
Besides the above studies of concrete Ar/O2discharges,lots of analytic works are concentrated on the spatial characteristics of general negative plasma sources,e.g.,bulk plasma structure that consists of electronegative core and electropositive edge,[7]internal sheath,[8]spatial oscillation,[9]double layer,[10]and negative ions front,[11]etc.In this paper,a novel delta negative ions density is discovered for the first time from the fluid simulations in Ar/O2inductively coupled plasma at very low electronegativity. The forming mechanism of this delta is investigated by means of the mathematics and the preliminary physics behind is revealed,which is hoped to predict new experimental phenomenon.This work,taken as an important supplement to the morphology of negative plasma source at low electronegativities,is hence meaningful for researchers to understand the electronegative plasma sources.
2. Fluid model
The Ar/O2inductively coupled plasma simulated by the fluid model is operated in the pure inductive mode.The reactor used consists of the vacuum chamber(also called as matching box) and the discharge chamber, which are separated by the dielectric window. The discharge chamber is 15 cm in radius and 13 cm in height. The heights of dielectric window and vacuum box are 1 cm and 3 cm, respectively, at a relatively small radius, 14 cm. A substrate with the radius of 12 cm and the height of 4 cm is seated at the bottom center of the discharge chamber. A two-turn coil is installed above the dielectric window,with the radial locations of 8 cm and 10 cm,respectively. The coil is square in cross section,with the sidelength of 0.6 cm.
The fluid model used consists of the electron, heavy species (i.e., ions and neutrals), electromagnetic equations,and the Poisson’s equation. The species equations describe their mass,momentum,and energy transports,at the approximations of cold ions(i.e.,at the room temperature)and driftdiffusion ions momentum (pure diffusion for neutrals). The Poisson’s equation describes the electrostatic fields arising from the ambi-polar diffusion and in the sheaths of chamber border. The electromagnetic equation calculates the coil field of skin layer. The fluid model,i.e.,the partial differential equations, is numerically solved with the method of element.More details about the fluid model and numeric technique can be found in Ref.[12].
The chemistry selected for this Ar/O2plasma consists of gas phase reactions among electron,ions,and neutrals,and the surface kinetics of reactive species. The electron-impact reactions include elastic,excitation,ionization,dissociation,attachment,and de-attachment,etc.The heavy species reactions include quenching,recombination,associative de-attachment,and charge exchange, etc. At the condition of present Ar/O2inductive discharge,i.e.,300 W,30 mTorr,and 9:1 Ar/O2gas ratio, O−is the main negative ion and it is mainly generated by the dissociate attachment of electrons and grounded O2,and lost by the recombination between O−and Ar+. The loss of O−via detachments caused by colliding with metastable O2is insignificant due to the lack of metastables at such high Ar/O2gases ratio. This is in qualitative agreement with the work of Refs.[6,13]. It is noticed that the heavy negative ions,O−2,etc.,are not present in this gas phase chemistry of Ar/O2plasma because of the low-pressure property of inductively coupled plasma sources. The heavy anions O−2arise from electron-impact dissociative attachment of ozone molecules,which are mainly formed at three-body associations that are usually important in atmospheric discharges.[14]Besides, In Ref. [6], in low-pressure high-density discharges, like the inductive plasmas, the ozone is mainly created by the detachment of O−with the metastable oxygen molecules when the three-body interaction is excluded. But the predicted O−2density is still quite low, as compared with O−. Moreover, in Ref.[15],where the negative ions density was measured by using probe-assisted laser photon-detachment in inductive oxygen discharges,only the O−signal is detected,but not the O−2.In conclusion, the heavy oxygen anions, which are probably not negligible at capacitive discharges[16,17]or high-pressure discharges,are less important in the low-pressure high-density inductive discharges. That is why most of inductively coupled oxygen-contained plasma simulations used simplified chemistry that only considers the O−kinetics.[1,3,5,18]In addition,at such a low O2concentration selected in this work,the main positive ions component is the argon ions,Ar+,while not the O+2or O+species. It is noted that the three positive ions are all considered in simulations, regarding the completeness of chemistry. In a word, the Ar/O2plasma chemical kinetics is characterized by the theme of this article,i.e.,low-pressure inductive plasmas at small electronegativity. For demonstrating better the whole chemistry and O−kinetics and saving the paper space as well,a supplementary material is provided[19]for readers.
3. Results and discussion
3.1. Occasional observation of delta-type negative ions density with the feature of negative source term
A“comet”type of negative ions O−density was discovered occasionally in our previous simulation works, which is shown in Fig. 1(c). This novel density profile of plasma species provokes our profound interest, as it had never been reported before. As shown in the figure,the comet O−density looks like a Dirac-delta function,especially at the axial direction. To investigate the behind mechanism, we checked the relevant quantities, such as electron density, argon ions Ar+density,plasma potential(illustrated in Fig.1)and its chemical process, i.e., the reaction rates of O−generation and loss, as well as the summed rate,as shown in Fig.2. One very important feature was noticed,i.e.,the O−species holds an obvious negative source term in the position of delta. In the mature analytic works,[20]the species density morphology of electropositive plasmas,such as parabola,cosine,and Bessel profiles at high pressure limit,the variable mobility model of intermediate pressure range,and the Langmuir solution at low pressure limit,are all based on the continuity equation of species with positive source term. This is logic, since in the electropositive plasmas,the species are mainly lost on chamber wall via the surface kinetics. In electronegative plasmas, this is not always true, and at certain circumstance the negative source of negative ions (i.e., recombination and detachment) possibly exceeds the positive source (i.e., electron impact dissociative attachments)at low electronegativities,as illustrated in Fig. 2. The up-to-date works of electronegative plasma morphology are mainly focused on the parabolic approximation at low pressures and the flat-topped model at high pressures,as well as the ion sound speed limitation where instabilities(i.e., double layer and oscillations) appear, all based on the conditions of high or at least moderate electronegativities.[20]The negative source was either neglected as in the parabola model, or dominated over by positive source as in the flattopped model. Hence, it is not strange at all that the delta density profile has not been observed all the time, since the opposite case,i.e.,negative source term,has not been paid attention to,up to now.
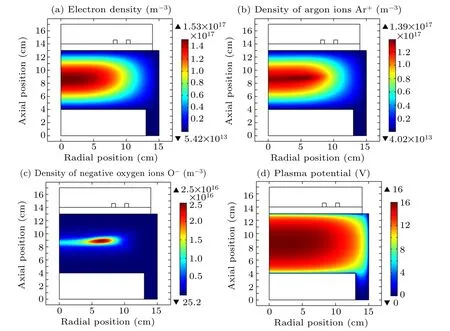
Fig.1. The electrons density(a),the densities of argon ions Ar+ (b),negative oxygen ions O−(c),and plasma potential(d),simulated at the discharge conditions of 30 mTorr and 300 W,and 9:1 Ar/O2 gases ratio.
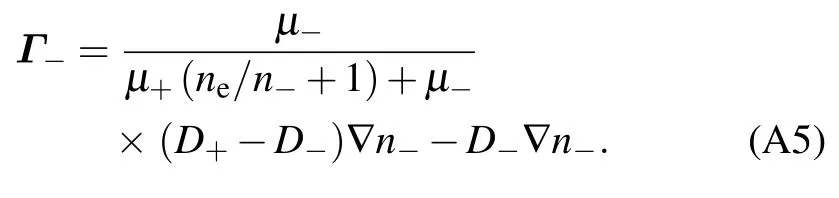
Now,we attempt to explain the delta O−density with the continuity equation at extreme condition,i.e.,purely negative source term (a reasonable approximation of O−source term in Fig.2(b)). The quasi-ambi-polar diffusion of three-species system, analogous to the two-species system, is analyzed at first. The detailed process can be found in Appendix A. The formula, we cared here, is the flux of negative ions, with its drift term replaced by a novel diffusion term, as shown in Eq.(1),where the density ratio of electrons and negative ions appears.

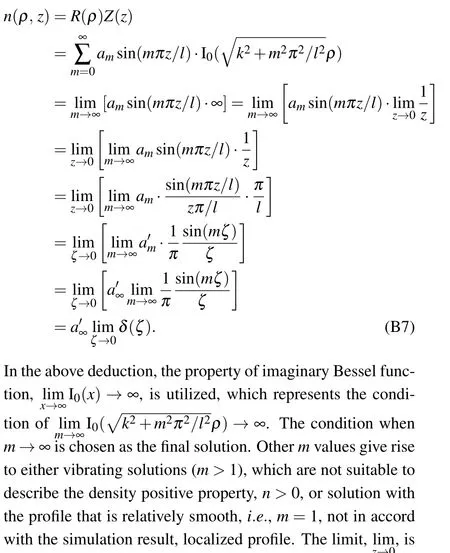
As shown in Fig.1, the electron density is relatively uniform throughout the reactor, and the O−density is localized about at the center of the intersecting surface simulated. Hence, in the whole space except for that location of O−delta,the density ratio tends to be infinite, the novel diffusion attenuates,and the free diffusion dominates. At the delta location, the plasma potential is quite uniform,thereby the drift of negative ions caused by ambi-polar diffusion is insignificant, wherein equation(1)is not suitable due to the lack of electric field. In total, at this special circumstance, the influence of drift term can be neglected and the flow of O−is free diffusion. Note that this is a conclusion for the steady state when O−delta is already formed and in the case of pure negative source. This conclusion needs to be amended and supplemented when the temporal evolution and small positive source are considered;see Subsection 3.2. We next analyze the steady state O−density profile with the continuity equation shown in Eq.(2)that consists of pure diffusive and negative source term. This version of continuity equation is a Helmholtz equation and can be solved by the method of separation of variables. The detailed deduction can be found in Appendix B.It is rather surprising to find out that the final solution of this equation is a spatially independent delta function. These mathematic answers interpret well the simulated delta-type O−density,at least qualitatively.
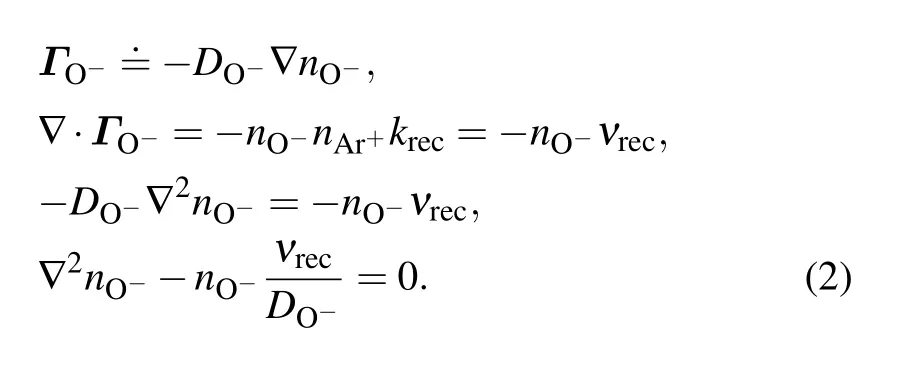
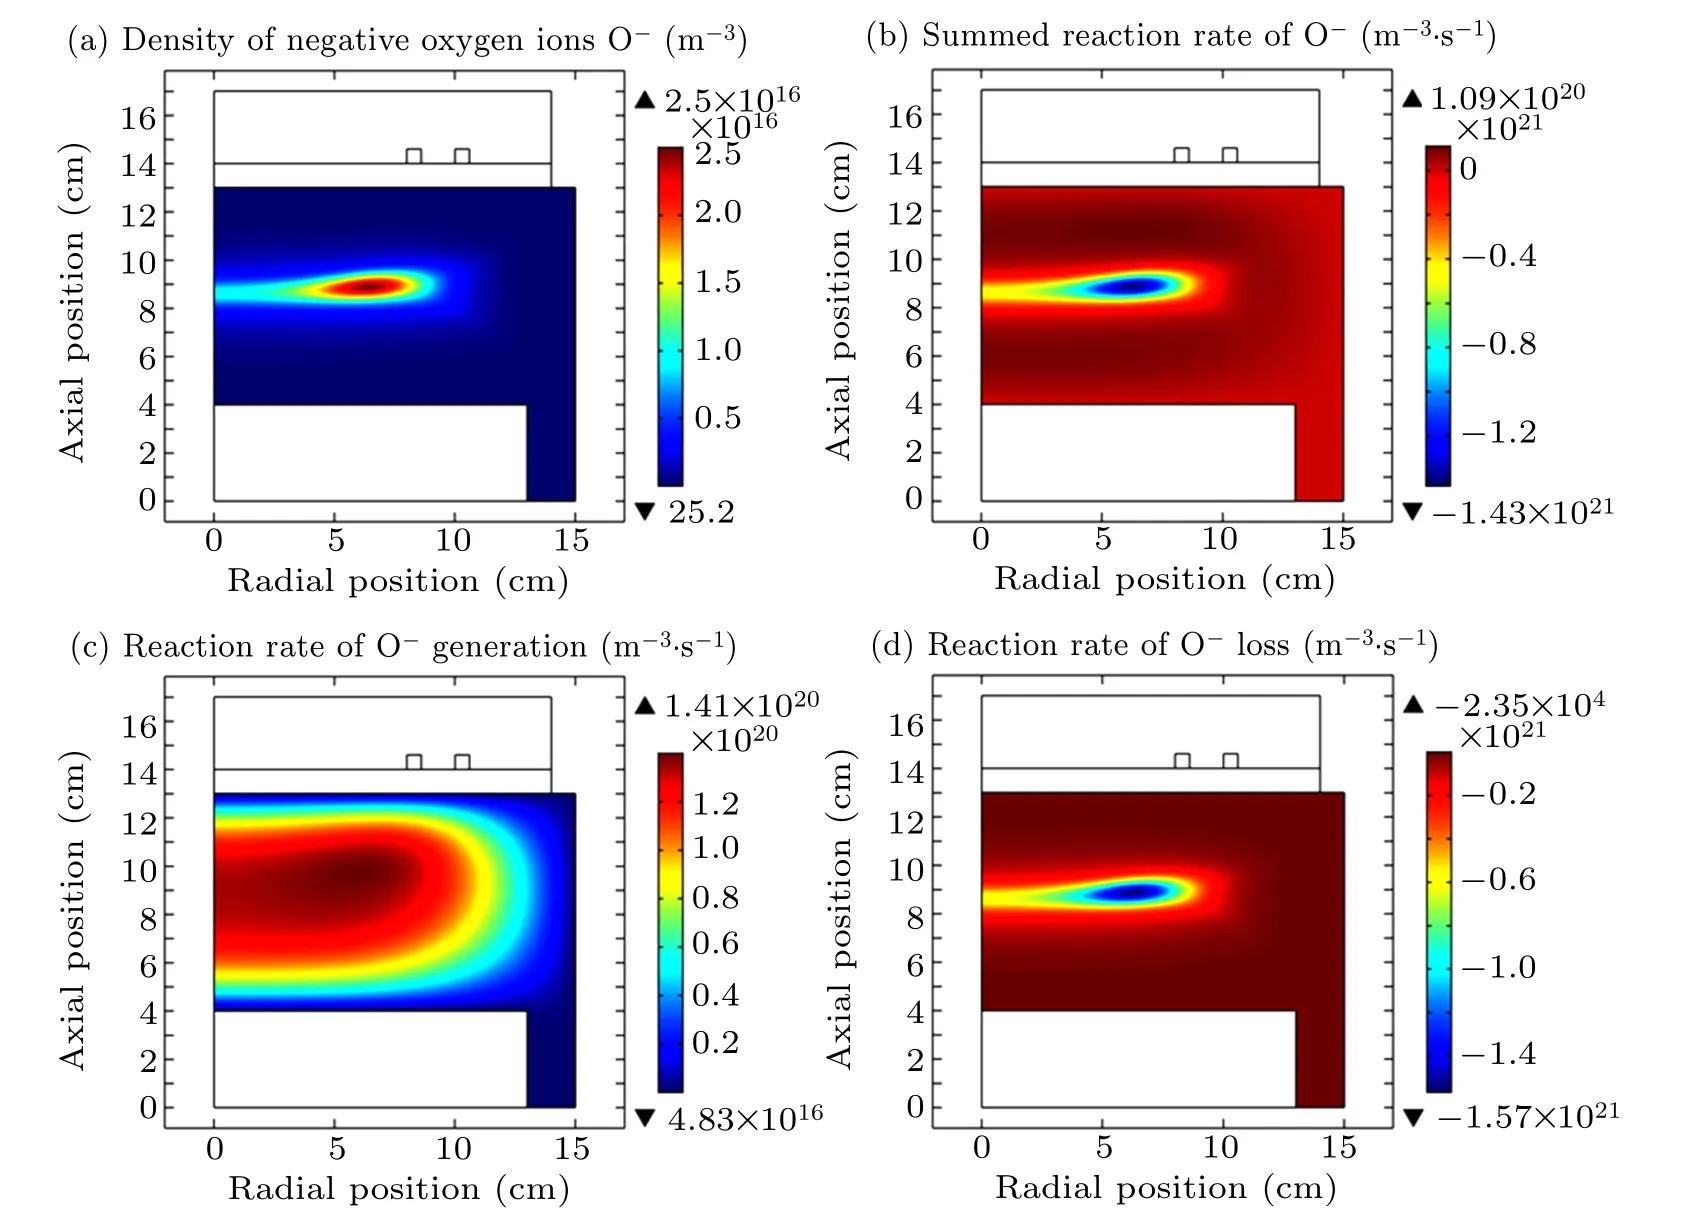
Fig.2.The density of negative oxygen ions O−(a),the summed reaction rate of O−(b),the reaction rates of O−generation(c),and loss(d),respectively.The concrete reactions relating to the O−generation and loss,and the whole chemistry selected for the Ar/O2 plasma,can be found in the supplementary material.[19] As seen from Ref. [14], the main reaction that creates O−species is the electron impact dissociative attachment, and the main reaction that consumes O−species is the recombination between O−species themselves and the positive argon ions(Ar+). The recombination rate constant is large and the Ar+ ions density is high due to the high Ar/O2 ratio of feedstock gases,which contribute to high recombination loss of O−species. The discharge conditions are the same as those in Fig.1.
3.2. Linear decomposition of the continuity equation of negative ions and their collaboration
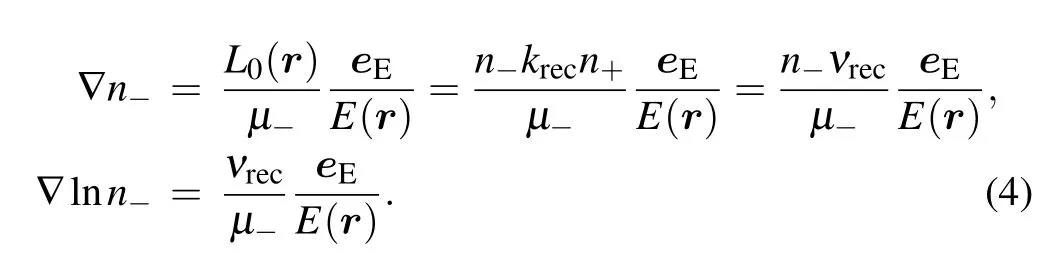
Apparently,the delta solution given in Subsection 3.1 that attempts to explain the O−delta is a mathematic and steady state solution. To understand better the delta, the relevant physics behind and transient behavior still need to be clarified.We therefore start to think about the small positive source term and the Boltzmann relation of O−. We presume that if strong enough positive source exists and the outward free diffusion of flux can counteract the inward drift component,i.e.,the Boltzmann relation is satisfied, the negative ions density ought to be able to hold the basic profile appearance as the electron density. While at the small positive source,when the drift defeats free diffusion and the flux is drift-dominated, which is oriented to the bulk plasma center, the negative ions density perhaps collapses,giving analogous spatially-localized distribution to some extent. Recognizing this possible process,we re-consider the continuity equation of O−and leave the drift flux and positive source this time. Note that this is distinct to the Subsection 3.1,where a steady state is dealt with. Herein,the temporal evolution is considered more. This is not logically contradicted. Besides, questions may be provoked as we analyzed the temporal evolution of O−density with the steady state continuity equation component that consists of drift flux and positive source term (where the time derivative of O−density is omitted). This is not incorrect, as we believe that the temporal behavior is made of many quasi-steady sub-processes. By analytically solving the equation (see Appendix C for details),we obtain a formula like
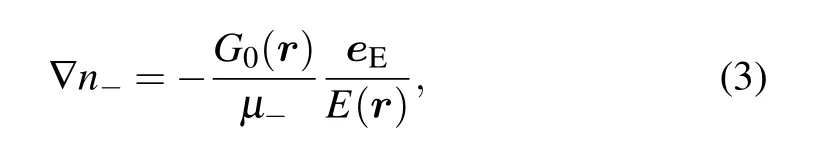
where G0(r) is the reaction rate for O−creation, E(r) is the electrostatic field magnitude,eEis the unit vector of field,andµ−is the mobility constant. It is seen the O−density gradient is reciprocal to the field. This validates the above scientific guess,as the field is well known to be strong near the chamber border.At the positive source term and pure drift transport,the O−profile ought to be relatively smooth and condense profile(as predicted in Ref. [21]), not a sharp delta. From the analytic theory, a delta ambi-polar potential is never needed for plasma evolving to steady state. As seen,this primary stage is quite important, for it provides necessary conditions for creating O−delta, like free diffusion (O−species are collected into the potential barrel bottom, so the electric field is weak)and high enough O−density (producing negative source). In conclusion,these two steps are successive and collaborative.
In view of mathematics,the linear decomposition of continuity equation is arbitrary,i.e.,there are naturally two combinations of flux and source. Why the combination of drift plus with negative source, and free diffusion plus with positive source,is not selected for the O−delta?We reform Eq.(3)with negative source and get
Here, L0(r) is the loss rate of O−, a function of O−density.Different from Eq. (3), the gradient of O−density logarithm is now reciprocal to field. Mathematically, this will severely attenuate the dependence of O−density on field,which is not benefitial for the creation of O−delta. Besides,it is seen from Eq. (4) that the directions of O−density logarithm gradient and the field vector are now the same, different from Eq.(3).The electrostatic field and density gradient both direct outward(at ambi-polar diffusion). This means that negative ions are scattered,not accumulated,which is not helpful for delta formation. In addition, as shown below in Eq. (5), the free diffusion with the positive source that is independent of the O−density is a Poisson-type equation,not the Helmholtz-type one as shown in Eq.(2)(which predicts O−delta).

In a word,the second combination of continuity equation components is not suitable for describing the O−delta.
3.3. The temporal evolution of O−species and the influence of O−delta on plasma transport
The evolution of O−species with time is in total divided into four stages,i.e.,drift at insufficient creation source(when O−species are assembled), special diffusion with negative source (when prototype O−delta is formed), and the delta walk and refinement. The main mechanisms of drift and diffusion have been illustrated in Subsection 3.2, and more details can be found herein. The walk and refinement are new phenomena of delta. Besides,the appearance of negative ions delta in the bulk plasma will influence the plasma transport,giving rise to novel transport phenomena,such as the freezing and restart of ambi-polar diffusion and so on.
3.3.1. Drift-dominated transport of negative ions with positive source term
In the temporal evolution, the O−transport is first controlled by the drift and small positive source term,as predicted by Eq. (3). The mechanism is already clear, i.e., due to the small positive source,the O−density diffusion could not counteract the strong drift flux,and thereby the O−density profile is gradually suppressed to the chamber center, as shown in Fig.3. We see that,on increasing the simulation time,the O−positive source region of the coil field is expelled out of the O−density profile,which implies the offset of different transport schemes. For illustrating the accumulation of plasma potential on O−species,we plot in Fig.4 the potential contours of the four selected time points at this stage.
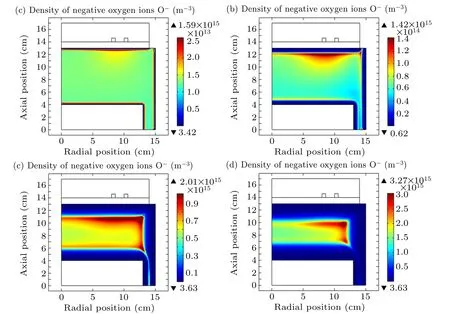
Fig.3. The evolution of O−density with time when the drift assembles O−species into the bulk. Selected O−density profiles at(a)1.0×10⁻⁷ s,(b)1.0×10⁻⁶ s,(c)5.109×10⁻⁶ s,and(d)1.0×10⁻⁵ s. The discharge conditions are the same as those in Fig.1.

Fig. 4. The evolution of plasma potential contour with time when the drift assembles O−species into the bulk. Selected plasma potential contour profiles at(a)1.0×10⁻⁷ s,(b)1.0×10⁻⁶ s,(c)5.109×10⁻⁶ s,and(d)1.0×10⁻⁵ s. The marked values are the maxima of the potential contours. The discharge conditions are the same as those in Fig.1.

Fig.5. The electrons temperature profiles at(a)1.0×10⁻⁷ s, (b)1.0×10⁻⁶ s, (c)5.109×10⁻⁶ s, and(d)1.0×10⁻⁵ s, respectively. The electrons density profiles at(e)1.0×10⁻⁷ s,(f)1.0×10⁻⁶ s,(g)5.109×10⁻⁶ s,and(h)1.0×10⁻⁵ s,respectively. The discharge conditions are the same as those in Fig.1.
As the time is increased, the smooth potential barrel is constructed gradually and the marked potential maximum is increased (also refer to Fig. 6(b), where the potential versus time is plotted). In Fig.5,the electrons temperature and density profiles at the four times are plotted. As is seen, most of the potential contours correspond to the electron density profiles,determined by ambi-polar diffusion,except for the early time of 1.0×10⁻⁷s. The difference between potential and electron density at the initial time is caused by the influence of electron temperature on the ambi-polar diffusion process.

In Eq.(6), the formula of ambi-polar diffusion coefficient Dais described, where Diis the positive ions diffusion coefficient, Teand Tiare the electrons and ions temperatures, respectively. The influence of electrons temperature on potential becomes insignificant at large times, because the sheath and pre-sheath at borders are gradually established,which are more determined by the electron density gradient.In Fig.6(a),the gap between the electrons density maxima and minima is increased with time, corresponding to the growth of plasma potential in Fig. 6(b). In Fig. 7, the argon ions Ar+densities of the four times are plotted. The evolving trends of Ar+and electrons density profiles with time are the same, both quite different with the O−density. It means the ambi-polar diffusion at this stage is caused by the positive ions and electrons.In addition,the O−species transport faster than the electrons and Ar+ions, because the ambi-polar process is balanced by diffusion and drift, while O−is purely drift-driven. Still, the O−density profile at this stage is rectangular at the push of potential,different from the work of Ref.[21](relatively smooth and condense profile), because the potential push is stronger here than that in Ref.[21].

Fig.6. Electron density maxima and minima(a)and plasma potential peak(b)versus simulating time. The discharge conditions are the same as those in Fig.1.
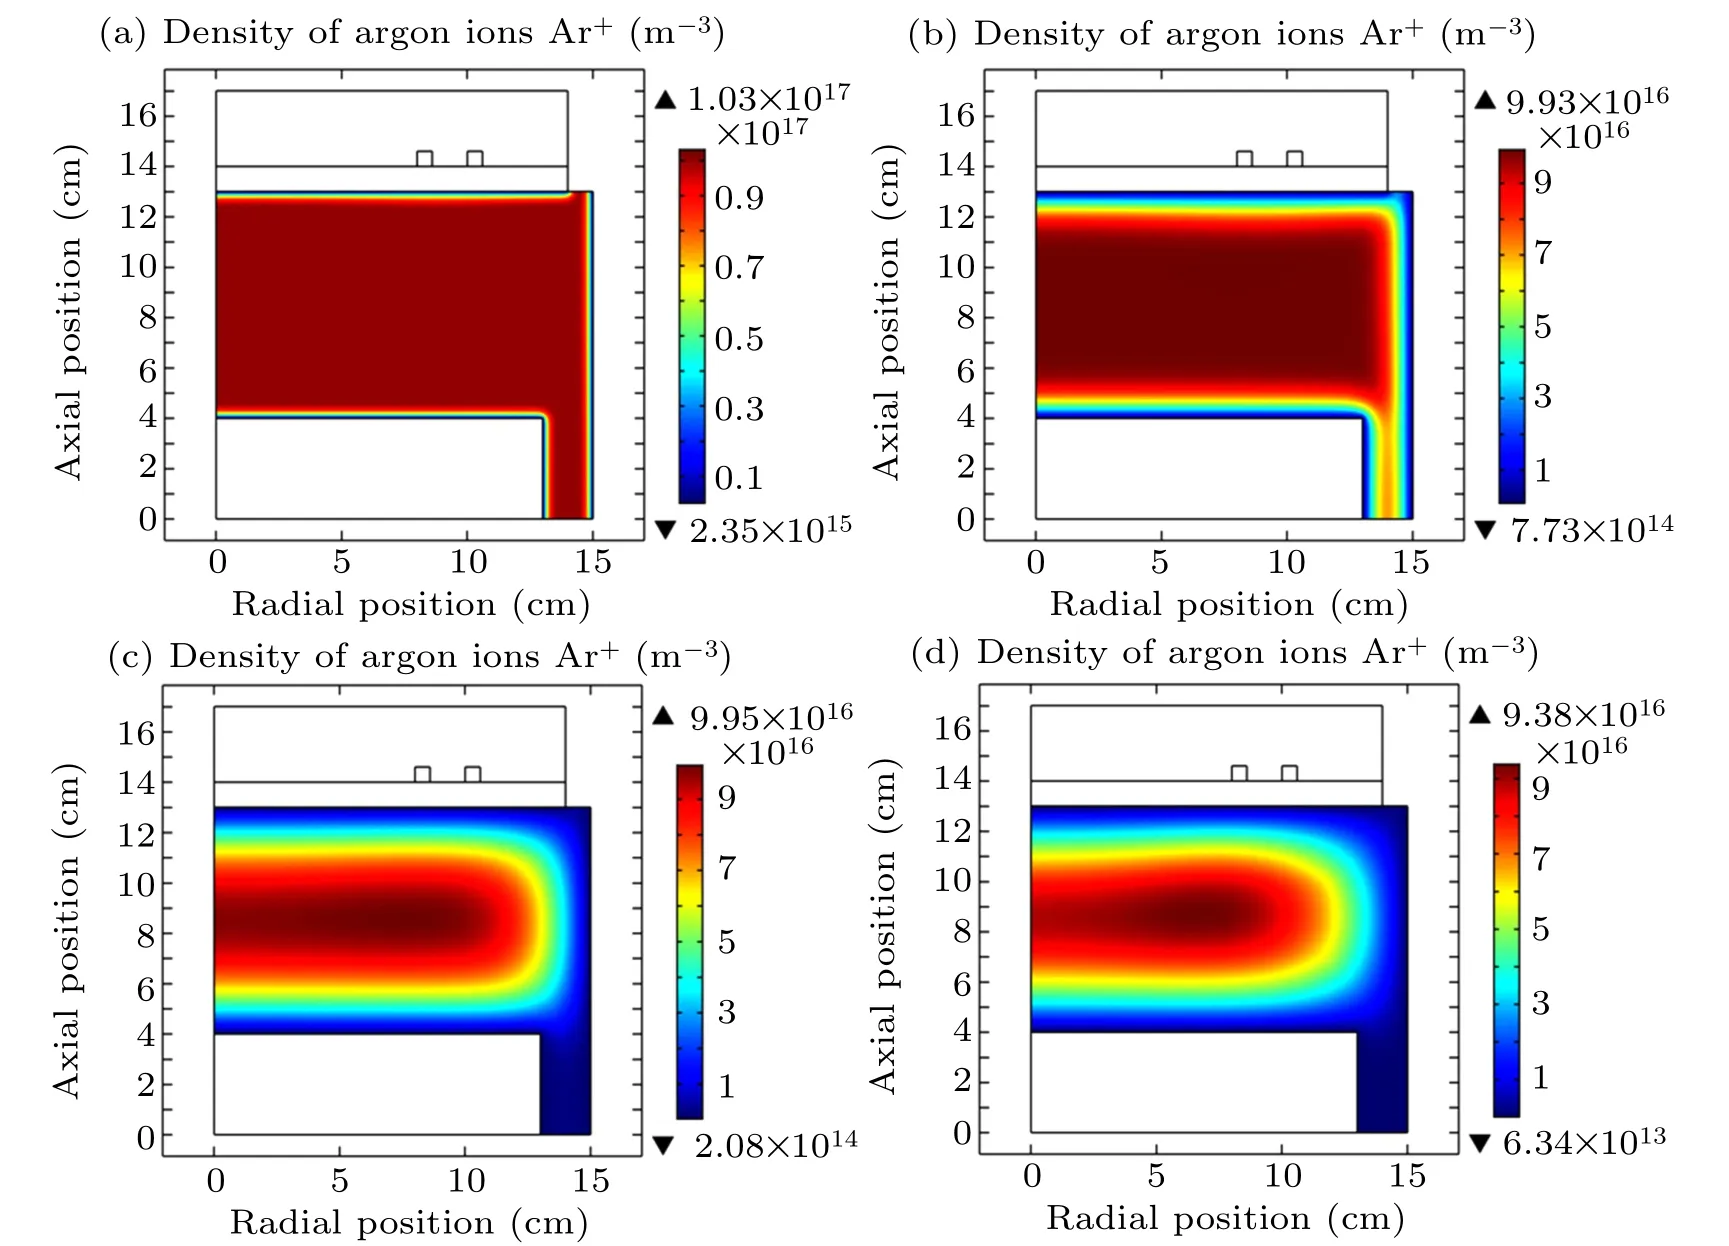
Fig.7. The evolution of argon ions Ar+density profile with time when the drift assembles O−species into the bulk. Selected Ar+density profiles at(a)1.0×10⁻⁷ s,(b)1.0×10⁻⁶ s,(c)5.109×10⁻⁶ s,and(d)1.0×10⁻⁵ s. The discharge conditions are the same as those in Fig.1.
3.3.2. Diffusion-dominated transport of negative ions with negative source term
In Figs. 8–10, we sequentially plot the O−density, O−source term, and potential at a newly selected time set, i.e., (a)1.0×10⁻⁵s,(b)1.778×10⁻⁵s,(c)2.371×10⁻⁵s,and(d)3.162×10⁻⁵s. During the new time range,a prototype O−delta is formed in Fig.8 and the source term of O−species becomes negative in Fig.9. The potential contour hardly changes and the value keeps increasing,as shown in Fig.10.
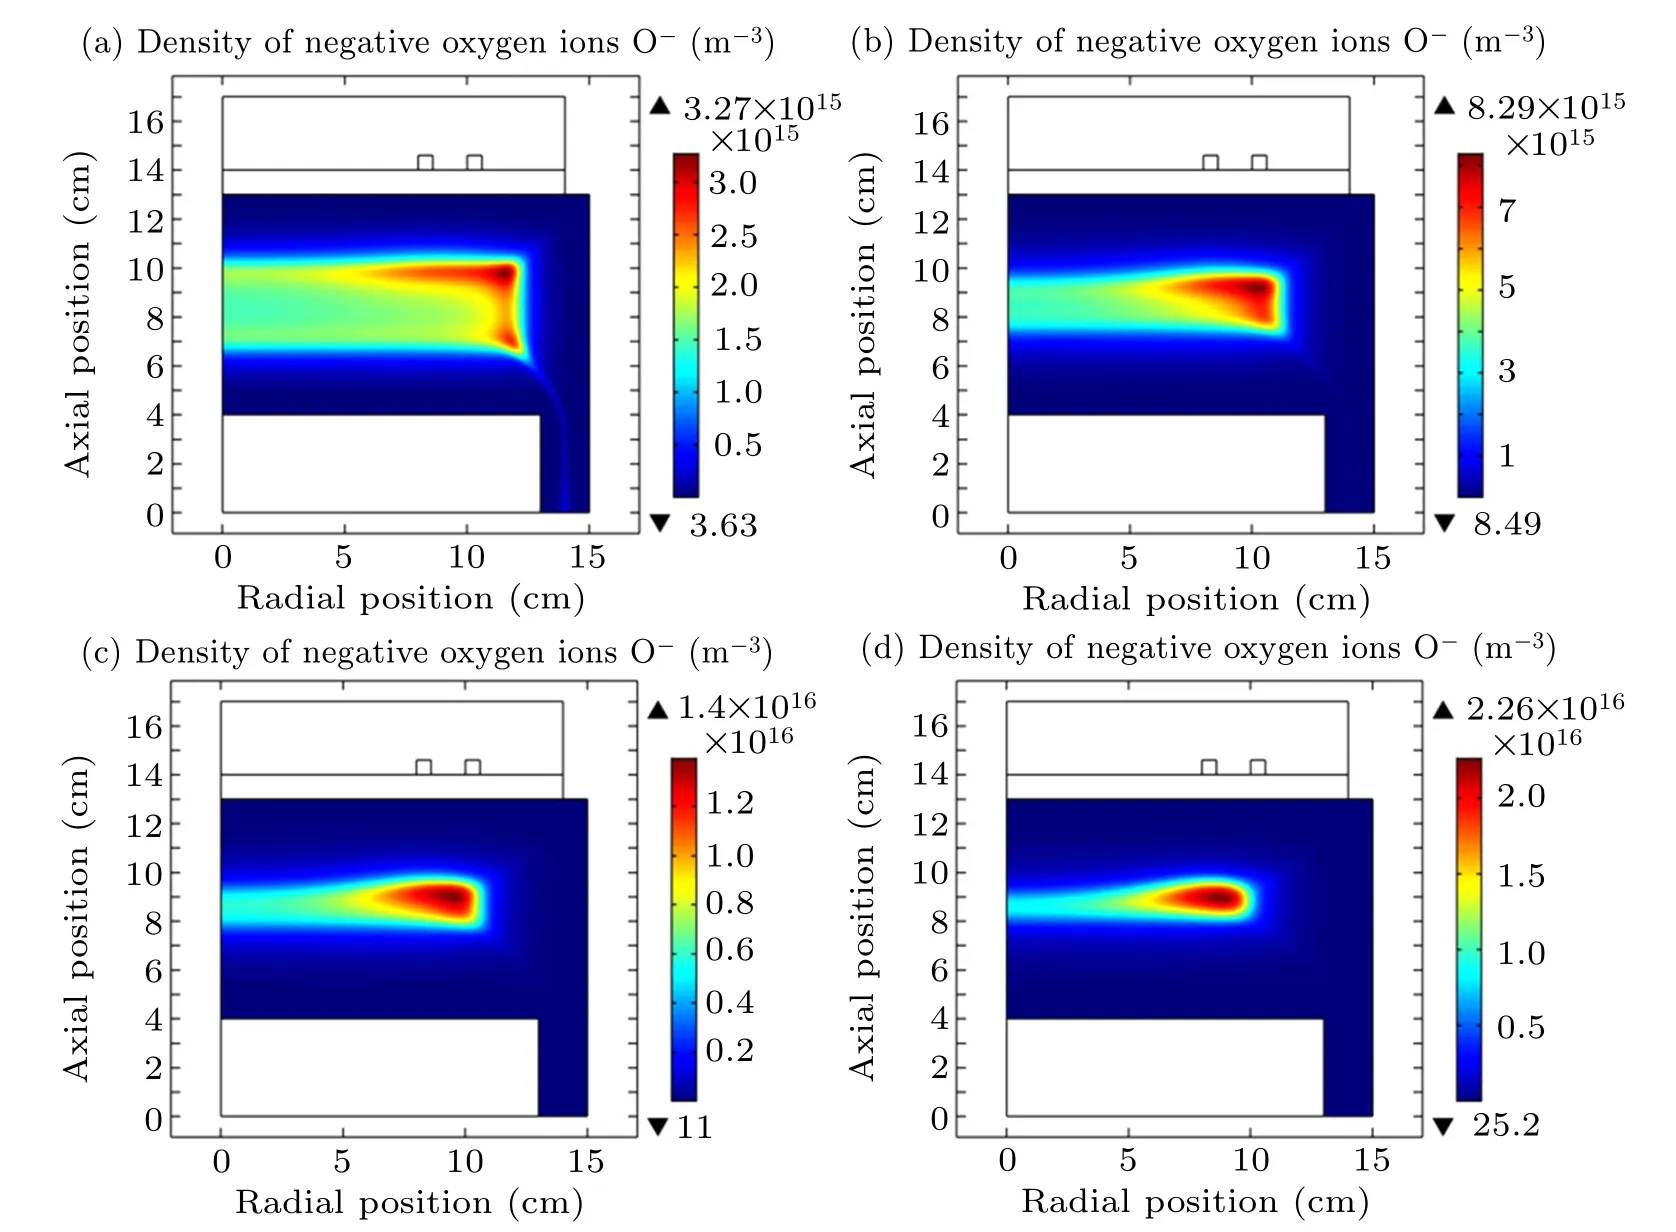
Fig.8.The evolution of O−density with time when the prototype O−delta is formed.Selected O−density profiles at(a)1.0×10⁻⁵ s,(b)1.778×10⁻⁵ s,(c)2.371×10⁻⁵ s,and(d)3.162×10⁻⁵ s. The discharge conditions are the same as those in Fig.1.

Fig.9. The evolution of O−net source term,i.e.,the summed reaction rate,with time when the negative source term of O−is formed. Selected O−net source profiles at(a)1.0×10⁻⁵ s,(b)1.778×10⁻⁵ s,(c)2.371×10⁻⁵ s,and(d)3.162×10⁻⁵ s. The discharge conditions are the same as those in Fig.1.

Fig. 10. The evolution of plasma potential contour with time when the prototype O−delta is formed. Selected plasma potential contours at (a)1.0×10⁻⁵ s,(b)1.778×10⁻⁵ s,(c)2.371×10⁻⁵ s,and(d)3.162×10⁻⁵ s.The discharge conditions are the same as those in Fig.1.

Fig. 11. The transverse comparison of O−density profile (a) and plasma potential contour (b) at 1.778×10⁻⁵ s. The discharge conditions are the same as those in Fig.1.
Fig. 12. The transverse comparison of O−density profile (a) and plasma potential contour (b) at 3.162×10⁻⁵ s. The discharge conditions are the same as those in Fig.1.
In Fig.11, we transversely compare the O−density profile and potential contour at the time of 1.778×10⁻⁵s. Axially,the O−density profile is located within the potential bottom, indicated by the two horizontal red dashed lines. This implies that the drift is finished and pure diffusion begins, at the axial direction, at least temporally (see further details in Subsubsection 3.3.4, where the axial drift rebegins). Correspondingly, a negative source term is formed (see Fig. 9(b)),originated from a high O−density created by the axial and radial drifting transport.

Fig.13. The longitudinal comparison of O−density profile(a)and plasma potential contour (b) at 1.778×10⁻⁵ s. The discharge conditions are the same as those in Fig.1.

Fig.14. The longitudinal comparison of O−density profile(a)and plasma potential contour (b) at 3.162×10⁻⁵ s. The discharge conditions are the same as those in Fig.1.

Fig.15.The evolution of electrons density profile with time when the prototype O−delta is formed.Selected electrons density profiles at(a)1.0×10⁻⁵ s,(b)1.778×10⁻⁵ s,(c)2.371×10⁻⁵ s,and(d)3.162×10⁻⁵ s. The discharge conditions are the same as those in Fig.1.

Fig. 16. The evolution of argon ions Ar+ density profile with time when the prototype O−delta is formed. Selected Ar+ density profiles at (a)1.0×10⁻⁵ s,(b)1.778×10⁻⁵ s,(c)2.371×10⁻⁵ s,and(d)3.162×10⁻⁵ s. The discharge conditions are the same as those in Fig.1.
In Fig. 12, we transversely compare the O−density and potential at a later time of this stage, 3.162×10⁻⁵s. At the diffusion and negative source term, O−density evolves to a prototype delta,as determined by Eq.(2).
In Figs.15 and 16,the electrons and Ar+ions densities at the four times are plotted,respectively. The evolving trend of electrons density with time is similar to the potential in Fig.10,but the Ar+ions density trend is different from it. As is seen,the delta characteristic appears within the Ar+density profile.It indicates that the O−species,once assembling into the delta profile, begin to attend the ambi-polar diffusion process, and the plasma transport in the profile center starts to be dominated by the pair of ions,not the electrons. The electrons density is now a negative charge background for the O−species, since the O−density is quite low, as compared with the electrons and Ar+ions. The Ar+ion is now balanced by the combining effect of electron and O−.
In Fig.13,we longitudinally compare the O−density and potential at 1.778×10⁻⁵s. Why a longitudinal comparison is still needed?Because along the polar direction,the O−species have not all migrated into the potential bottom (marked by the vertical red dashed line),indicating the existence of radial drift. However,this radial drift does not impede the formation of O−delta,but improves it,as all drift processes accumulate O−species (which then forms high O−density and negative source term).
In Fig.14,we longitudinally compare the O−density and potential at 3.162×10⁻⁵s. The prototype O−delta formed still strides across the potential bottom. It predicts a walk process of O−delta along the radial direction, which will be shown in the next sub-section. Before the description of delta walk, a question is proposed first. Why the axial drift of O−species is faster than the polar direction? It is because of the low aspect ratio of the reactor used. This phenomenon is also occurred in a pure argon plasma at the same discharge conditions and chamber.
3.3.3. Walk of O−delta and ambi-polar potential freezing
In Fig. 17, the O−delta walks along the radial direction toward the axis, at the push of ambi-polar potential, as predicted. As the drift continually assembles O−species,the O−delta density is further increased with time in the walk process and then saturates as the walk behavior is finished, as shown in Fig. 18. In Fig. 19, the trends of potential contour with time at the stages Nos.2 and 3 are compared. As exhibited by Figs.19(a)–19(c),the evolution of potential contour in the radial direction is almost stopped in the walk stage(stage No. 3), different with the stage No. 2 shown in Figs. 19(d)–19(f), where the radial evolution of potential is performed.The temporary stop of ambi-polar diffusion in the walk stage,i.e.,potential freezing,is because the transport of the positive ions, e.g., Ar+species, is now completely dominated by the O−delta,not the electrons,as illustrated in Fig.20,where the electrons and Ar+ion densities profiles evolve so differently with time. This is logic since the influence of O−delta on plasma transport is more important as it is formed.

Fig. 17. The evolution of prototype O−delta with time when the location shift of prototype O−delta is occurred. Selected O−density profiles at(a)3.162×10⁻⁵ s, (b)5.109×10⁻⁵ s, and(c)7.499×10⁻⁵ s. The discharge conditions are the same as those in Fig.1.

Fig. 18. The O−density peak versus simulation time for the stage of O−delta walk, when the O−density increases and saturates at the polar drift.The discharge conditions are the same as those in Fig.1.

Fig.19. The temporal evolutions of potential contour at the stages Nos.3 and 2. At the stage No.3,the times for the selected potential contours are(a)3.162×10⁻⁵ s,(b)5.109×10⁻⁵ s,and(c)7.499×10⁻⁵ s(corresponding to Fig.17). At the stage No.2,the times for the selected potential contours are(d)1.0×10⁻⁵ s,(e)1.778×10⁻⁵ s,and(f)3.162×10⁻⁵ s(mainly corresponding to Fig.8).
Note that the temporal halt of potential evolution does not influence the walk of O−delta, because the delta is now located out of the potential bottom,as shown in Figs.21(a)and 21(b). When the O−delta is completely trapped by the potential, displayed in Figs.21(c)and 21(d), the O−delta walk is finished, as imagined. As the potential evolution is temporarily suspended while it keeps pushing the O−delta, the potential energy is transformed into O−delta kinetic energy;hence the potential value is decreased,as shown in Figs.21(b)and 21(d)and Figs.19(a)–19(c). In Fig.22,the radial profile of O−density versus time at this stage is shown. As seen,the radial walk of delta is more clearly displayed.

Fig. 20. The evolution of electrons and Ar+ ions densities with time when the location shift of prototype O−delta is occurred. Selected electrons density profiles at(a)3.162×10⁻⁵ s,(b)5.109×10⁻⁵ s,and(c)7.499×10⁻⁵ s. Selected Ar+ ions density profiles at(d)3.162×10⁻⁵ s,(e)5.109×10⁻⁵ s,and(f)7.499×10⁻⁵ s. The discharge conditions are the same as those in Fig.1.

Fig.21. The horizontal comparisons of O−density profiles[(a)and(c)]and plasma potential contours[(b)and(d)]at an earlier time 3.162×10⁻⁵ s,and a later time 7.499×10⁻⁵ s,in the O−walk stage,respectively.
Fig.22.The evolution of one-dimensional(1D)O−density profile with time.Selected radial O−density profile at(a)3.162×10⁻⁵ s,(b)5.109×10⁻⁵ s,and(c)7.499×10⁻⁵ s,with the axial position of z=8.5 cm. The discharge conditions are the same as those in Fig.1.
3.3.4. Restart of ambi-polar diffusion and the O−delta refinement
In Fig. 23, the O−delta evolution with time after the walk stage is shown. The O−delta density is decreased and then saturates(see Fig.24),and the O−delta is horizontally prolonged. The axial delta type is more obvious at the prolongation,by referring to Fig.25 as well,where the axial profile of O−density is shown.

Fig. 23. The evolution of O−density profile with time when the refinement of O−delta is happened. Selected O−densities at (a) 1.0×10⁻⁴ s, (b)5.109×10⁻⁴ s,and(c)3.162×10⁻³ s. The discharge conditions are the same as those in Fig.1.

Fig.24. The O−density peak versus simulation time for the refinement stage of O−delta,when the O−density decreases up to the steady state,with(a)linear and(b)logarithm time axes,respectively. The discharge conditions are the same as those in Fig.1.

Fig.25.The evolution of 1D O−density profile with time in the refinement stage.Selected axial O−density profile at(a)1.0×10⁻⁴ s,(b)5.109×10⁻⁴ s,and(c)3.162×10⁻³ s,with the radial position of r=7.0 cm. The discharge conditions are the same as those in Fig.1. In the end of this process,the refined O−delta is formed along the axial direction.
In Fig.26,the potential contours of two times that correspond to the initial and end of the final O−stage,respectively,are plotted. Surprisingly, the potential evolution, originally stopped in the stage No.3,is now restarted. Although the O−delta is formed,this Ar/O2plasma studied is still mainly made of electrons and positive ions,at the very low electronegativity.So,the final ambi-polar diffusion potential ought to approach as closely as possible to the profiles of electropositive plasmas,i.e.,trigonometric and the Bessel’s functions that are predicted by analytic theory. Otherwise, the sheath and presheath built near the border that support the bulk plasma are not stable and the simulated discharge of Ar/O2mixture may collapse. The potential profile at the initial of final O−stage, as shown in Fig.26(a), still deviates far away from the above analytic solutions. That is why the ambi-polar diffusion restarts, after the delta basic profile and location are fixed. In Figs. 27 and 28, the electrons and Ar+ions densities at the initial and end of this stage are plotted. As is seen, the ambi-polar diffusion process is clearly re-occurred. The Ar+ions, originally restricted by the O−delta in the profile center, are now scattered,as shown in Fig.28. Although the ambi-polar diffusion is restarted,the potential value decreases,as seen from Fig.26.This is caused by the dielectric characteristics of O−delta and Ar+ions. Mathematically, the O−delta is discrete and more like point charge(idealized physical model of classic mechanics). The Ar+ions and electrons mediums are relatively continuous dielectrics. The negative point charge plays the roles as the ambi-polar potential,i.e.,pushing electrons inward and pulling Ar+ions outward. Therefore,the potential is counteracted and hence decreases with time.
Fig. 26. Potential contours at (a) 1.0×10⁻⁴ s and (b) 0.01 s within the refinement stage. The discharge conditions are the same as those in Fig.1.

Fig.27. Electrons density profiles at(a)1.0×10⁻⁴ s and(b)0.01 s within the refinement stage. The discharge conditions are the same as those in Fig.1.
Fig.28. Ar+ ions density profiles at(a)1.0×10⁻⁴ s and(b)0.01 s within the refinement stage. The discharge conditions are the same as those in Fig.1.
Since the ambi-polar diffusion is restarted in the whole space, the drift of O−species dominates again, and it attenuates the diffusion. At the lack of free diffusion, the O−delta forming conditions (aimed at increasing up the O−density),are destroyed. So,the O−delta density is decreased in the final stage. The drift here cannot play the role of accumulating O−species (that will increase O−density) as in the Subsubsection 3.3.1, because there are no scattered O−species now(all anions in the space have almost been assembled into the delta). Meanwhile,the O−delta is refined due to the squeezing of drift. As shown in Fig.29,the potential bottom border at the steady state strides slightly over the O−delta. So, the squeezing role of drift is mainly played at the right part of O−delta. This is also embodied by the O−density profile evolution in Fig. 23. The squeezing of drift leads to slight propagation and sharpening of O−delta. The drift here is played onto a rough delta,not a smooth profile(like the Bessel function). So,it refines the delta,but not condensing a wide profile as in Ref. [21]. In addition, the restarted ambi-polar potential does not significantly shift the position of O−delta as in the stage No. 3, but just slightly adjusting its magnitude and shape. This is perhaps because the inverse diffusion caused by the delta distribution is stronger than the drift now.
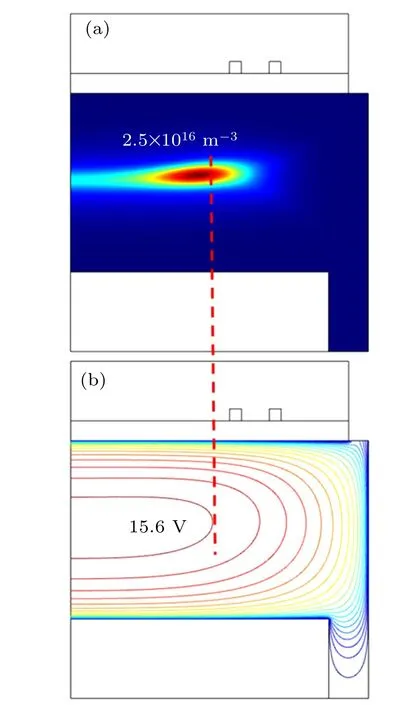
Fig.29.Steady state O−density(a)and potential contour(b).The discharge conditions are the same as those in Fig.1.
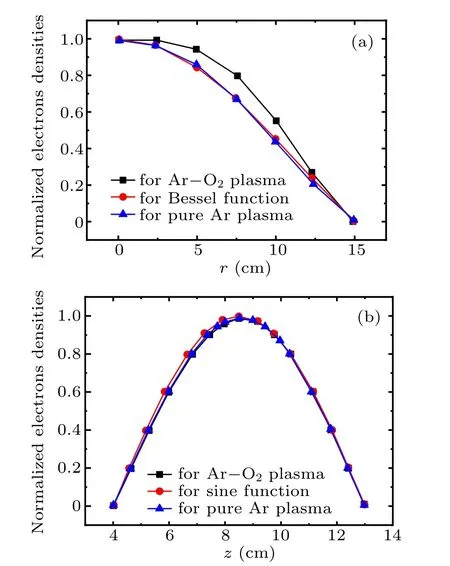
Fig. 30. (a) Radial distributions of normalized electrons densities of Ar/O2 plasma (black squares), pure argon plasma (blue triangles), and the zeroorder Bessel function (red circles), j0(2.405r/R) (R = 15.0 cm). (b) Axial distributions of normalized electrons densities of Ar/O2 plasma (black square),pure argon plasma(blue triangle),and the sine function(red circles),sin[(z−4.0)π/l](l=9.0cm). The discharge conditions of Ar/O2 plasma are 300 W, 30 mTorr, and 9:1 Ar/O2 gas ratio. The conditions of pure argon plasma are 300 W and 30 mTorr. The chambers of two plasmas are the same.

Fig. 31. Steady state potential contour (a) and electrons density profile (c)of Ar/O2 plasma with the discharge conditions of 300 W, 30 mTorr and 9:1 Ar/O2 gases ratio. Steady state potential contour (b) and electrons density profile(d)of pure argon plasma,with the discharge conditions of 300 W and 30 mTorr.
Due to the interference of O−delta, the positive ions,i.e.,Ar+,O+2and O+,cannot freely attend the ambi-polar diffusion, hence the radial profile of steady state electrons density obviously deviates from the Bessel distribution,as shown in Fig. 30(a). This trend is more obvious in Fig. 31, where the potential and electrons density of the Ar/O2plasma are compared with the pure argon plasma, at the same discharge conditions and chamber. Note the O−delta is far away from the axis, the axial profile of electrons density is less influenced and retains basically the sine distribution, as shown in Fig. 30(b). The radial Bessel and axial sine distributions of electrons density at free ambi-polar diffusion(without the influence of delta) is given by the analytic model described in Ref.[20].
3.4. Other useful issues related to the O−delta found
3.4.1. Possible validation of this simulation work
Unlike the used fluid version in the O−delta work (illustrated in Section 2 and Ref. [12]), the fluid model used in the Ar/CF4simulation utilized less approximations.[23]For instance,ions are described by full momentum equation,not by the drift and diffusion approximation. The room temperature assumption is not used for heavy species,but the energy equations are applied to describe the ions and neutrals temperatures.As is known,the HPEM code is famous for its completeness on selecting fluid equations. It is seen that the simplified(used in Ar/O2plasma)and full(used in Ar/CF4plasma)fluid models both predict quasi-delta negative ions density. This means that these approximations used in the fluid model of the present work do not significantly influence its ability of predicting delta profile of negative ions density.
Besides the above Ar/CF4simulation, analytic works in Ref. [24] that apply to general electronegative plasmas discovered the similar phenomenon,i.e.,at small generation but large consumption sources, the negative ions density tends to localized delta distribution; see Fig. 12(a) of Ref. [24] for reference. In the analytic works of this reference, the small generation source of anions was given directly by the attachment rate coefficient, i.e., ka= 10−12cm3/s, and the large consumption rate of anions are embodied by the ratio of ionization versus attachment rate coefficients, i.e., ki/ka=49.6.Large ionization rate provides high positive ions density and hence large consumption rate of anions via the recombination.This corresponds well to the discharge conditions studied here,i.e.,inductively coupled plasma(providing high positive ions density)and large Ar/O2feedstock gases ratio(providing low electronegativity and effective small attachment rate).
More relevant works are picked up and compared. One Ar/O2fluid simulation conducted in inductively coupled plasma at the 20%O2concentration[21]is analyzed.In this reference,a relatively smooth and condense(not a delta)O−density profile was predicted, as shown in Fig. 2(c) of Ref. [21].This is partially because the O2content is high. More importantly, the fluid version used in this work did not consider the dissociation consumption of the molecular feedstock gas species, O2, but used the constant background gas density based on the state equation of ideal gas. As is known,the dissociations of molecular gas discharges deplete the feedstock molecules, as illustrated in Ref. [23]. In simulating the anions delta profile, the dissociation consumption of molecules is important, as it leads to small generation source of anions.Moreover,the positive density calculated in Ref.[21]is quite low,i.e.,~5.5×1010cm−3,not high enough for forming large consumption rate of anions. Indeed,according to the analytic theory proposed in the Subsection 3.2 of the present work,the combination of moderate positive generation source and drift gives rise to smooth and condense anions density profile.
Besides, in Refs. [25–27], Sheridan and Chabert predicted a stratified discharge that consists of an electronegative core and electropositive edge, via the analytic theory at low electronegativity. In this stratified structure, the negative ions density profile is smooth, which is not in accord to the sharp anion delta at low electronegativities discovered in the present work. This is because the Boltzmann approximation was used in that analytic work for the negative ions. While in our simulations, the negative ions clearly disobey the Boltzmann relation. Namely, the flux is not approaching to zero,but is significant both at the simulation initial (by drift) and the end(by diffusion).
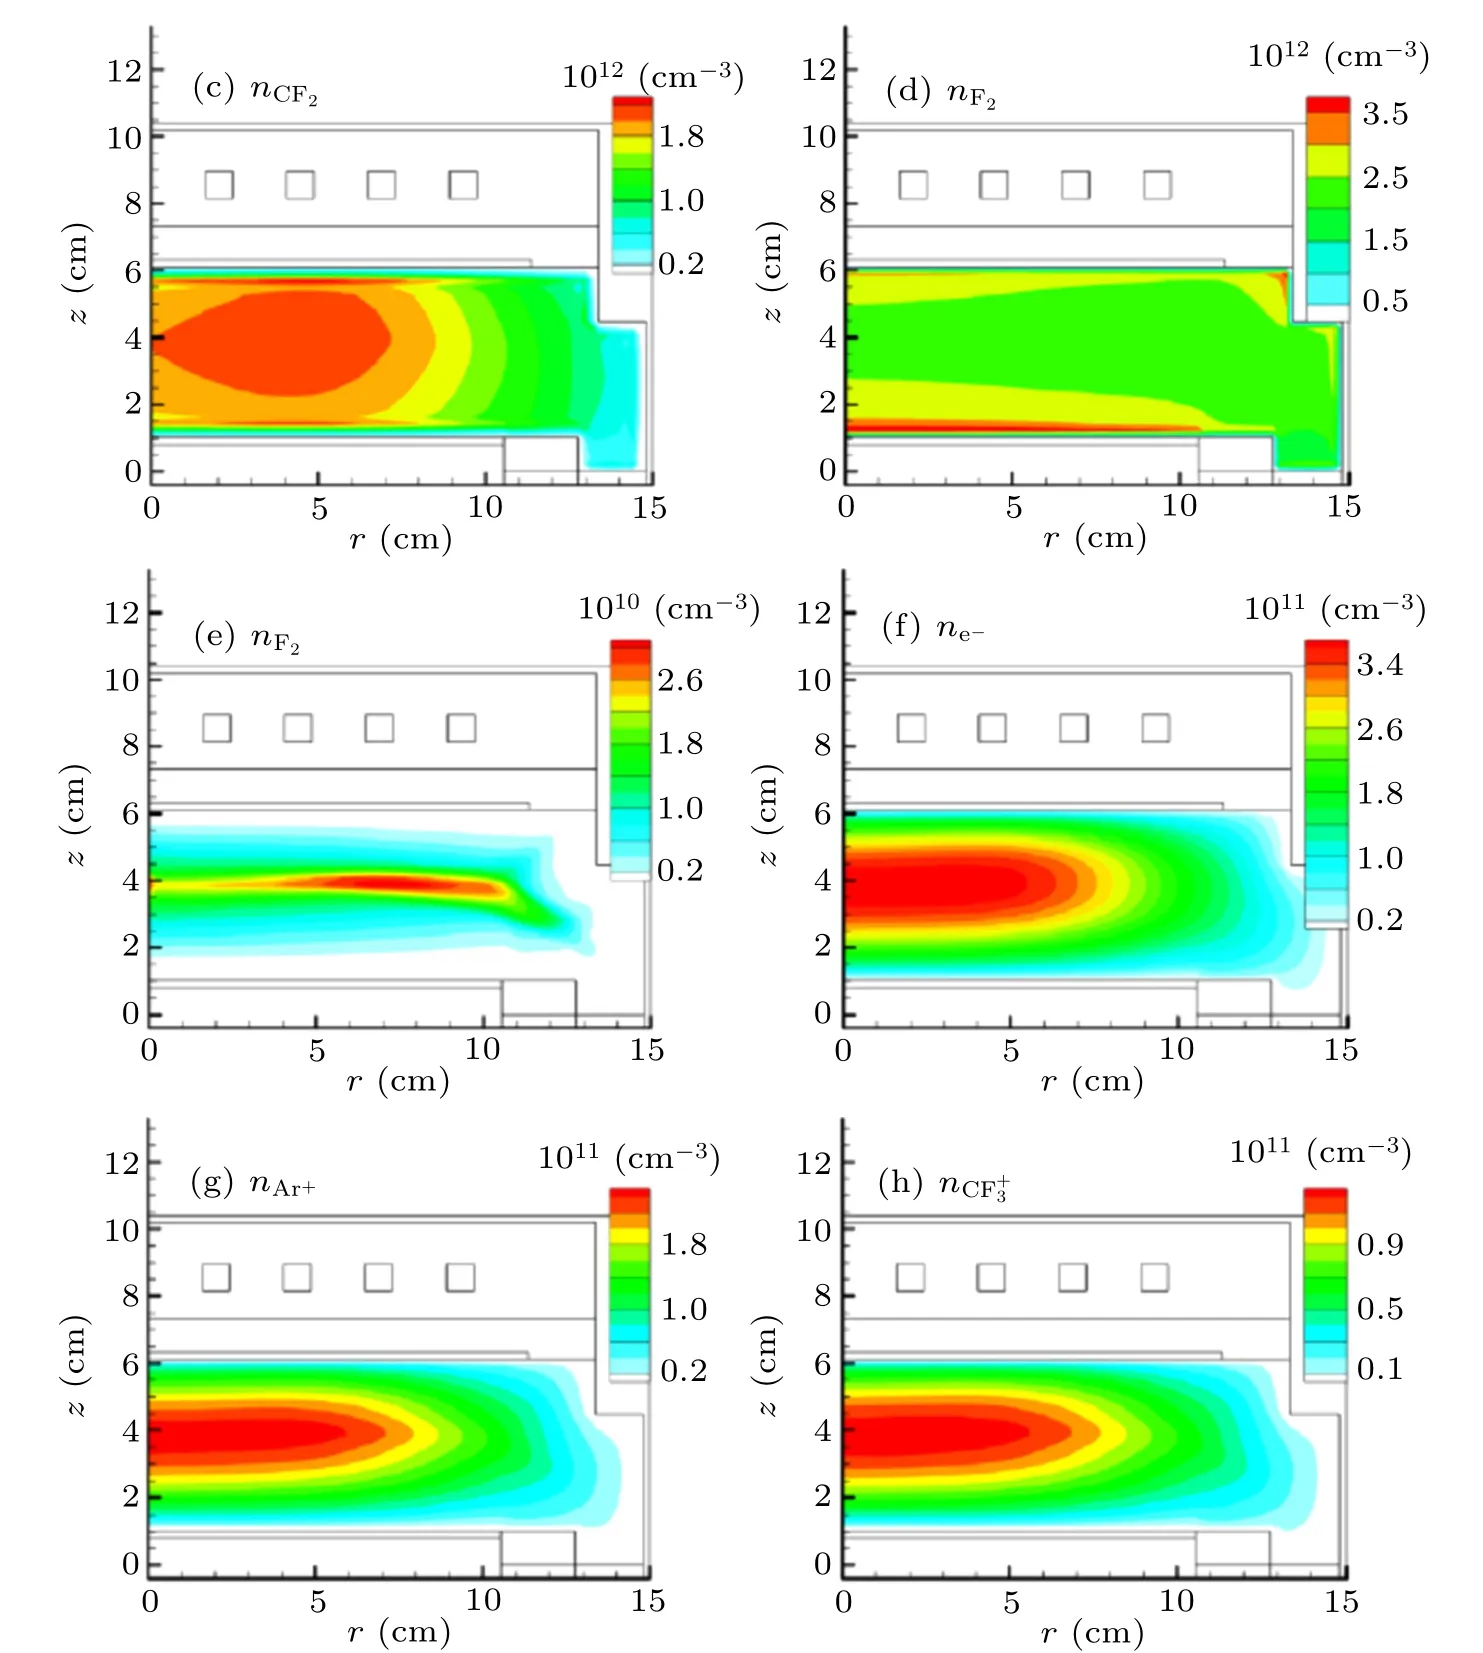
Fig.32. Several key species densities of an inductively coupled Ar/CF4 plasma,a snapshot of Fig.2 of Ref.[22]. (c)CF2 radical,(d)F2 molecule,(e)F−ions,(f)electrons,(g)Ar+,and(h)CF+3 species. The discharge conditions are 500 W,10 mTorr,5:5 Ar/CF4 gases ratio. This simulation Ar/CF4 work is given by the famous hybrid plasma equipment model(HPEM)from respected professor Kushner’s group.
3.4.2. Parameter dependence of the O−delta
The discharge parameter dependence of O−delta is shown in Fig. 33. In Figs. 33(a) and 33(b), the O−density profiles at different pressures are compared. At increasing the pressure,from 30 mTorr to 40 mTorr,the outline of delta is expanded because the electronegativity at high pressures is large,so the ratio of recombination loss versus attachment generation source of anions is decreased and the net negative source term(i.e.,determinative role of delta formation)of anions cannot be well approximated. See the following formulae:
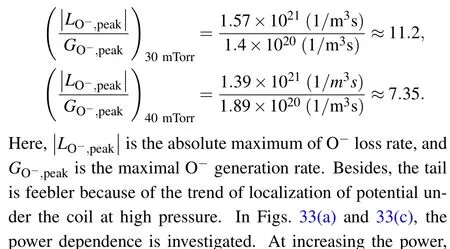


Fig. 33. The dependence of O−delta on the discharge conditions. In panel (a), the O−density profile at the basic condition, i.e., 30 mTorr, 300 W,and 10%of O2 concentration,is given. The remaining three O−density profiles are plotted at three different discharge conditions. Keeping the other parameters unchanged,the pressure is increased to 40 mTorr for the case of panel(b),the power is increased to 400 W for panel(c),and the ratio of O2 concentration is increased to 40%for panel(d).
3.4.3. Numerical relevance of O−delta
It is stressed that the O−delta appearance depends on the mesh size. All the relevant data presented before are based on a fine mesh, which is shown in Fig. 34(b). At this fine mesh,the simulated O−delta is like a comet in Fig.34(d),as stated before. At relatively coarse mesh (which is probably fine enough for inert gas,like pure argon,discharges),the O−delta is more like a tadpole,carrying a vibrated tail,illustrated in Figs. 34(a) and 34(b) This characteristic is more obvious in the axial profiles of O−densities plotted in Fig. 35. The numeric vibration is occurred at the delta tail due to the lack of diffusion mechanism therein. When numerically solving transport problems,artificial vibration,i.e.,Gibbs phenomena or numeric dispersion,tends to appear at strong advections.[28]At fine mesh, the numeric vibration is suppressed and meanwhile the delta is refined because small elements are needed for resolving better large gradients of density.[29]
It is emphasized that no matter a tadpole or comet is obtained, the delta structure, called probably as tadpole head or comet pan, is preserved. This is the precise physics specifically focused in this work. The formation of tadpole tail and pan handle given at the coarse and fine meshes, respectively,is natural and actually further verifies the working mechanism of delta. The negative source of anions cannot form at the tail because the anions never accumulate into this region due to the lack of ambi-polar potential field drift(as seen before,drift accumulates anions and hence gives rise to negative source term). Nevertheless, the small amount of anions that are sparsely distributed in the potential bottom are drawn toward the delta,due to the self-aggregation of delta;see Figs.11 and 12 for reference. Then,the tail of delta is thereby formed.
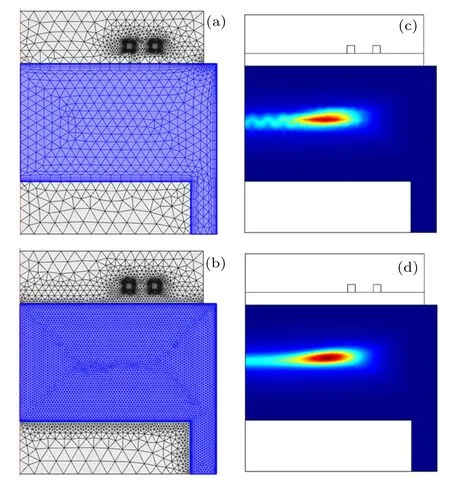
Fig.34. Coarse(a)and fine(b)meshes,and the O−deltas calculated based on these two meshes, respectively. At coarse mesh, the O−profile is more like a tadpole in panel (c), and at fine mesh, it is more like a comet that is embedded in the bulk plasma in panel(d). The discharge conditions are the same as those in Fig.1.
Besides, we stress that the simulated O−delta is not a real mathematic delta,strikingly speaking. As seen in Fig.25,the O−density peak in the axial profile is limit value and the interval that the bumped O−density crosses is about onecentimeter wide.However,the delta structure is an asymptotic behavior of such type O−profile. In the real physical world,realistic delta is not existed either.It is just one idealized physical or mathematic model. Considering these facts,we persist to define our bumped O−profile as delta,but putting a prefix,quasi-,ahead of it,as presented in the article title.

Fig.35. The steady state O−density radial profile, at the axial position of z=8.5 cm,at(a)fine and(b)coarse meshes.
3.4.4. Comparison of O−delta to negative ions front
In this subsection, the O−delta discovered in this work is compared to the known negative ions front structure,[11,30]as they exhibit similar characteristics, i.e., shock or discontinuity. The front is arisen from the drift role of ambi-polar diffusion potential, while the delta is given by the synergetic process of diffusion and negative source of anions. As mentioned above, due to the hot electrons, the ion diffusion is negligible,which is nevertheless the determinative role in the delta formation(playing the role as inertia[31]). Moreover,the property of source term of negative ions is also insignificant in the formation of front, as it can still be predicted by the continuity equation of negative ions when the source term is excluded. In essential,the front structure arises from the nonlinear dependence of flow velocity on the density of negative ions,which is implied in the complicated correlation between various species drift fluxes, and so the source term is negligible. This is quite different from delta, where the negative source term is one necessary condition as it plays the role of dispersing force.[31]The physics of delta formation,given by a Helmholtz (given in the present work) or revised oscillator equation(reported in a relevant paper[31]),represents the process of mass assembly toward one fixed reference point from the periphery at dispersing force.
Compared to the front,which is dynamic and represented by the concept of shock or density discontinuity, the formed delta is more analogous to the steady state dissipative structure,given by specific self-organization behavior. The delta is in accord to the definition of dissipative structure in the ways of(i)far deviation from the Boltzmann balance of anions,(ii)transfer from disordered (represented by the initial scattered and smooth anions distributions)with maximal entropy to the ordered structure (a sharp delta and vacant anion density) at minimal entropy,(iii)opening and dissipative system that exchanges mass with the external environment,i.e.,the negative source term consumes positive ions (provided by ionizations at high electron temperature driven by electromagnetic field of coil current)via recombination,(iv)the system of multiple mass components (i.e., electrons and different types of positive and negative ions) interacted and multiple physics fields(temperature, density, momentum, and electromagnetic) coupled,with the complicated correlations between them,and(v)positive feedback system with the working mechanism that anions assemble leads to negative source term via recombination,and once the negative source term is formed it abstracts more anions (which is physically interpreted better by the revised oscillator equation at dispersing force), etc. As mentioned in Ref.[32], the combination of diffusion and chemical kinetics(very similar to our delta working mechanism)has indeed created self-organization behavior that produces dissipative structure in the neutral gases. This reminds us of the possible correlation of delta with dissipative structure, and meanwhile strengthens our confidence onto suggesting this correlation.
In addition,one more difference exists between front and delta. The front predicts the periphery of bulk negative ions density, i.e., one shock boundary layer surrounds the internal negatively charged species. The internal structure of bulk anions cannot be specified via the front theory. As the experiments exhibited,[11]the internal structure of anion density is either flat(oxygen discharge),predicted by the elliptic or flattop analytic mode of Lichtenberg et al.,[20]or bumped up(SF6discharge), unsolved yet. The delta structure is just used to describe the internal structure, as it is formed at the bottom of ambi-polar diffusion potential via diffusion and negative source. As is already well known, the periphery of potential creates the front structure of anions, by means of drift. From this point of view,this difference of delta and front is more like a connection of them (or collaboration, more precisely), i.e.,front explaining the peripheral edge of anion density,while the delta illustrating the internal bulk configuration of anions. In another work,we are investigating the localized or bumped up anion density in SF6inductive discharge, by using the delta forming mechanism,which is expected to advance the field of analytically interpreting these exotic anion profiles, together with the already established analytic theories,such as trigonometric, Bessel, parabolic, elliptic, flat-top, and of course the front discussed above,etc.
3.4.5. Conditions when the O−delta is disappeared
In this sub-section, the conditions at which the O−delta structure is disappeared are explored. We successfully found a new set of Ar/O2discharge conditions,i.e.,10 mTorr,300 W,and 1:9 Ar versus O2gas ratio.As seen in Fig.36(a),the simulated O−density profile at this discharge conditions set is quite uniform,so is the main positive ions O+2density in Fig.36(b).
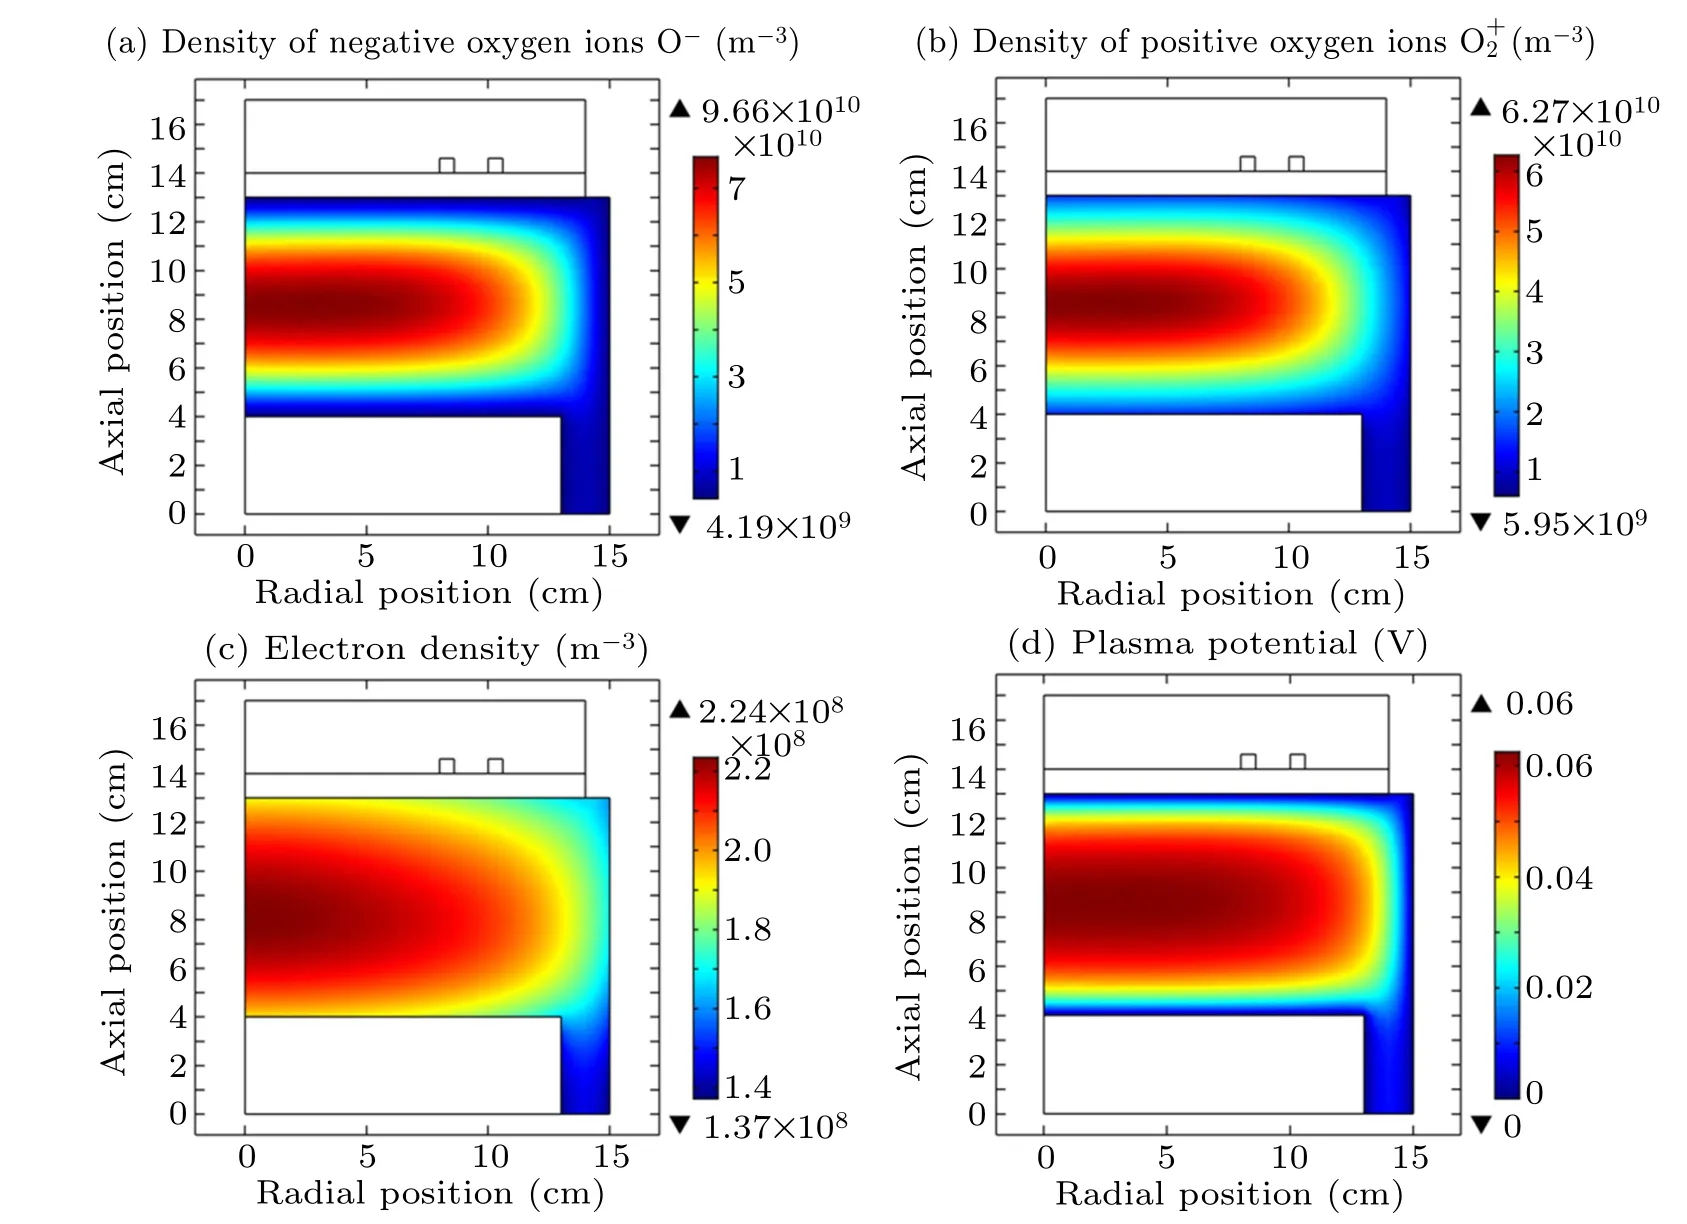
Fig.36. Density profiles of negative oxygen ions O−(a),positive O+2 ions(b),and electrons(c),together with the plasma potential(d)in a new Ar/O2 inductive discharge,i.e.,at the discharge conditions of 10 mTorr,300 W and 1:9 Ar veruss O2 gas ratio.

Fig. 37. (a) Density profile of negative oxygen ions O−, the reaction rates of O−generation (b), and loss (c) schemes, respectively, as well as the summed reaction rate of O−species(d),in the new Ar/O2 inductive discharge at 10 mTorr,300 W,and 1:9 Ar versus O2 gas ratio.
In Fig. 37, the corresponding source term of O−species is examined and net positive source term is observed; see Fig. 37(d) for reference. So, it validates our analysis that reveals the importance of negative source term of anions in determining its delta structure, predicted by the constructed Helmholtz equation given in Appendix B.The simulated electrons, O−and O+2densities herein are very low, as compared with the general inductively coupled plasma sources. The rate of dissociative attachments that create O−species is linearly proportional to the electrons density,while the rate of recombination that consumes O−species nonlinearly or quadratically relates to the heavy charged species densities. So,at this chemical kinetics selected, only when the plasma density decreases up to low enough value(until net positive source term of anions is formed),then the O−delta disappears.The plasma potential in Fig. 36(d) is also quite low, in the order of negative ions temperature,i.e.,0.06 eV,in accord to the prediction of relevant analytic work at high electronegativities.[10,25,33]At such a low potential barrel, the conventional sheath is not appeared, so the electrons are easily escaped to the chamber wall,leading to low plasma density in Fig.36(c).
3.4.6. Any experimental validation of O−delta?
It is noticed that this work reports on a model prediction of new plasma physics phenomenon, i.e., negative ions delta.It is a very new work and no experimental validation exists at present. Herein,we envisage possible experiments that utilize the Langmuir or Hairpin probe assisted laser photondetachment technique.[15]This technique can be used to measure the spatially resolved negative ions density profile,[34]thereby providing channels to check the possibility of appearing reported anions delta structure in low electronegative inductively coupled plasma sources. Note that it is possible to validate the steady state O−delta by experiments, not the intermediate processes given by the simulations. The intermediate processes can only be used to help people understand the formation of O−delta. In principle, if the steady O−delta is verified,so are the intermediate processes indirectly.
4. Conclusion and remarks
In this work,a novel delta negative ions density in inductively coupled plasma at very low electronegativity is the first time discovered and interpreted. The dynamics of delta forming and ambi-polar diffusion interact with each other, giving rise to very interesting transport phenomena. At the simulation initial, insufficient anions diffusion due to small generation rate leads to anions assembling, at the push of drift. At assembling, high anions density is formed, so is the negative source term of anions. The anions dynamic process is accompanied by the ambi-polar diffusion. When the negative source is initially formed, it is coincidently located in the potential(that is evolving)barrel bottom,at the axial direction. At this temporal point,a combination of axial free diffusion and negative source is ready,which mathematically predicts delta profile,as proven. So,prototype delta is formed. Temporally,up to now,the ambi-polar potential plays the determinative role.
Once the delta is formed, it interferes with the plasma transport.Played as the negative point charge(idealized model of classic physics),the anions delta attracts positive ions,and hence the ambi-polar diffusion(initiated by the electrons and positive ions)is temporarily halted.
Due to the low aspect ratio used for the chamber, the plasma transport in the axial direction is faster than the radial. So,when the prototype delta is formed(by the axial free diffusion, actually) and the potential is frozen, at the radial direction, the initially formed delta still strides across the potential border,implying that the drift is being happened along the radial direction. The inward walk of delta along the radial direction is hence triggered by the synergetic effect of axial diffusion and radial drift.
At very low electronegativities, the electronegative plasma behavior approaches to the electropositive plasmas.After the delta dynamic process is basically finished (with fixed density and location), the plasma transport is restarted,which reversely refines the delta appearance. At the delta influence,the steady state plasma profile deviates from the analytic solutions, but the deviation is not that much. Until now,a complete process of the interaction of delta and plasma is ended.
Although the Helmholtz equation made of free diffusion and negative source, mathematically explains the delta forming mechanism. The behind physics is still not clear.In our relevant article,[31]the one-dimensional mean of the Helmholtz equation (called as decomposed equation of negative ions in Ref. [31]), is investigated and an equivalent dynamic equation of revised spring oscillator is found out,to explain the physics for delta.
Acknowledgements
This work is supported by the foundation of project DUT19LK59. The following undergraduate students,Jing-Ze Li,Yan-Chen Bi,and Fan-Han Kong et al.,are appreciated for the interesting discussion they provided that deepen the understanding of mathematic deduction of delta in Appendix B, in the curriculum of reading comprehension and academic writings of scientific and technologic literature, given by the author,Shu-Xia Zhao(as a teacher).
Appendix A. Ambi-polar diffusion of three species system
The fluxes of positive and negative ions,and electrons,at the approximation of drift and diffusion,are expressed as

Plus with the conservation law of flux and density of species,Γ+=Γ−+Γe,n+=ne+n−,the electrostatic field is deduced as Utilize the Boltzmann relation of electrons in the gradient of electron density,∇ne.


By means of mathematic operations and approximation (i.e.,electron temperature is far larger than the ions), the field is reformed,
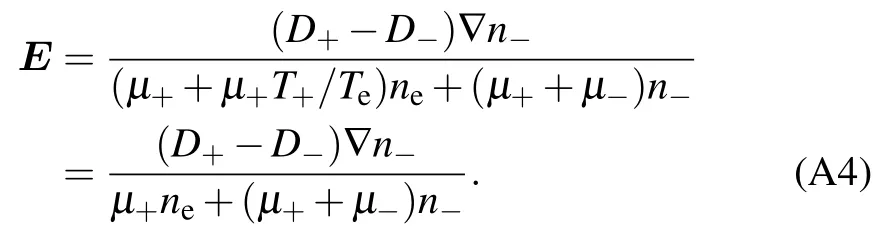
Substituting the field in the flux of negative ions with Eq.(A4),we obtain
Appendix B. Delta function deduced from the continuity equation with negative source term
The continuity equation component of negative ions O−that consists of free diffusion flux and negative source term(represented by the recombination reaction of O−and Ar+ions)is expressed as

Here,DO−is the diffusion coefficient. krecand νrecare the rate constant and frequency of recombination respectively. Making mathematic operations to Eq. (B1) and meanwhile omitting the subscript,O−,for simplification,we get the Helmholtz equation as follows:

Here,k2=νrec/DO−.Reform the Helmholtz equation with the method of separation of variables in the cylindrical coordinate system,at the assumption of azimuthal symmetry.

Here,ν2represents the eigenvalues.
With the homogeneous boundary conditions of axial ordinary differential equation,Z′′+ν2Z=0,the discrete eigenvalues of ν2are acquired,so are the eigen functions,Zm(z).


As noted,the radial ordinary differential equation,
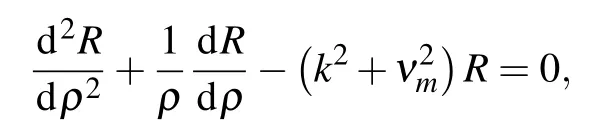
is one zero-order imaginary Bessel equation, because of the property of negative source.Considering that the density value is limit at the axial center,the imaginary Bessel function,not the Hankel function, is applied. So, we get the expression of R(r)as follows:

Finally,we obtain the expression of n(ρ,z)as,
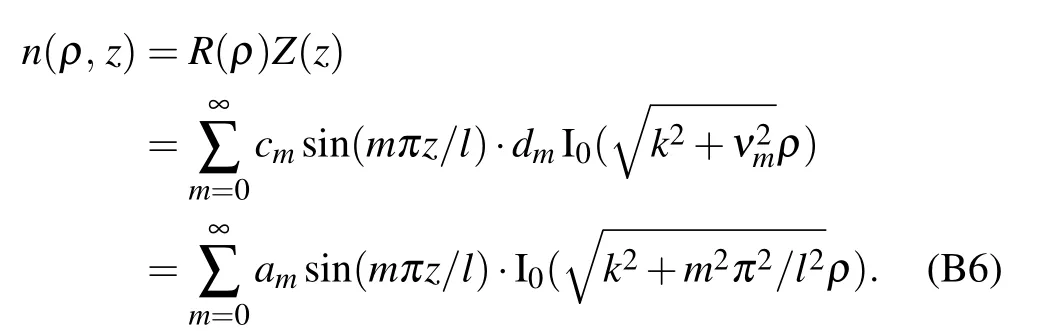
Next,special mathematic skills are applied to Eq.(B6),and a delta distribution that is independent of the spatial coordinates is deduced
Appendix C.Solution of the continuity equation of O−with drift flux and positive source term
At the small positive source term of negative ions, the Boltzmann relation is not satisfied and the flux is drift dominated,as shown below:

Accordingly, the continuity equation component of negative ions that consists of drift and small positive source term, G0,is expressed as

Making mathematic operations to the divergence of drift term and using the charge neutrality property of ambi-polar diffusion potential,the drift divergence is reformed as


- Chinese Physics B的其它文章
- Corrosion behavior of high-level waste container materials Ti and Ti–Pd alloy under long-term gamma irradiation in Beishan groundwater*
- Degradation of β-Ga2O3 Schottky barrier diode under swift heavy ion irradiation*
- Influence of temperature and alloying elements on the threshold displacement energies in concentrated Ni–Fe–Cr alloys*
- Cathodic shift of onset potential on TiO2 nanorod arrays with significantly enhanced visible light photoactivity via nitrogen/cobalt co-implantation*
- Review on ionization and quenching mechanisms of Trichel pulse*
- Thermally induced band hybridization in bilayer-bilayer MoS2/WS2 heterostructure∗