
On abnormal behaviors of ion beam extracted from electron cyclotron resonance ion thruster driven by rod antenna in cross magnetic field
2021-08-05 08:29JuanLI李娟ShenghuiFU付省辉YurouYANG杨雨柔andZhenfengDING丁振峰
Plasma Science and Technology 2021年8期
关键词:李娟
Juan LI (李娟), Shenghui FU (付省辉), Yurou YANG (杨雨柔) and Zhenfeng DING (丁振峰)
School of Physics, Dalian University of Technology, Dalian 116024, People’s Republic of China
Abstract In a 2.45 GHz electron cyclotron resonance(ECR)ion thruster powered with rod antenna under a cross magnetic field, abnormal behaviours such as sudden drop of ion beam current (Ib) and larger increasing-rate of Ib in the high microwave power (Pw) discharges at high gas flow rates were observed.A differential method was proposed to reveal the changes in the radial profiles of gray values extracted from the end-view discharge images.The increasing-rate of Ib with respect to Pw was used to evaluate efficiencies of ion production and transport.Analyses indicate that discharges are dominantly sustained by ordinary wave via electron heating in the electron plasma resonance layer that can shift along the rod-antenna, and extraordinary wave can only ignite a discharge in the ECR layer in the low gas flow rate regime.In terms of the confinement region defined by the magnetic field lines intercepting with the screen grid, the confinement region of the optimized 2.45 GHz cross magnetic field takes the shape of hourglass, enabling the high increasing-rate of Ib with respect to Pw in high power discharges at high gas flow rates.Correlated with the accompanied bright boundary layer appearing in the differentiated image,the sudden drop of Ib in the low gas flow rate regime is attributed to the discharge ignited by the enhanced extraordinary wave in the ECR layer neighbouring the narrowest confinement region,where the produced ions can promptly enter the loss region.
Keywords: ECR ion thruster, ion beam current, discharge mode transition
1.Introduction
Gridded microwave electron cyclotron resonance (ECR) ion sources have advantages of both electron heating and magnetic confinement, and therefore are widely applied in significant fields including electric thrust of satellites.To control orbit and attitude of micro satellites,small size,low discharge power and high-performance ECR ion thrusters were developed [1–15].Among the smallest (2 cm) ECR ion thrusters with various magnetic field configurations [5–7, 14, 15], the highest ion beam current was achieved in the so-called cross magnetic field[14,15],produced by two sets of magnets with magnetizations in two orthogonal directions(axial and radial).One reason for this is the axial and radial magnetic-gradient forces that respectively reduce plasma loss to the chamber walls and drive ions to move towards to the extraction grids[14].In the optimization of the 2.0 cm cross magnetic field ECR ion thruster, ion beam current and plasma impedance were studied as functions of discharge power, gas flow rate and microwave frequency [14, 15].The highest ion beam current achieved at the driving frequency of 1.6 GHz was attributed to the optimized ECR layer that was away from the solid surfaces of the rod antenna and the discharge side wall[14].However, the side-view image of the discharge demonstrated that the most luminous region was not in the expected ECR layer (see figure 2(c) in [14]), but in the vicinity of the rod antenna, implying that the practical discharges excited with the rod antenna in the cross-field configuration remain to be identified.
In designing a 5 cm ECR ion thruster powered with a rod antenna, we improved the cross magnetic field configuration by using a closed hollow magnet-cylinder consisting of eight arc-shaped magnets and covering the undesired ECR layer with aluminum plate [13].The rod-antenna discharge in the 5 cm cross-magnetic-field ECR ion thruster was failed because an arcing was ignited on the front end of the antenna in case of ion extraction.The problem was solved by replacing the rod-antenna with a circular plate one.We designed a 2 cm 2.45 GHz ECR ion thruster with a cross magnetic field configuration improved in the same way as for the above 5 cm ion source and successfully extracted ions from discharges excited with a rod antenna.
Plasmas in gridded ion thrusters are floated at the high positive voltage of the screen grid,so that diagnosing them by intrusive instruments such as electric probe is technically difficult.As the remote monitors of ion thrusters, commercially-available cameras have been used to capture discharge images.However, the raw images have been not further analyzed to gain quantified data about the monitored discharges.
Although ECR ion thrusters have been researched for more than two decades [16], and μ10 ion engines had been employed in space as the main thrust system for Hayabusa[17], ECR ion thrusters are still less developed [18].Optimizations of ECR ion thrusters rely highly on experimental test, because of the diagnostic difficulty and complicated processes occurring in the interactions between electromagnetic waves and anisotropic magnetized ECR plasmas.In contrast, investigations on mechanisms underlying ECR ion thrusters are insufficient.Effects of magnetic configuration on ion beam current from ECR thrusters have been experimentally studied [3, 14, 19–22], but the involved microwave mode transitions are not specifically analyzed.As a result,the dependence of ion beam current on discharge power is not well understood.
In this paper,we report the observed abnormal behaviors and the characteristic regions of ion beam current against discharge power, propose a differential method to analyze gray values of discharge images, and establish a simplified physical model to describe plasma production and ion transport cross magnetic field, and reveal their effects on ion extraction.
2.Experimental apparatus and diagnostics
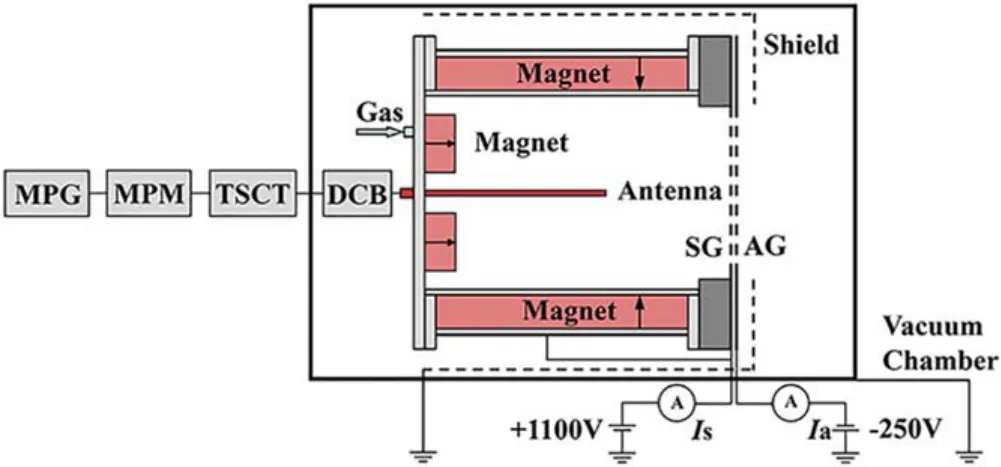
Figure 1.Schematic diagram of experimental system.MPG:Microwave Power Generator, MPM: Microwave Power Meter,TSCT: Three Stub Coaxial Tuner, DCB: Direct Current Block, SG:Screen Grid,AG:Accelerator Grid.Note that the ion thruster and the vacuum chamber are not plotted to scale.In fact, the former is smaller than one tenth of the latter.
The experimental system for the 2 cm microwave ECR ion thruster is shown in figure 1.The vacuum chamber has a diameter of 510 mm and a length of 660 mm and can be evacuated to a background pressure of 2.0×10⁻⁴Pa by a vacuum pumping system consisting of a turbo molecular pump (1000 l s−1) and a mechanical pump (14 l s−1).Xe gas injected into the discharge chamber of the ion thruster is regulated by mass flow controller (Beijing Horiba Metron,S49 35/MT).2.45 GHz microwave from a microwave power generator is fed into the discharge chamber via a microwave power meter (Bird Technologies 7022), a three-stub coaxial tuner, a direct current block and a molybdenum (Mo) rod antenna.A direct current block is used to isolate the current path between the ion thruster and the grounded vacuum chamber.The discharge chamber of the ion thruster is electrically connected to the screen grid at a positive voltage(+1100 V in experiments), and thus the plasma is floated at the positive voltage of the biased screen grid.A negative voltage of –250 V is applied to the acceleration grid to suppress back-streaming electrons.A grounded shielding-cage is mounted to protect the electrically-floated ion source from the bombardment of secondary electrons emitted from the metal surface of the vacuum chamber under the bombardment of extracted ions.The ion beam current (Ib) is calculated fromIs–Ia,hereIsandIaare the currents collected by the screen and acceleration grids, respectively [14].
The structure of the ion thruster and the magnetic field configuration are shown in figure 2, where the directions of the black arrows denote those of the magnetization.The sizes of key components in the microwave ECR ion source are as follows: the discharge chamber of the ion thruster has a diameter of 21.0 mm and a length of 14.0 mm; the diameter of the ion extraction region is 18.0 mm; the diameter and the length of the rod Mo antenna are 3.0 mm and 10.0 mm,respectively;the gap between the antenna’s front end and the screen grid is 4.0 mm.
As shown in figure 2,the magnetic field in the discharge chamber is produced by an annulus magnet at the rear end and a hollow-cylinder magnet composed of eight arc-shaped magnets surrounding the side wall of the discharge chamber.The cross magnetic field was calculated by the AC/DC module of the COMSOL software [23].In optimizing the cross magnetic field,the 2.45 GHz ECR layer was designed to locate at the midway between the rod antenna and the side wall of the discharge chamber.The optimization was performed by gradually adjusting the parameters of two magnets,namely inner radius, outer radius, axial length and remnant magnetization.Under the optimized condition, the achieved magnetic field distribution is shown in figure 2, where the white lines represent the magnetic field lines,and the red one for the location of the ECR layer corresponding to 2.45 GHz(B=0.0875 T).Obviously, the ECR layer zigzags around at the midway between the rod antenna and the side wall of the discharge chamber.
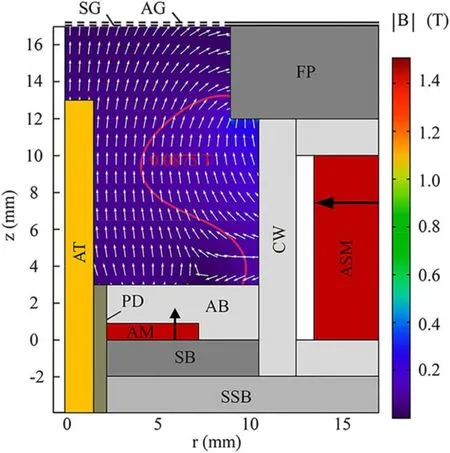
Figure 2.Magnetic field distribution of in azimuthal cross-section.AB: Aluminum Block, AT: Antenna, AM: Annular Magnet, ASM:Arc Shaped Magnet, CW: Cylindrical Wall, PD: Polytetrafluoroethylene Dielectric, SB: Soft-iron Block, SSB: Stainless Steel Block, FP: Front Plate.The white arrows represent magnetic field lines; the red line denotes the ECR layer; the black arrows indicate the magnetization direction.
A digital camera (Canon EOS 50D, 22.3×14.9 mm CMOS sensor array consisting of 4752×3168 pixels) was installed to capture end-view images of discharge glows (see figure 1).The lens aperture and the shutter speed of the camera were set at F5.6 and 1/200 s, respectively.The recorded 8 bit RGB (red, green and blue) true-colour images in JPEG (joint photographic experts group) format were converted to 8 bit grayscale (0–255 scale) files by the image processing software Image J using the average method [24],enabling quantitative analyses of radial plasma profiles.Unlike ordinary glow images, optical emissions from discharge chambers of gridded ion sources have to pass through the ion extraction holes of the screen and acceleration grids that actually act as a simple optical collimator.In this case,the spatial distribution of gray values extracted from the pixel array of an end-view image can roughly represent the radial profile of the glow.The intensity of optical emission from Xe plasma depends on Xe atom density, electron density and electron energy [25].In a small ECR ion source operating at low gas pressure,the pressure gradient of injected Xe atoms is not high, so that the local emission intensity is mainly determined by the local electron density (ne) and electron temperature (Te) [26].Therefore, the radial profile of gray values extracted from the end-view glow image can approximately represent that of the discharge intensity(defined roughly asneTe).
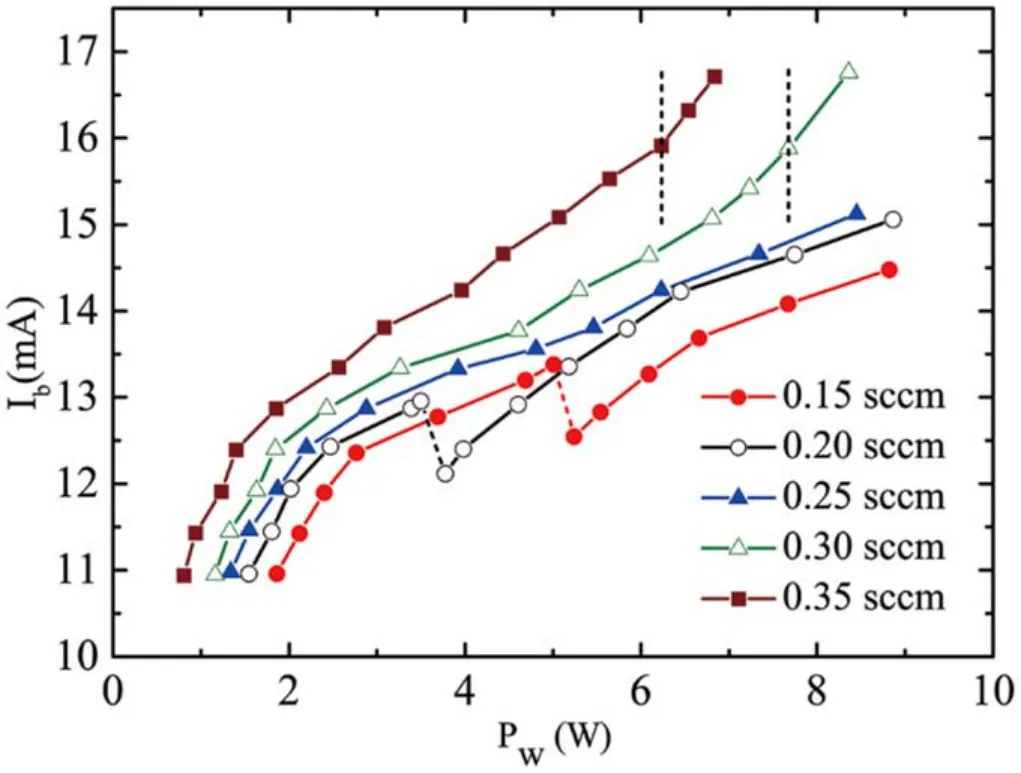
Figure 3.Ion extraction currents as functions of microwave discharge power under different Xe gas flow rates.The dashed-lines denote the intersecting points in 0.3 and 0.35 sccm curves in the high-power regime.
3.Experimental results and discussion
3.1.Ion beam current
In the range of Xe gas flow rate from 0.15 to 0.35 sccm, the obtainedIb(defined in the above section) against the microwave discharge power (Pw=Pin–Pref, herePinandPrefare incident and reflected microwave powers, respectively) is shown in figure 3.At 0.15 sccm,Ibvaries almost linearly withPwin the lowPwregime below 2.82 W.Above this value,Ibenters a new quasi-linear region with a lower curve slope.WhenPwfurther rises to 5.01 W,Ibdrops suddenly, accompanied by the sudden increments in both the incident and reflected microwave powers, indicating that the microwave discharge itself also varies discontinuously.In the highPwregime above 6.66 W, the curve ofIbversusPwresumes the quasi-linearity with a slope almost equal to that in prior to the sudden drop.
As the gas flow rate increases to 0.20 sccm, the dependence ofIbonPWis qualitatively the same as that at 0.15 sccm, i.e.the segmented linear regimes and the sudden drop ofIb.Comparing the results at 0.15 and 0.2 sccm, one finds that the criticalPWat the sudden drop ofIbdecreases with the increasing gas flow rate (gas pressure).When the flow rate further rises to 0.25 sccm,the curve ofIbversusPWbecomes continuous, i.e.the sudden drop ofIbdisappears.Obviously, the continuous curve for 0.25 sccm consists of two quasi-linear curve segments intersecting at a smallerPWcompared with low gas flow rates.As the gas flow rate enters the high gas flow regime of 0.3–0.35 sccm, the intersecting point of the two quasi-linear curves shifts gradually to an even lowerPW.Comparing all the intersecting points,one can find that they are at an almost equalIb, the reason for which will be analysed in section 3.5.4.

Figure 4.Variations of total gray value extracted from glow images with microwave power under different Xe gas flow rates.
In the high power discharges at 0.3–0.35 sccm, the third quasi-linear region, which is beyond the second intersecting point denoted with the vertical dotted line in figure 3,appears with a higher curve slope than that in the secondary quasilinear region.ThePWat the second intersecting point also decreases with the increasing gas flow rate.Compared with the 1.6 GHz ECR ion thruster with the cross magnetic field[14], theIbfrom the 2.45 GHz one exhibits different behaviors in two aspects:(1)Ibis a monotonic increasing function of gas flow rate at equalPw;(2)in the high gas flow regime of 0.3–0.35 sccm, the increasing rate ofIbwithPwin the third linear curve segment is abnormally larger, being contrary to the low efficiency of ion production in high-Pwdischarges of conventional ECR ion thrusters [3, 27–30].
3.2.Total gray value of discharge image
To gain more insight into the discharge processes, all glow images corresponding to the measured ion beam currents were recorded simultaneously.The extracted total gray-values using Image J software are shown in figure 4.Comparing the two sets of curves in figures 3 and 4,one can find that,in the low-Pwregime, all the curves of total gray value versusPware similar to those ofIbversusPW, i.e.an intersecting point lies between the two quasi-linear curves.More worthy of noting is that the corresponding intersecting-points in the two sets of curves are at an equalPwfor all gas flow rates.However,during the sudden drop ofIbat 0.15 and 0.2 sccm,the corresponding changes of the total gray-values are not as pronounced, but remain constant and decrease slightly,respectively.In the high gas flow region (0.25–0.35 sccm),the total gray-values are the monotonic increasing functions ofPw, but in the high-Pwregime for 0.3 and 0.35 sccm, the shapes of curves of total gray-value versusPwobviously differ from those ofIbversusPw.
3.3.Primary analysis of discrepancy between ion extraction and optical emission
The above discrepancy betweenIband the total gray-value is related to the different processes in ion extraction and optical emission.During the ion transport from the upstream, where ions (electrons) are generated, to the screen grid at the downstream,some of the ions(electrons)will lose on the side wall of the discharge chamber, and accordingly make no contribution toIb.In terms of residence time,such ions can be regarded to have a short lifetime.Essentially,the measuredIbis the current of long-lived ions that can arrive at the screen grid and subsequently pass through the acceleration grid.In contrast, the processes in the optical emission are more complicated.Firstly, ion emission makes less contribution to the total optical emission in the case of low ionization degree,while Xe atom emission dominates.Secondly, ions and electrons are confined in the magnetic field designed for 2.45 GHz ECR, but Xe atoms are not directly affected by magnetic confinement, so that the transport properties of particles dominating ion extraction and optical emission are different.Thirdly, the lifetime of excited Xe atom due to spontaneous emission is on the order of nanosecond, being much shorter than that of ion (electron) lost on the side wall.WhenIbis considerably reduced due to ion loss to the side wall (refer the curves for 0.15 and 0.2 sccm in figure 3), the corresponding total intensity of the optical emission (roughly proportional to the total gray value) might drop slightly or remain constant (refer the curves for 0.15 and 0.2 sccm in figure 4), because electrons (ions) transporting across magnetic field lines to the side wall still make contributions to the optical emission.AsPwrises in a same discharge mode, the plasma profile would evolve continuously.Consequently,ion loss flux to the side wall rises at a rate that is roughly proportional to ion density[31].The sudden drop ofIbin figure 3 indicates that the discharge features such as the radial plasma profile should simultaneously undergo steep variations during an unrevealed discharge transition.
3.4.Differentiated images between two consecutive discharges
To validate the above analysis, the radial profiles of the discharges in figure 3 should be investigated beside their total gray-values shown in figure 4.The discharges at 0.15 and 0.35 sccm are selected as the representative cases, where the sudden drop ofIbappears and disappears, respectively.The unprocessed discharge images are shown in figures 5 and 6.In the two cases, one can find out with naked eye that the optical emission intensity increases globally with the increasingPw,but the subtle difference between two adjacent images taken with a smallPwstep is almost indiscernible.Even during the sudden drop ofIb(see figures 5(g) and (h)),the variation in the radial profile of optical emission,which is informative of the discharge transition, is still not obvious to naked eye.
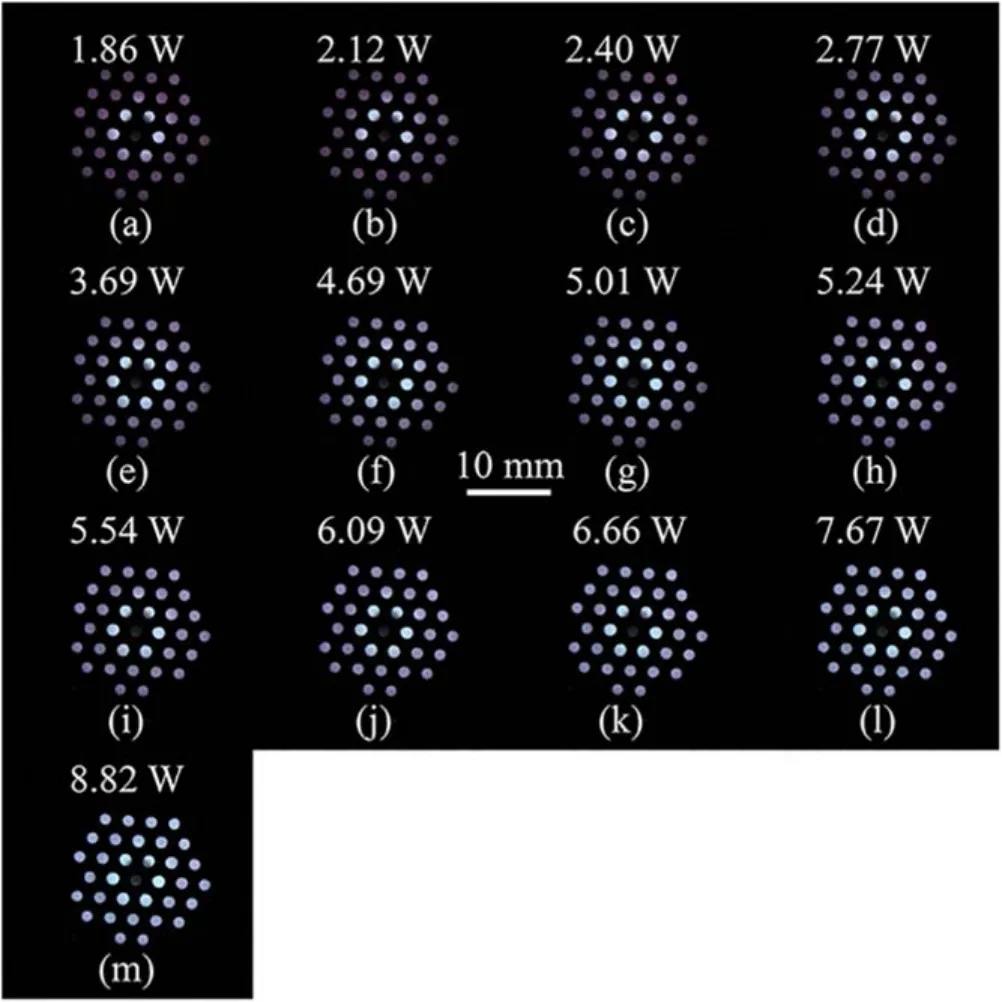
Figure 5.Images of discharge glow corresponding to those shown in figures 3 and 4 at gas flow rate of 0.15 sccm.These photos are 8 bit RGB true-colour images in JPEG format.The sudden drop of ion beam current occurs in the discharge transition from (g) to (h).

Figure 6.Images of discharge glows corresponding to those shown in figures 3 and 4 at gas flow rate of 0.35 sccm.These photos are 8 bit RGB true-colour images in JPEG format.
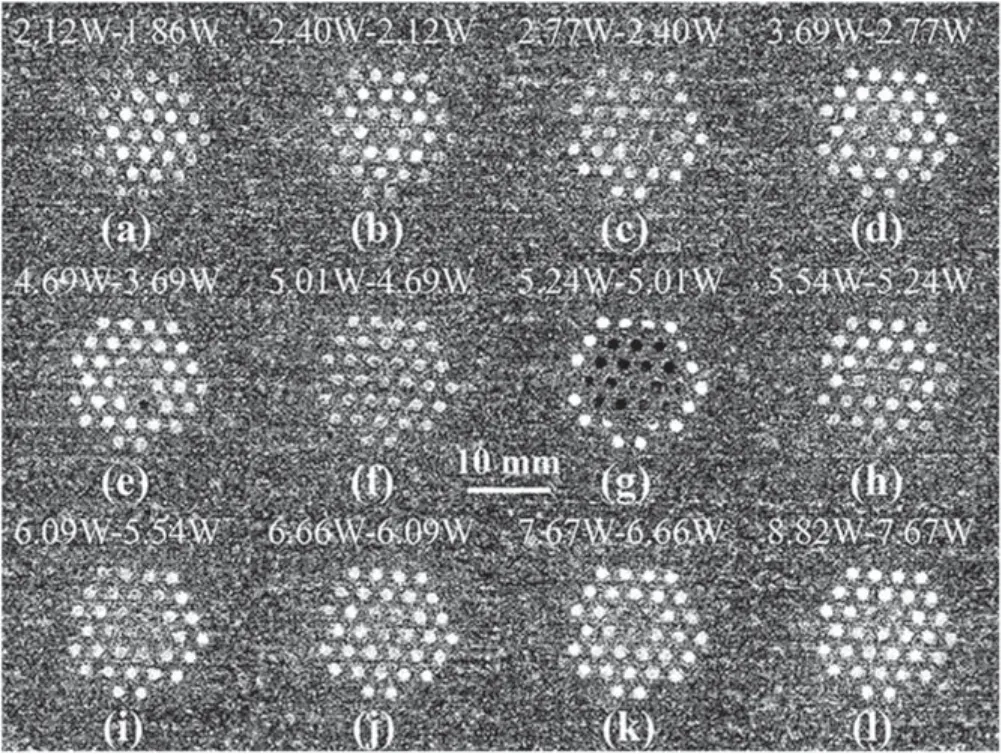
Figure 7.8 bit grayscale images of differentiated gray values from raw images in figure 5.Refer the text for the procedures to achieve the differentiated gray values.Note that figure 7(g) corresponds to the sudden drop of ion beam current.
In this situation, quantifying radial profile by software Image J is needed.In the initial attempt, the radial profiles of gray values were extracted along the selected extraction holes in a row that passed through the centre of the grids.The obtained radial profiles were unsatisfying because the difference between two consecutive discharges was found to be irregular, depending on the azimuthal orientation of the selected hole-array due to the azimuthally non-uniform gas injection.The further attempt was made to achieve two-dimensional (2D) profiles including the azimuthal direction,but the difference between the absolute gray-values from two consecutive discharges was also less distinguishable.To remove the above drawbacks,a differential method is proposed to analyse two consecutive images, the procedures of which are as follows: (1) extracting the 2D gray values from the images shown in figures 5 and 6;(2)subtracting the gray values of the image in a lowerPwdischarge from those of the adjacent higherPwdischarge; (3) the negative data from the above differential calculation are artificially set to zero, while the positive ones retain their original values.The differentiated gray values achieved in the above procedures are plotted as 8 bit grayscale images (see figures 7 and 8).
According to the differential method, the gray values increase with the increasingPwin the bright regions of differentiated images shown in figures 7 and 8.From the primary analysis in section 3.3, one knows that the variation in the gray-value approximately represents that of electron density.At 0.15 sccm, the bright regions across the entire radial domain(see figures 7(a)–(f)and(h)–(l))indicate that electron density increases with the increasingPw.The qualitatively unchanged profiles of the differentiated images in the twoPwregions suggest that the discharge modes do not vary abruptly.In the narrow windows ofPw(see figures 5(h)–(g)and 7(g)), however, the electron density decreases and increases, respectively, in the black central region and the bright boundary layer.This transition of the differentiated image profile is a physically reasonable result of the accompanied sudden drop ofIb.Moreover, the bright boundary layer is also consistent with the drop ofIb, the reasons for which are primarily analyzed in section 3.3 and will be further elucidated in section 3.5.4.
Two possibilities for the increase of electron(ion)density in the bright boundary layer in figure 7(g) are: (1) electrons(ions)produced in the upstream are more easily transported to the boundary region in the downstream; (2) more power is dissipated to produce electrons(ions)in the boundary region.In either case, the ion loss flux to the side wall increases,leading to the decrement in ion current extracted by the biased grids at the downstream.

Figure 8.8 bit grayscale images of differentiated gray values from raw images in figure 6.Refer the text for the procedures to achieve differentiated gray values.
At 0.2 sccm, the differentiated images (not presented in the paper) are qualitatively the same as those shown in figure 7.At 0.35 sccm, the bright boundary layer disappears from the differentiated images (see figure 8), coinciding with the absence of the ion current drop.
As stated in section 3.1,the curves ofIbversusPwin the high flow rate regime of 0.3–0.35 sccm (see figure 3) can be classified,in terms of the curve slope,into three characteristic regions.The smallest curve slope in the moderatePwregion implies that the plasma density should start to increase in the boundary region, as evidenced by the widest bright region of the differentiated image (see figure 8(g)).
Despite that the differentiated images offer an insight into the correlation between the ion extraction and plasma production, but the underlying mechanism is unknown.
3.5.Physical model underlying discharge mode transition
As stated in section 2, measuring the plasma profile in a small-sized ECR ion thruster is technologically difficult.In this case, numerical simulation is an alternative approach.However, the numerical modeling is also a tough task for low-pressure non-uniform ECR magnetoplasmas in the less collisional regime by 2D self-consistent PIC (particle-in-cell)or kinetic simulation of full-wave microwave fields [32, 33].In previously reported works on the sudden mode transitions of ECR discharges,numerical simulations were not successful in re-producing the experimental results.Taking the above into consideration, we discuss the correlation between ion extraction and plasma production as well as ion transportation by establishing a simplified physical model, and focusing attention on the significant features.

Figure 9.Microwave electric field(yellow lines)calculated with the radio frequency module of COMSOL software and perpendicular component of microwave electric field (E⊥, illustrated with colour contour) in ECR layer. E⊥is defined as the component of electric field perpendicular to the static magnetic field.The white arrows represent magnetic field lines.
The power deposition profile in electron heating and the distribution of ECR plasma depend on the properties of the wave modes excited by the rod antenna,such as propagation,cutoff and absorption.These properties, as indicated by the evolutions in figures 3–8, will also vary withPwor plasma density.Starting the analysis in the sequence from low to highPwis an intuitive selection.For the practical discharges,however, the low-Pwdischarge evolves from the high one after the gas breakdown.We therefore first analyze the ECR gas breakdown.
3.5.1.Electric field and electron heating in low plasma density regime during the early phase of gas breakdown.During the pre-breakdown stage, the microwave electric field in the discharge chamber is less influenced by the charged particles with a very low density,and is almost the same as that in the vacuum case.The electric field distribution in the ECR vacuum chamber, calculated by the radio-frequency module of COMSOL software, is shown in figure 9 with the yellow line.The electric field has two characteristic regions: (1)region I between the front end of the rod antenna and the screen grid, where the electric field is most intensive and the majority of electric field lines are nearly parallel with magnetic field ones; (2) region II between the cylindrical surface of the rod antenna and the side wall of the chamber,where the electric field is relatively lower and the majority of electric field lines are almost vertical to magnetic field ones.
The gas breakdown is not initiated in region I due to the following reasons: (1) the collisionless heating of cosmicradiation-produced electrons in the oscillating microwave electric field, which is almost in parallel with the magnetic field,is ineffective at low gas flow rate(gas pressure);(2)the gas gap in region I is on the order of 4 mm,being so short that the development of electron avalanche is substantially limited at low gas flow rate.The above hypothesis is also supported by the central dark regions appearing in the end-view discharge images (see figure 5).
Unlike the electron heating in region I, electrons in region II are accelerated transversely in the microwave electric field that is vertical to the external magnetic field.In the ECR layer of ω=ωce(here ω and ωceare the microwave circular frequency and the electron cyclotron frequency,respectively), electrons rotating on the Larmor orbit are continuously accelerated in each half cycle by the linearlypolarized electric field.The electrons accelerated to a high transverse kinetic energy in the transverse electric field cannot escape rapidly from plasma due to slow transport across magnetic field lines, but have a long residence time.In this situation, the ionization by electrons heated in the so-called ECR layer is more efficient than that in region II, and consequently the gas breakdown is initiated at the ECR layer in region II.
3.5.2.Exact location of gas breakdown in ECR layer.A new problem arises from the gas breakdown in region II:the ECR layer is distributed in the discharge chamber,so that the exact location of gas breakdown remains to be determined.From the transverse heating of electrons discussed above, such a gas breakdown should take place at one segment of the ECR layer where the vertical component of electric field(E⊥)with respect to the static magnetic field is highest.The calculated distribution ofE⊥over the ECR layer is depicted in a colour contour (see figure 9) plotted together with the electric field lines and magnetic field ones.One can see that the highestE⊥is around the position ofr=4.1 mm andz=9.5 mm.It is worth noting here that this location is also helpful in determining the ignition of the discharge during the sudden drop ofIb.
3.5.3.Rod-antenna excited wave modes in plasma confined by cross magnetic field.After the gas breakdown, the plasma produced in the ECR zone of the highestE⊥is transported along and across magnetic field(see figures 9 and 10(b)).For the magnetic field designed for 2.45 GHz ECR, the transport coefficient across the magnetic field is much lower than that along the field.In fact, the transient plasma transport during gas breakdown is rather complicated, so do the evolutions of the wave modes in the discharges.A thorough description of the above processes is beyond the scope of this paper.Our focus is set on the discussion of the wave modes in the representative cases.
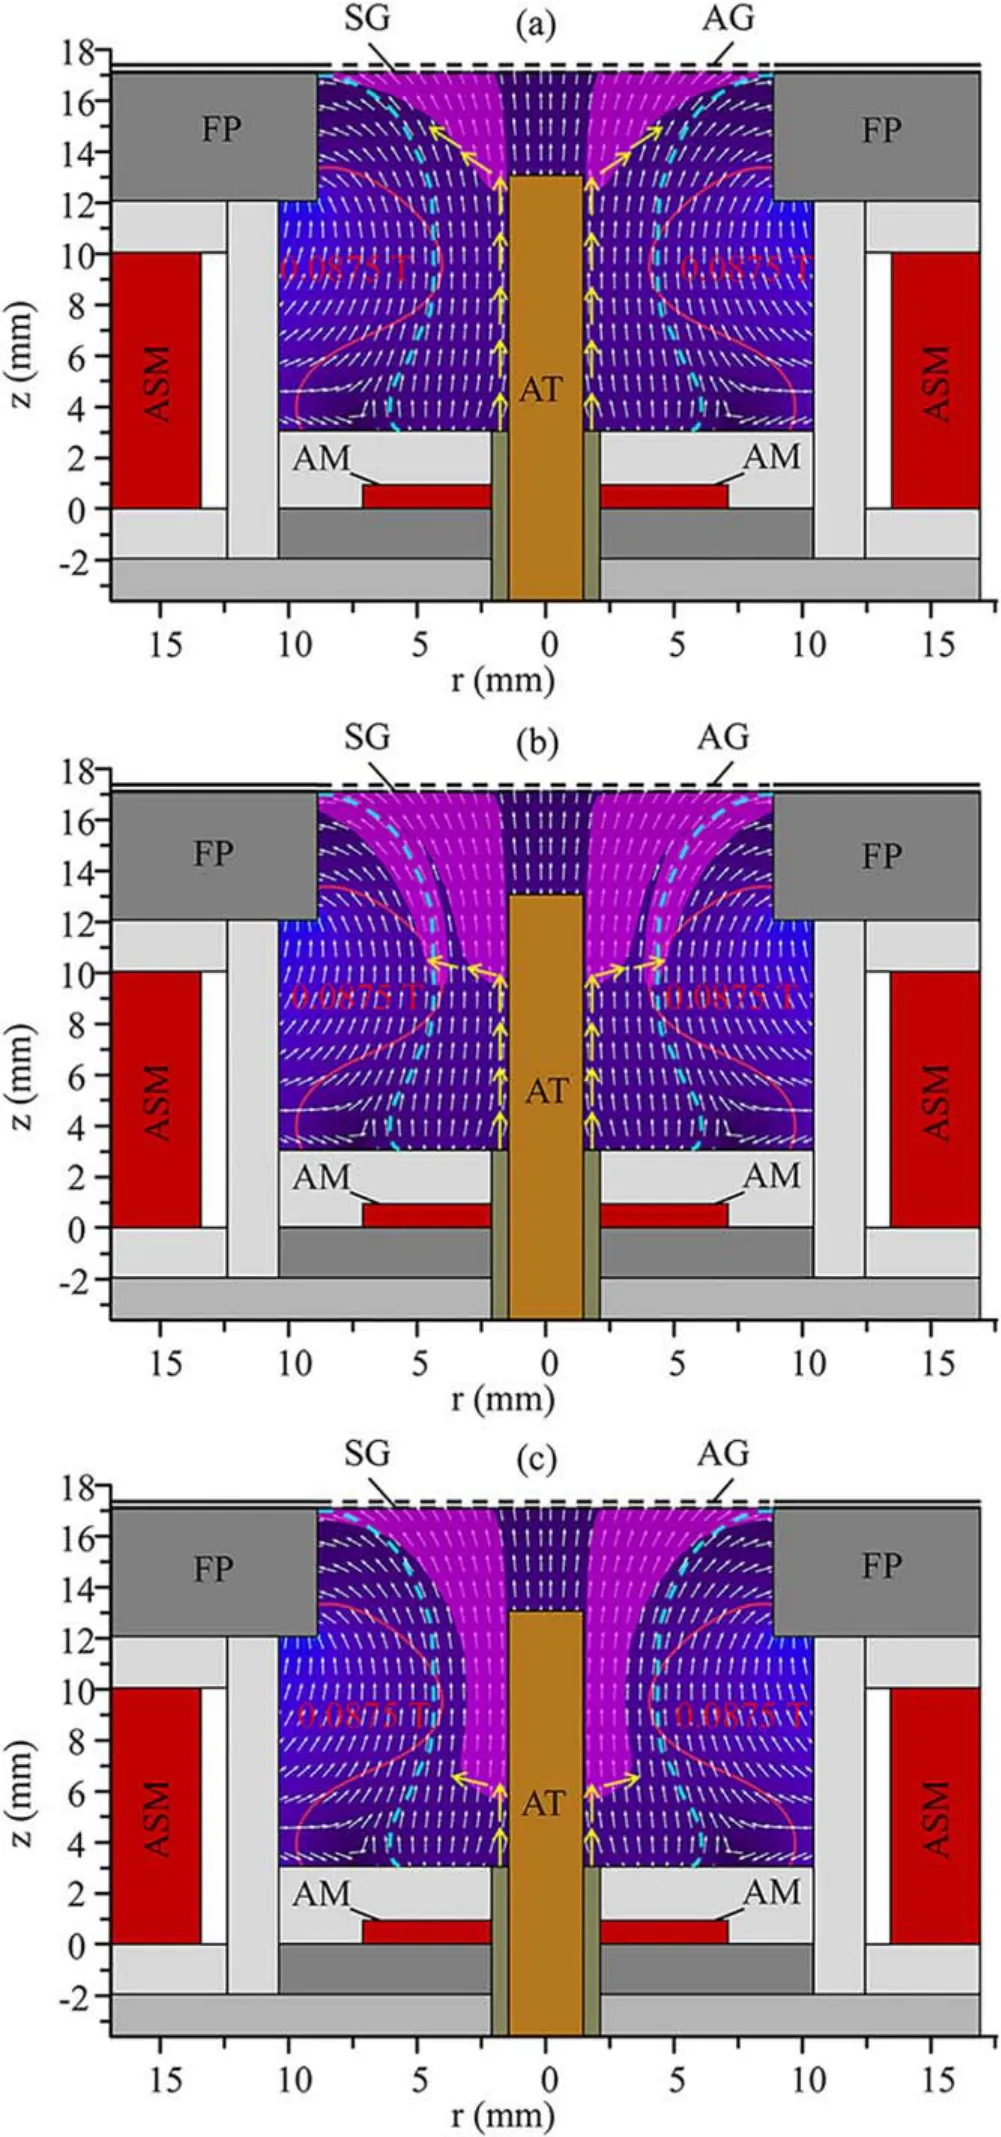
Figure 10.Schematic illustrations of plasma density distributions in low (a), moderate (b) and high (c) discharge power regimes.In the three-dimensional space, the discharge chamber is divided by the separatrix surface consisting of the magnetic field lines denoted with cyan colour,into the confinement region(inside)and the loss region one (outside).The cyan-coloured magnetic field lines are those that just intersect the corner between the screen grid and the front plate.The yellow arrows represent the direction of wave propagation.For conciseness, the reflection along the rod antenna is neglected.The ECR ignition in (b) only occurs in the low gas flow rate regime.
When region II defined above is filled with plasma, the wave excited therein by the rod antenna is named as X-(Extraordinary) mode.In the magnetic field configuration shown in figure 9, the magnetic field around the rod antenna is lower than that at the side wall of the chamber, forming a so-called low-field-side injection for the X-wave [34].In this case, the injected X-wave will sequentially encounter, in the Clemmow-Mullaly-Allis diagram [35], the cutoff layer of right-hand polarized wave and the upper hybrid resonance(UHR) layer, before reaching the ECR layer.In small-sized discharge chambers such as 2 cm diameter, the gap between the cutoff layer and the UHR layer is so narrow that the evanescent X-wave penetrating through the cutoff layer can be absorbed at the UHR layer, producing plasma therein.As the plasma density increases with the progress of gas breakdown, the UHR layer retreats together with the cutoff layer to the low magnetic field side, namely to the rod antenna.Therefore, the plasma produced at the UHR layer also contracts to the rod antenna.
The magnetic field at the cylindrical surface of the rod antenna is 0.078 T, which is slightly lower than 0.0875 T for the 2.45 GHz ECR From the UHR frequencyone knows that, the UHR layer should occur between the ECR layer and the rod antenna (see figure 9).Owing to the high magnetic field, the plasma density at the UHR layer is accordingly rather low.As the plasma density further increases with the development of the gas breakdown, the UHR layer will move closer to the rod antenna, where a strongly non-uniform plasma sheath is formed in the transverse magnetic field.Owing to the non-uniform plasma,the UHR layer near the rod antenna is narrow.Consequently,the absorption of X-wave in the thin UHR layer with a low density is so weak that one should seek a new approach of wave absorption in the high plasma density regime.
In the images shown in figures 5 and 6, all the brightest regions are always very close to the rod antenna, indicating that there exist ionization (excitation) layers.In fact, the plasma surrounding the rod antenna is confined by the parallel magnetic field whose force lines intercept almost vertically with the extraction grid(see figures 9 and 10).Consequently,the mobile electrons form conducting channels connecting the extraction grid.In this situation,electric field lines originating from the rod antenna’s cylindrical surface no longer terminate at the side wall as in vacuum case(see figure 9),but first pass through the narrow plasma sheath,and immediately deflect to the extraction grid along the conducting plasma channels surrounding the antenna.In the plasma channels where electric field lines are parallel with magnetic field ones, the electromagnetic wave propagates in the form of ordinary (O)wave.As stated above, the microwave power cannot be effectively absorbed in the UHR layer, so that the O-wave in the conducting plasma channels surrounding the rod antenna(see figure 10(a))makes the dominant contribution to electron heating.
Like the early phase of gas breakdown when the seeding electron is rarefied,in low plasma-density discharges,O-wave electron heating around the rod antenna is also weak.After the ECR gas breakdown, the plasma density reaches a high level.Taking the 0.15 sccm discharge as an example,the gas breakdown occurs at aPwof 19.64 W, which is already beyond the highPwregion in figure 3.In experiments shown in figure 3,Pwwas reduced from the high value after the gas breakdown to the low one for ion extraction.
As the electron density around the rod antenna increases to the critical value satisfying the equation of ofωpe=ω(hereωpeandωare electron plasma frequency and angular microwave frequency, respectively), the electron plasma resonance (EPR) layer appears in the conducting plasma channel where the local microwave electric field is maximized, and thus the electron heating is simultaneously enhanced [36].When the bulk plasma is in the overdense regime ofωpe>ω,the EPR layer will always occur around the rod antenna, sustaining the plasma production therein.Owing to the strong absorption at the EPR layer, the wave penetrating the EPR layer is evanescent, so that electron heating in the ECR layer is not the dominant one.
It is worth noting again that, as evidenced by the central dark regions of all the images in figure 5,the EPR layer does not appear in the short gap between the front end of the rod antenna and the screen grid.
3.5.4.Significant features of ion extraction.As aforementioned, plasma dynamics in ECR discharge is rather complicated, therefore the discussion below is focused the significant features of ion extraction.
3.5.4.1.The high slope in curve of Ibversus Pwin the low power regime.Ion beam current is involved with ion production, ion transportation and ion extraction.The effects of the above processes onIbare analyzed in the followings.
In the lowPwregime, the bright regions appear close to the rod antenna (see figures 5 and 6), indicating that all discharges are sustained by EPR electron heating.Consequently,the efficiency of ion production in the lowPwregime changes slightly.The ion transport to the screen grid in the lowPwregime is efficient, the reasons for which are as follows:(1)the plasma produced in the EPR layer around the rod antenna is magnetically confined and driven by the gradient force of the divergent magnetic field, facilitating the fast transport toward the extraction grid;(2)all magnetic field lines, in both the EPR layer and the adjacent region filled by the plasma transported across the magnetic field lines,intercept with the extraction grid (see figure 10(a)).As a result,almost all ions produced in the upstream can reach the screen grid.
From the principle of ion extraction optics, one knows that not all ions arriving at the screen grid can be extracted out of the acceleration grid due to insufficient or the excessive ion focusing.In the low plasma density (lowPw) regime, the crossover ion impingement occurs.With increasingPwin the low plasma density regime, the percentage of ions that can pass through the acceleration grid increases.From the above discussion, one knows that, in case that the efficiencies of both ion production and ion transport do not change much,the decreasing crossover ion impingement due to the increasing plasma density with the increasingPwwill lead to the rapid rise ofIb.This deduction is also supported by the fact that the intersecting points of allIb−Pwcurves in the lowPwregime(see figure 3)are at almost an equalIb.This result is reasonable because the ion current limit of the crossover ion impingement is equal for a same extraction grid, and should be independent off plasma production at different gas flow rates (gas pressures).In addition, the shift of the intersecting point to the lowerPwwith the increasing gas flow rate (see figure 3)is also reasonable simply due to the increased plasma density at a higher gas flow rate (gas pressure).
3.5.4.2.Sudden drop of Ib.When a low power is injected into the small region surrounding the rod antenna, the discharge can be operated in the overdense regime ofωpe>ω.As stated above, the discharge in this regime is characterized by the bright layer surrounding the rod antenna.The presence of the bright layer at all conditions indicates that the EPR electron heating contributes to all discharges.The arising question is that whether the ECR electron heating can coexist with the EPR one in thePwregime.The answer is that ECR electron heating does not exist in thePwregime before the drop ofIb,but occurs to induce the sudden drop ofIb,the involved processes in which are presented below.
Although the gas breakdown is initiated at the ECR layer when the density of seed electrons is very low, the ECR electron heating does not always outmatch the EPR one as electron density is increased.In the lowPwregime, as the microwave discharge is strongly confined around the rodantenna, the electric field is already intensified in the EPR layer.In contrast,the electric field at the large radius is much low due to the strong wave absorption at the EPR layer, so that the ECR electron heating is weak.
AsPwincreases,the variations that facilitate the ignition in the ECR layer occur in three aspects.Firstly, the electric field in the ECR layer rises simply due to the increase ofPw.Secondly,the seed electron density in the ECR layer increases as a result of plasma transport across magnetic field lines.Thirdly, the EPR layer shifts upstream as the conducting plasma channels become longer at higherPw,because plasma transport along the magnetic field lines is much fast than that across field lines.Since the EPR layer is a special location where the microwave is absorbed, cut-off and reflected, the microwave cannot propagate deep into the bulk plasma in the downstream, leading to the so-called skin effect (see figure 10(b)).The microwave reflected back to the upstream region enhances the electric field in the ECR layer.
Owing to the above three variations,the discharge can be ignited in the ECR layer.Despite that the exact prediction of the ignition location relies on the strict dynamic modeling of ECR plasma,but it is near the ECR zone of the highestE⊥in the vacuum case(see figures 9 and 10(b)).The magnetic field lines threading the ECR ignition region intercept the front plate (FP in figure 10(b)) mounted at the side wall in the downstream region.Consequently, many of the ions (electrons) produced in the ECR zone will move downstream along the diverging magnetic field lines,and are finally lost at the front plate, making no contribution toIb.After the ECR discharge is ignited, a partition of the injected microwave power is dissipated in the ECR layer, while that in the EPR layer accordingly decreases.Since ions produced in the ECR layer are less efficient for ion extraction,so that the rise ofPwleads to the drop ofIb.In contrast,when more electrons(ions)are transported to the front plate after the drop ofIb, the intensity of optical emission increases at the boundary region,forming a bright annulus in the differentiated image shown as figure 7(g).
As the Xe gas flow rate(gas pressure)increases to above 0.2 sccm,two counteracting variations are:(1)the rise in gas pressure reduces the electric field required by the ECR ignition (named as the first effect); (2) the absorption of microwave wave in the EPR layer is increased while the reflected microwave is decreased (named as the second effect).This counteraction is involved in complicated kinetic processes, so that the prediction of the critical power for the ECR ignition is not simple.Comparing the critical powers at the sudden drop ofIbfor 0.15 and 0.2 sccm(see figure 3),one knows that the first effect dominates over the second one in this gas flow rate regime.
As the Xe gas flow rate(gas pressure)further increases to or above 0.25 sccm, the sudden drop ofIbdisappears.There are two possibilities for this:in one case,the above first effect still dominates the second one, but the ECR electron heating takes its role at an even lowerPwin a continuously manner;in the other case, the second effect surpasses the first one, and the ignition at the ECR layer does not take place.We believe that the second case is more plausible because if ECR ignitions occur at even lowerPwfor 0.25 sccm and above,they will also lead to the remarkable reduction ofIbas in the cases of lower gas flow rates.
From the above,one can conclude that the ECR electron heating is much more efficient in the gas breakdown where electron density is very low, but is later outmatched by the EPR one in the overdense plasma ofωpe>ω.In the low gas flow rate regime, the ECR electron heating can coexist with the EPR one,igniting its discharge and leading to the sudden drop ofIb.In the high gas flow rate regime, the weak ECR electron heating is unable to ignite its discharge.
3.5.5.Abnormal high slope in curves of Ibversus Pwat high gas flow rate and discharge power.In figure 10, the cyancoloured magnetic field lines are those that just intersect the corner between the screen grid and the front plate.In the three-dimensional space,these lines form a separatrix surface,beyond which ions (electrons) will lose at the side wall and make no contribution to ion extraction.For sake of concise statement, the regions inside and outside of the cyan colour lines are named as confinement and lose ones, respectively.The confinement region takes the shape of hourglass characterized by two wide ends and a narrow waist.
In explaining the high slope of theIb−Pwcurve in the lowPwregime,ion production and transportation in the wide confinement region are regarded as the underlying reasons.As the ECR discharge (together with the EPR one in the low gas flow rate regime) is ignited at the narrow waist of the hourglass-shaped confinement region,the transport efficiency of the produced ions to the screen grid is reduced due to the high ion loss along magnetic field lines that intercept with the front plate,leading to a low increasing-rate ofIbwith respect toPwbeyond the lowPwregime.
If plasmas can be produced at the upstream wide-end of the hourglass-shaped confinement region, the transport efficiency of ions to the screen grid will be elevated again because more ions are confined in magnetic field lines intersecting with the screen grid (see figure 10(c)).In discharges at the high gas flow rates (0.3 and 0.35 sccm),the evolutions ofIbwithPwseem to undergo through all the above transitions.The arising question is why only the discharges at the high gas flow rates can be produced at the upstream wide-end of the hourglass-shaped magnetic field.
As already discussed, with increasing thePw, the discharges are sustained by electron heating in EPR layer that moves upstream along the rod antenna.In low gas flow rate regime, the produced plasma is characterized by low electron density and high electron temperature.Both of them slow down the upstream shifting of the EPR layer.The reason for this is that,in the case of magnetic confinement,the large electron’s Larmor radius and the high electron-neutral collision frequency at the high electron temperature are factors promoting electron transport across magnetic field lines[37].When ions gain more energy in collision with hightemperature electrons, ion transport across magnetic field is also raised.Therefore,the percentage of ions entering the loss region increases, and the formation of an EPR layer close to the rod antenna requires a higherPw.In discharges at the gas flow rates below 0.25 sccm, the EPR layer can only shift upstream to the waist of the confinement region (see figure 10(b)) in thePwregion of figure 3.
In the high gas flow rate regime, electron density and electron temperature become higher and lower, respectively.The produced plasma tends to build up around the rod antenna as a result of the reduced transport across magnetic field lines, facilitating the upstream shift of the EPR layer.In this way,the EPR layers in the discharges at the high gas flow rates can move to the upstream wide-end of the confinement region (see figure 10(c)), so that ions produced therein are efficiently transported to the screen grid along the magnetic field lines.Consequently,ion beam currents from the high-Pwdischarges at high gas flow rates increase abnormally at a higher rate with the increasingPw(see figure 3).Moreover,the difference between the two critical powers for the second high-slope regions in 0.3 and 0.35 sccm discharges is consistent with what discussed above: a highPwis required for the EPR layer in the discharge at the lower gas flow rate to enter the upstream wide-end of the confinement region (see figure 10(c)).
3.5.6.Comparison with ion beam current of 1.6 GHz cross magnetic field ECR ion thruster.On the cross magnetic field ECR ion thruster optimized at 1.6 GHz [14], ion beam currents at the gas flow rates are saturated in the high-Pwdischarges(see figure 4(a)in[14]).The highestIbachieved at thePwof 8.0 W is about 15.2 mA (see figure 5 in [14]).On our cross magnetic field ECR ion thruster optimized at 2.45 GHz,Ibat equalPwstill rises with the increasing gas flow rate up to 0.35 sccm(see figure 3).Since our highestPwin the 0.35 sccm discharge is lower than 8.0 W,Ibis linearlyextrapolated to 8.0 W.The obtained 18.0 mA is 18.4%higher than the counterpart of the 1.6 GHz ion thruster.Considering thatIbis rising rapidly with the increasing gas flow rate (see figure 3), one might expect an even higherIbat 8.0 W.
For 2 cm ECR ion thruster applied to microsatellites, the comparison between ion beam currents at lowPwand gas flow rate is practical.In the 2.0 W discharge at the gas glow rate of 15 μg s−1(about 0.15 sccm), the obtainedIbfrom 1.6 GHz ion thruster is 4.5 mA(see figure 4(a)in[14]),while the counterpart from 2.45 GHz ion thruster is 11.0 mA (see figure 3).The increment inIbby 144.3% is comparatively much higher.
Both 1.6 and 2.45 GHz ion thrusters have the cross magnetic field,but the behavior difference between the two is large.In the 1.6 GHz ECR ion thruster with a relatively lower magnetic field, the transverse plasma-confinement was accordingly weaker.This is one of reasons for the smaller ion beam currents at low and high gas flow rates.Another reason lies in the configuration of the confinement region.In the 1.6 GHz ion thruster with a donut (annular in this paper)magnet of a smaller diameter (see figure 1 in [14]), the magnetic field lines are over concentrated and diverged in the upstream and downstream regions, respectively, both leading to the reduction of the corresponding confinement regions.In the low gas flow rate region,the percentage of ions produced in the downstream over-divergent magnetic field is higher,and the obtainedIbis lower.In the high-Pwdischarges at large gas flow rates, more of ions produced in the EPR layer in the upstream narrow confinement-region will be transported to the side wall,and thus the obtainedIbis saturated at a lower level.In comparison, our 2.45 GHz ion thruster is advantageous in terms of efficient ion extraction due to enlarged plasma confinement regions.
4.Conclusion
In a 2 cm 2.45 GHz microwave ECR ion thruster driven with rod antenna under cross magnetic field, ion beam current exhibits abnormal behaviors such as sudden drop and high increasing-rate with respect to discharge power at low and high gas flow rates, respectively.The proposed differential method is successful in revealing the variation in the radial profile of the gray values extracted from the discharge images during the sudden drop of ion beam current.The optimized 2.45 GHz cross magnetic field configuration, which has relatively wider confinement regions at the downstream and upstream of the chamber, is advantageous over the existing 1.6 GHz one in term of ion magnetic confinement.Ion beam current from 2.45 GHz ion thruster is higher at equal discharge power.The evolution of ion beam current with discharge power is correlated with the upstream shifting of electron-plasma-resonance layer through different segments of the hourglass-shaped confinement region.The sudden drop of ion beam current takes place as a result of the discharge ignited by the enhanced extraordinary wave in the ECR layer where the confinement region is narrowest.
Acknowledgments
This work was partially supported by National Natural Science Foundation of China (No.11975070) and Open Funds for Science and Technology on Vacuum Technology and Physics Laboratory, Lanzhou Institute of Physics (No.zwk1609).
猜你喜欢
天中学刊(2022年4期)2022-11-08
学与玩(2022年2期)2022-05-03
北京大学学报(自然科学版)(2022年1期)2022-02-21
当代陕西(2021年16期)2021-11-02
疯狂英语·新阅版(2021年6期)2021-07-19
幸福·婚姻版(2019年8期)2019-10-30
商情(2017年26期)2017-07-28
高中生学习·高二版(2016年9期)2016-05-14
故事会(2010年20期)2010-10-11
故事会(2007年12期)2007-05-14
 Plasma Science and Technology2021年8期
- Plasma Science and Technology的其它文章
- Two-point model analysis of SOL plasma in EAST
- Line identification of boron and nitrogen emissions in extreme- and vacuumultraviolet wavelength ranges in the impurity powder dropping experiments of the Large Helical Device and its application to spectroscopic diagnostics
- Landau damping of twisted waves in Cairns distribution with anisotropic temperature
- Effects of magnetic field on electron power absorption in helicon fluid simulation
- Dependence of plasma structure and propagation on microwave amplitude and frequency during breakdown of atmospheric pressure air
- Machine learning application to predict the electron temperature on the J-TEXT tokamak