
Numerical investigation of radio-frequency negative hydrogen ion sources by a three-dimensional fluid model∗
2021-09-28 02:18YingJieWang王英杰JiaWeiHuang黄佳伟QuanZhiZhang张权治YuRuZhang张钰如FeiGao高飞andYouNianWang王友年
Chinese Physics B 2021年9期
Ying-Jie Wang(王英杰),Jia-Wei Huang(黄佳伟),Quan-Zhi Zhang(张权治),Yu-Ru Zhang(张钰如),Fei Gao(高飞),and You-Nian Wang(王友年)
Key Laboratory of Materials Modification by Laser,Ion,and Electron Beams(Ministry of Education),School of Physics,Dalian University of Technology,Dalian 116024,China
Keywords:negative hydrogen ion source,inductively coupled plasma,three-dimensional fluid model,magnetic field effect
1.Introduction
Besides industrial applications,[1]radio-frequency(RF)inductively coupled plasmas(ICPs)are also extensively used for neutral beam injection(NBI)systems developed towards fusion applications.[2–4]Since the neutralization efficiency of negative hydrogen ions is much higher than positive ions,it is of utmost importance to investigate RF negative hydrogen ion sources(NHIS),which satisfy the high-power and long pulse requirements of the future fusion devices.[5,6]The objective of the NBI prototype for China Fusion Engineering Test Reactor(CFETR)is the generation of a negative hydrogen ion beam for 400 keV of 3600 s with neutralization efficiency higher than 50%.[7,8]
In the NHIS,magnetic filter field is usually applied to the extraction region to reduce the electron temperature,because negative ions are formed by the attachment of lowenergy electrons on vibrationally excited hydrogen molecules.Therefore,many researchers have done a lot of work on low pressure RF inductively coupled NHIS with magnetic field.Boeuf et al.used a two-dimensional(2D)fluid model to study the discharge characteristics,such as the spatial profiles of the charged species densities and the electron temperature,in an inductively coupled negative ion source.By comparing the electron temperature in cases with and without magnetic field,[9,10]they found that the introduction of the magnetic field decreased the electron density and the electron temperature in the expansion region.Furthermore,the position of the magnetic field filter in NHIS has also been proved to affect the plasma characteristics.As the magnetic filter moved towards the driver region,the penetration of the magnetic field into the driver region enhanced,leading to the significant plasma asymmetry.[11–14]Indeed,the homogeneity of the plasma parameters is very important,which determines the perveance and divergence of ion beam at each aperture of the extraction system.For those apertures with large angle of divergence of ion beam,the local breakdown happens,which affects the performance of NHIS.[15]Therefore,a three-dimensional(3D)model is necessary to investigate the asymmetry of twochamber hydrogen discharges with external magnetic field.
Indeed,numerical simulation is an effective tool for exploring the generation and transport of plasmas in NHIS.However,in most of the models mentioned above,there exist some problems.For instance,the 3D simulation of the whole NHIS is barely reported.Besides,the stochastic electron heating played a dominant role in inductively coupled discharges when the pressure was equal to or lower than 1.33 Pa.[16]Recently,Gao et al.showed that the elastic collision frequency was lower than the stochastic collision frequency for pressures lower than 0.3 Pa,and they concluded that the stochastic heating should be taken into account when pressure was equal to or lower than 1.0 Pa.[17]Indeed,nonlocal electron kinetics induces different distributions of the plasma density at low pressures.[18]Since RF NHIS works at ultra-high power and low pressure,i.e.,below 1 Pa,the general drift-diffusion approximation of ions is no longer applicable.Especially,the ion drift velocity is much higher than the ion thermal velocity under this condition.[19]Therefore,the electron effective collision frequency and ion mobility at high E-field should be taken into account to explore the physical properties of NHIS accurately.
In this work,a 3D fluid model is developed within COMSOL MULTIPHYSICS,with electron effective collision frequency and ion mobility at high E-field taken into account,to investigate the properties of NHIS for various discharge parameters.This paper is organized as follows.A detailed description of the 3D fluid model is given in Section 2.In Section 3,we investigate the variations of the magnetic fields,pressures and powers on the plasma parameters.Finally,a brief summary is given in Section 4.
2.Model description
The 3D fluid model is introduced in this section,together with the boundary conditions.Figure 1(a)exhibits the schematic diagram of an RF negative ion source,which consists of a cylindrical driver region and a rectangular diffusion region.The diameter of the driver region is 28 cm and the height is 14 cm.The 5 turns RF copper wire coil,which wounds around the tube,has a diameter of 1 cm.In order to avoid the anomalous skin effect at low pressure and high frequency,the discharge is driven by a 2-MHz RF source.[20–22]The expansion region is a cuboid,and the length,width and height are 60 cm,50 cm,and 25 cm,respectively.The permanent magnets are arranged in a row along the x axis at the bottom of the expansion region,as shown in Fig.1(a).Figure 1(b)shows the xz-plane at y=25 cm.The red lines a and b represent the source centerline(i.e.,x=30 cm and y=25 cm)and the transverse line at the bottom(i.e.,z=24 cm and y=25 cm),respectively.
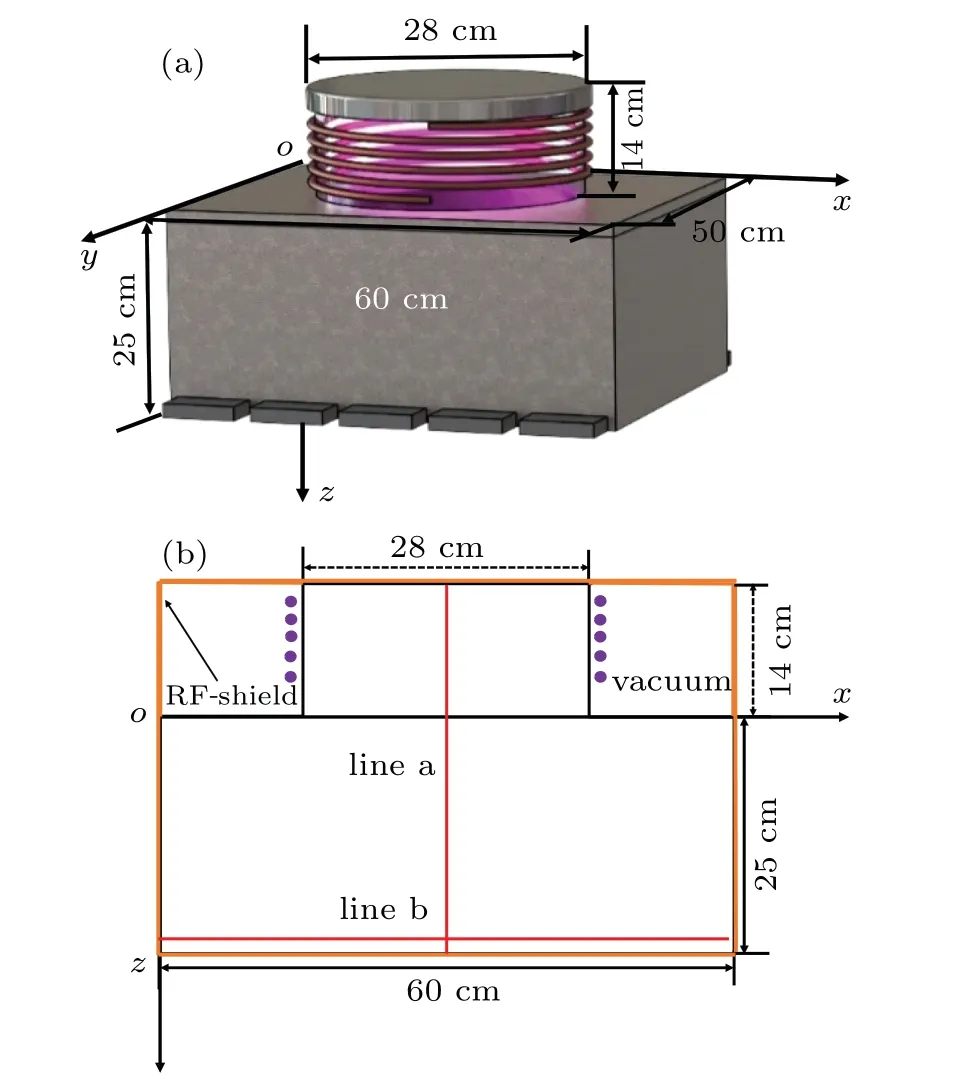
Fig.1.Schematic diagram of the NHIS(a),and the xz-plane at y=25 cm(b).
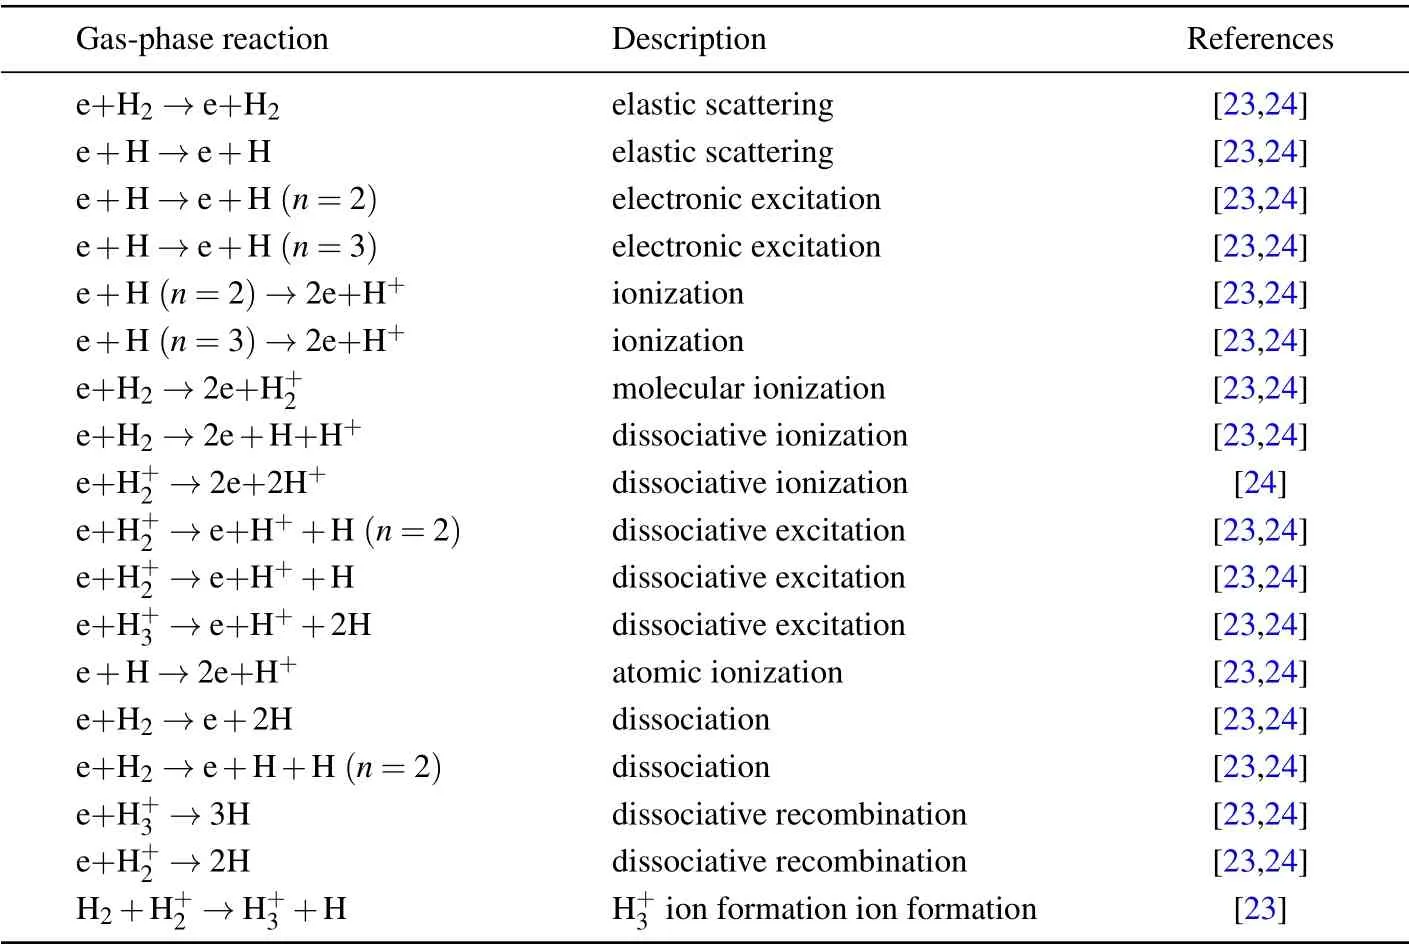
Table 1.Gas phase reactions considered in this work.
The simulations are performed in H2discharges,with 8 different species taken into account,i.e.,electrons,H+,H+2,and H+3ions,ground-state H2molecules and H atoms,as well as excited-state H(n=2)and H(n=3)atoms.The gas phase reactions considered in the model are listed in Table 1,which includes elastic collision,excitation,ionization,dissociation,recombination,and so on.
2.1.Fluid model
The fluid model including continuity equations calculates the densities for various species,and the drift-diffusion approximation equations get the electron and ion fluxes.Besides,only the energy balance equation for electrons is included,because the temperatures for ions and neutral particles are fixed at 600 K.[12]
The electron behavior is described by the continuity equation
the drift-diffusion approximation equation

and the energy balance equation
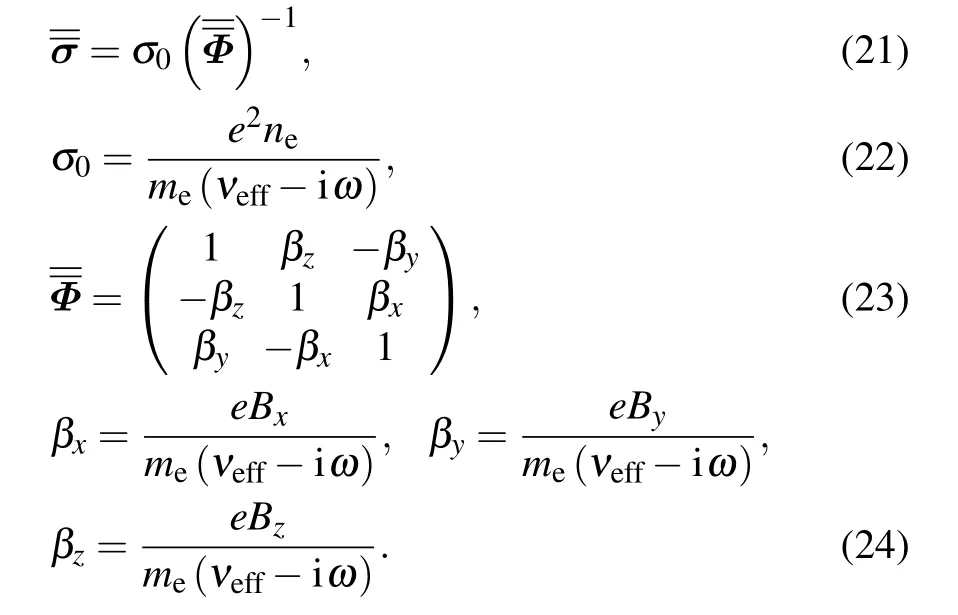
The flux of energy Qeis given by
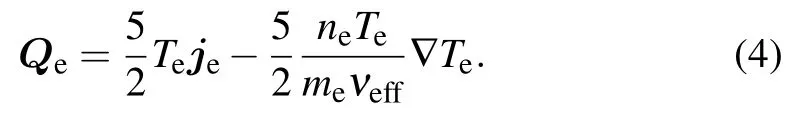

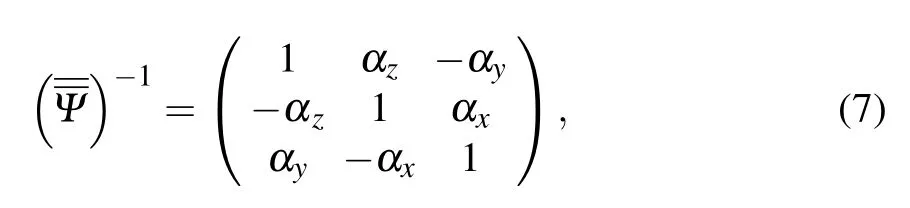
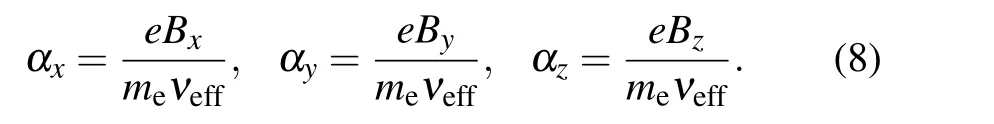
Bx,By,and Bzare the external magnetic field in x,y,and z directions,µe0and De0are the electron mobility and diffusion coefficient without external magnetic field,
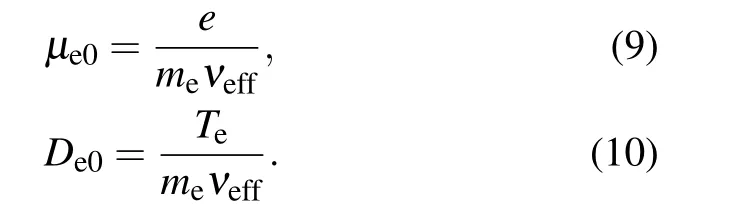
Here,meis the electron mass,e is the elementary charge.νeff=νm+νstocis the effective collision frequency,and the elastic collision frequencyνmand stochastic collision frequencyνstocare expressed as[19,25]

Here,kelis the rate coefficient of elastic collision and Nnis the density of H2molecules.δeffis the effective skin depth of the RF electromagnetic field
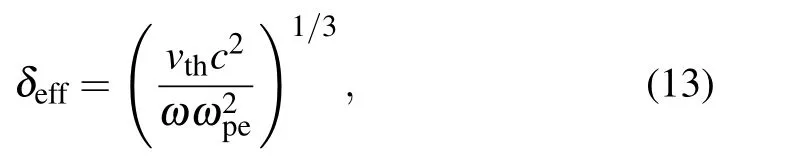
vthand c are the electron thermal velocity and the speed of light,ωandωpeare the RF angular frequency and the electron plasma frequency.
The behaviors of heavy species,i.e.,ions and neutral species,are described by continuity equations
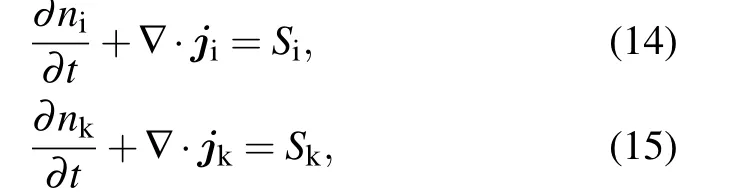
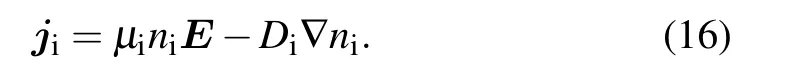
where niis the ion density,and Siis the ion source term.The ion flux jiis expressed as
In the high E-field case,the expression of ion mobility is[26]
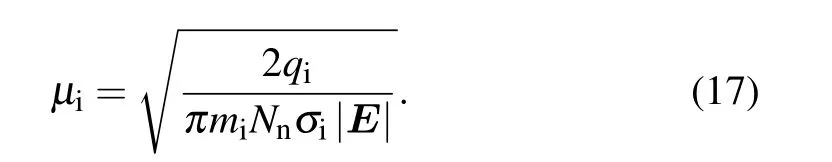
Here,miis the ion mass,σiis the cross section characterizing the ion–neutral particles interaction,qiis the ion charge,and Diis the ion diffusion coefficient.
For neutral particles,the flux jkis
where nkand Dkare the density and diffusion coefficient for neutrals.
The electrostatic field is described by Poisson’s equation
whereε0is the vacuum permittivity andφis the electric potential.Besides,the electrostatic field can be given E=−∇φ.
2.2.Electromagnetic model
In the electromagnetic model,the magnetic vector potential A is calculated in the frequency domain instead of solving the Maxwell equations directly

As mentioned above,the power absorption density Ptotis described as

2.3.Magnetostatics model
In the magnetostatics model,the magnetic field intensity H is expressed by magnetic scalar potential
The relationship of magnetic scalar potential Vmand magnetization intensity M is

2.4.Boundary conditions
The boundary conditions of jeand Qeat all walls are as follows:

Here,Θis the reflection coefficient of electrons.[27]The boundary conditions of jiand jkat the walls are[12]
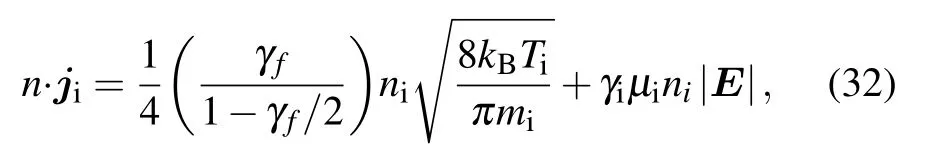

where Tiare Tkare the ion temperature and neutral particle temperature,kBis the Boltzmann constant,γfis the sticking coefficients of ions and neutral particles at the wall,and mkis neutral particle mass.Furthermore,the switching functionsγidepends on the product of n and E.[28]

In addition,the electric potential and the tangential component of the inductive electric field n×A equal zero at the walls.
3.Results and discussion
The model described in Section 2 is developed within COMSOL MULTIPHYSICS and three solvers are included.First,the Stationary solver is implemented to calculate the magnetostatic field;then,the Coil Geometry Analysis solver is applied to analyze the structure of the spiral coil;finally,the Frequency–Transient solver is used to solve the electromagnetic field and plasma properties.The numerical environment is based on the finite element method,which allows the use of mesh grids of triangle in boundaries and tetrahedron in volume.In the volume,the minimum element size of 0.1 cm is applied near the boundaries,and boundary layers are also adopted to get a dense mesh there.
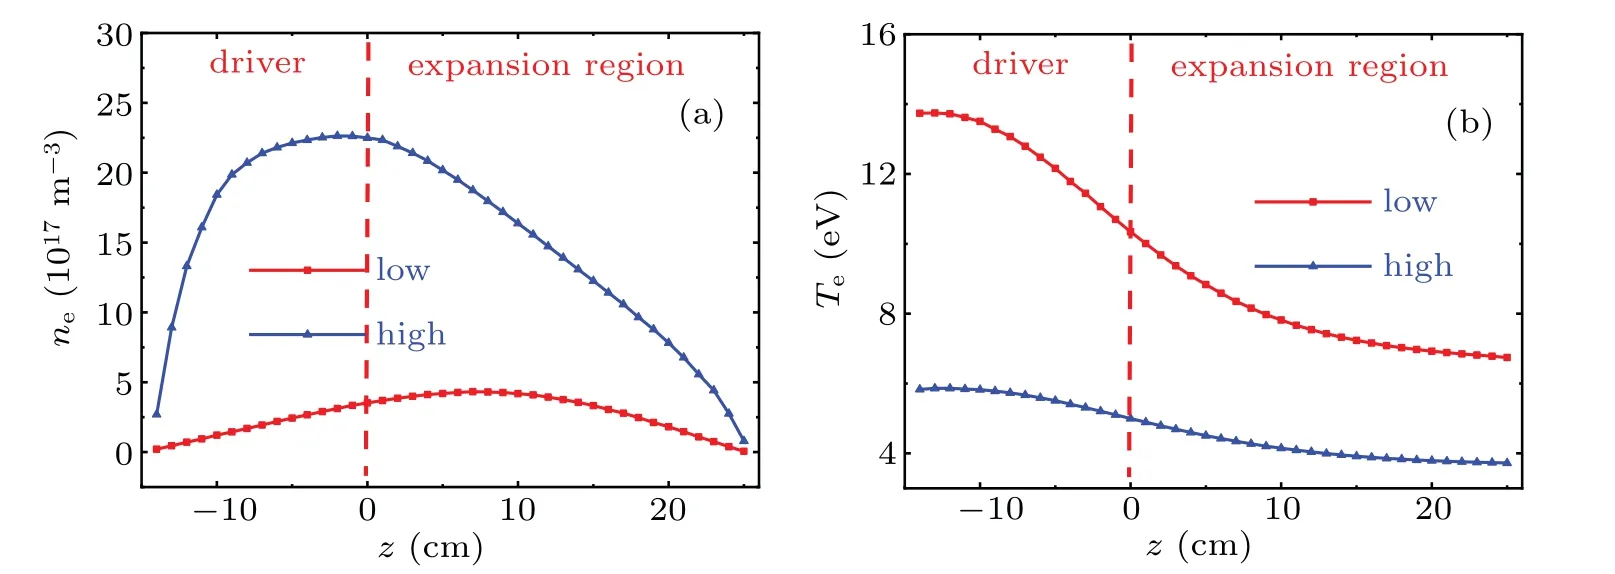
Fig.2.Axial distributions of the electron density(a)and electron temperature(b)at 40 kW,0.6 Pa,obtained by using the low E-field Langevin mobility(red lines)and high E-field ion mobility(blue lines).
3.1.Magnetic field effect
The influence of the remanent magnetization of permanent magnets(RMPM)is illustrated by comparing the spatial distributions of the magnetic field,electron density and electron temperature along the axial direction(line a in Fig.1(b))and transverse direction(line b in Fig.1(b))obtained at different magnetic field strengths,as shown in Fig.3.It is clear that the magnetic field almost increases monotonically along the axial direction(Fig.3(a)),and the transverse distribution exhibits a maximum in the center(Fig.3(b)).Besides,the magnitude declines with reduced RMPM,i.e.,the maximum varies from 70 Gs(1 Gs=10−4T)at RMPM of 21 kGs to 5 Gs at RMPM of 2 kGs.
In the case without magnetic field(i.e.,0 kGs),the electron density first increases and then decreases along the axial direction.When the magnetic field is applied,a similar axial distribution is observed,as shown in Fig.3(c),except that the value first increases and then decreases with magnetic field(i.e.,the electron density is the highest at RMPM of 6 kGs).Besides,the maximum of the electron density shifts slightly to the driver region at higher RMPM.From Fig.3(d),it is clear that the electron density at the bottom of the expansion region is the highest at RMPM of 2 kGs,and the maximum shifts to lower x direction when the magnetic field is applied.
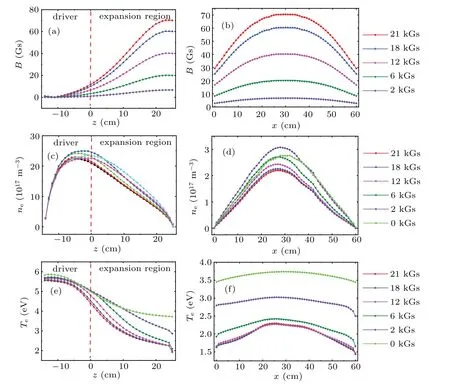
Fig.3.Axial distributions(first column)and transverse distributions of the magnetic field(first row),electron density(second row),and electron temperature(third row)for various RMPM at 0.6 Pa,40 kW.
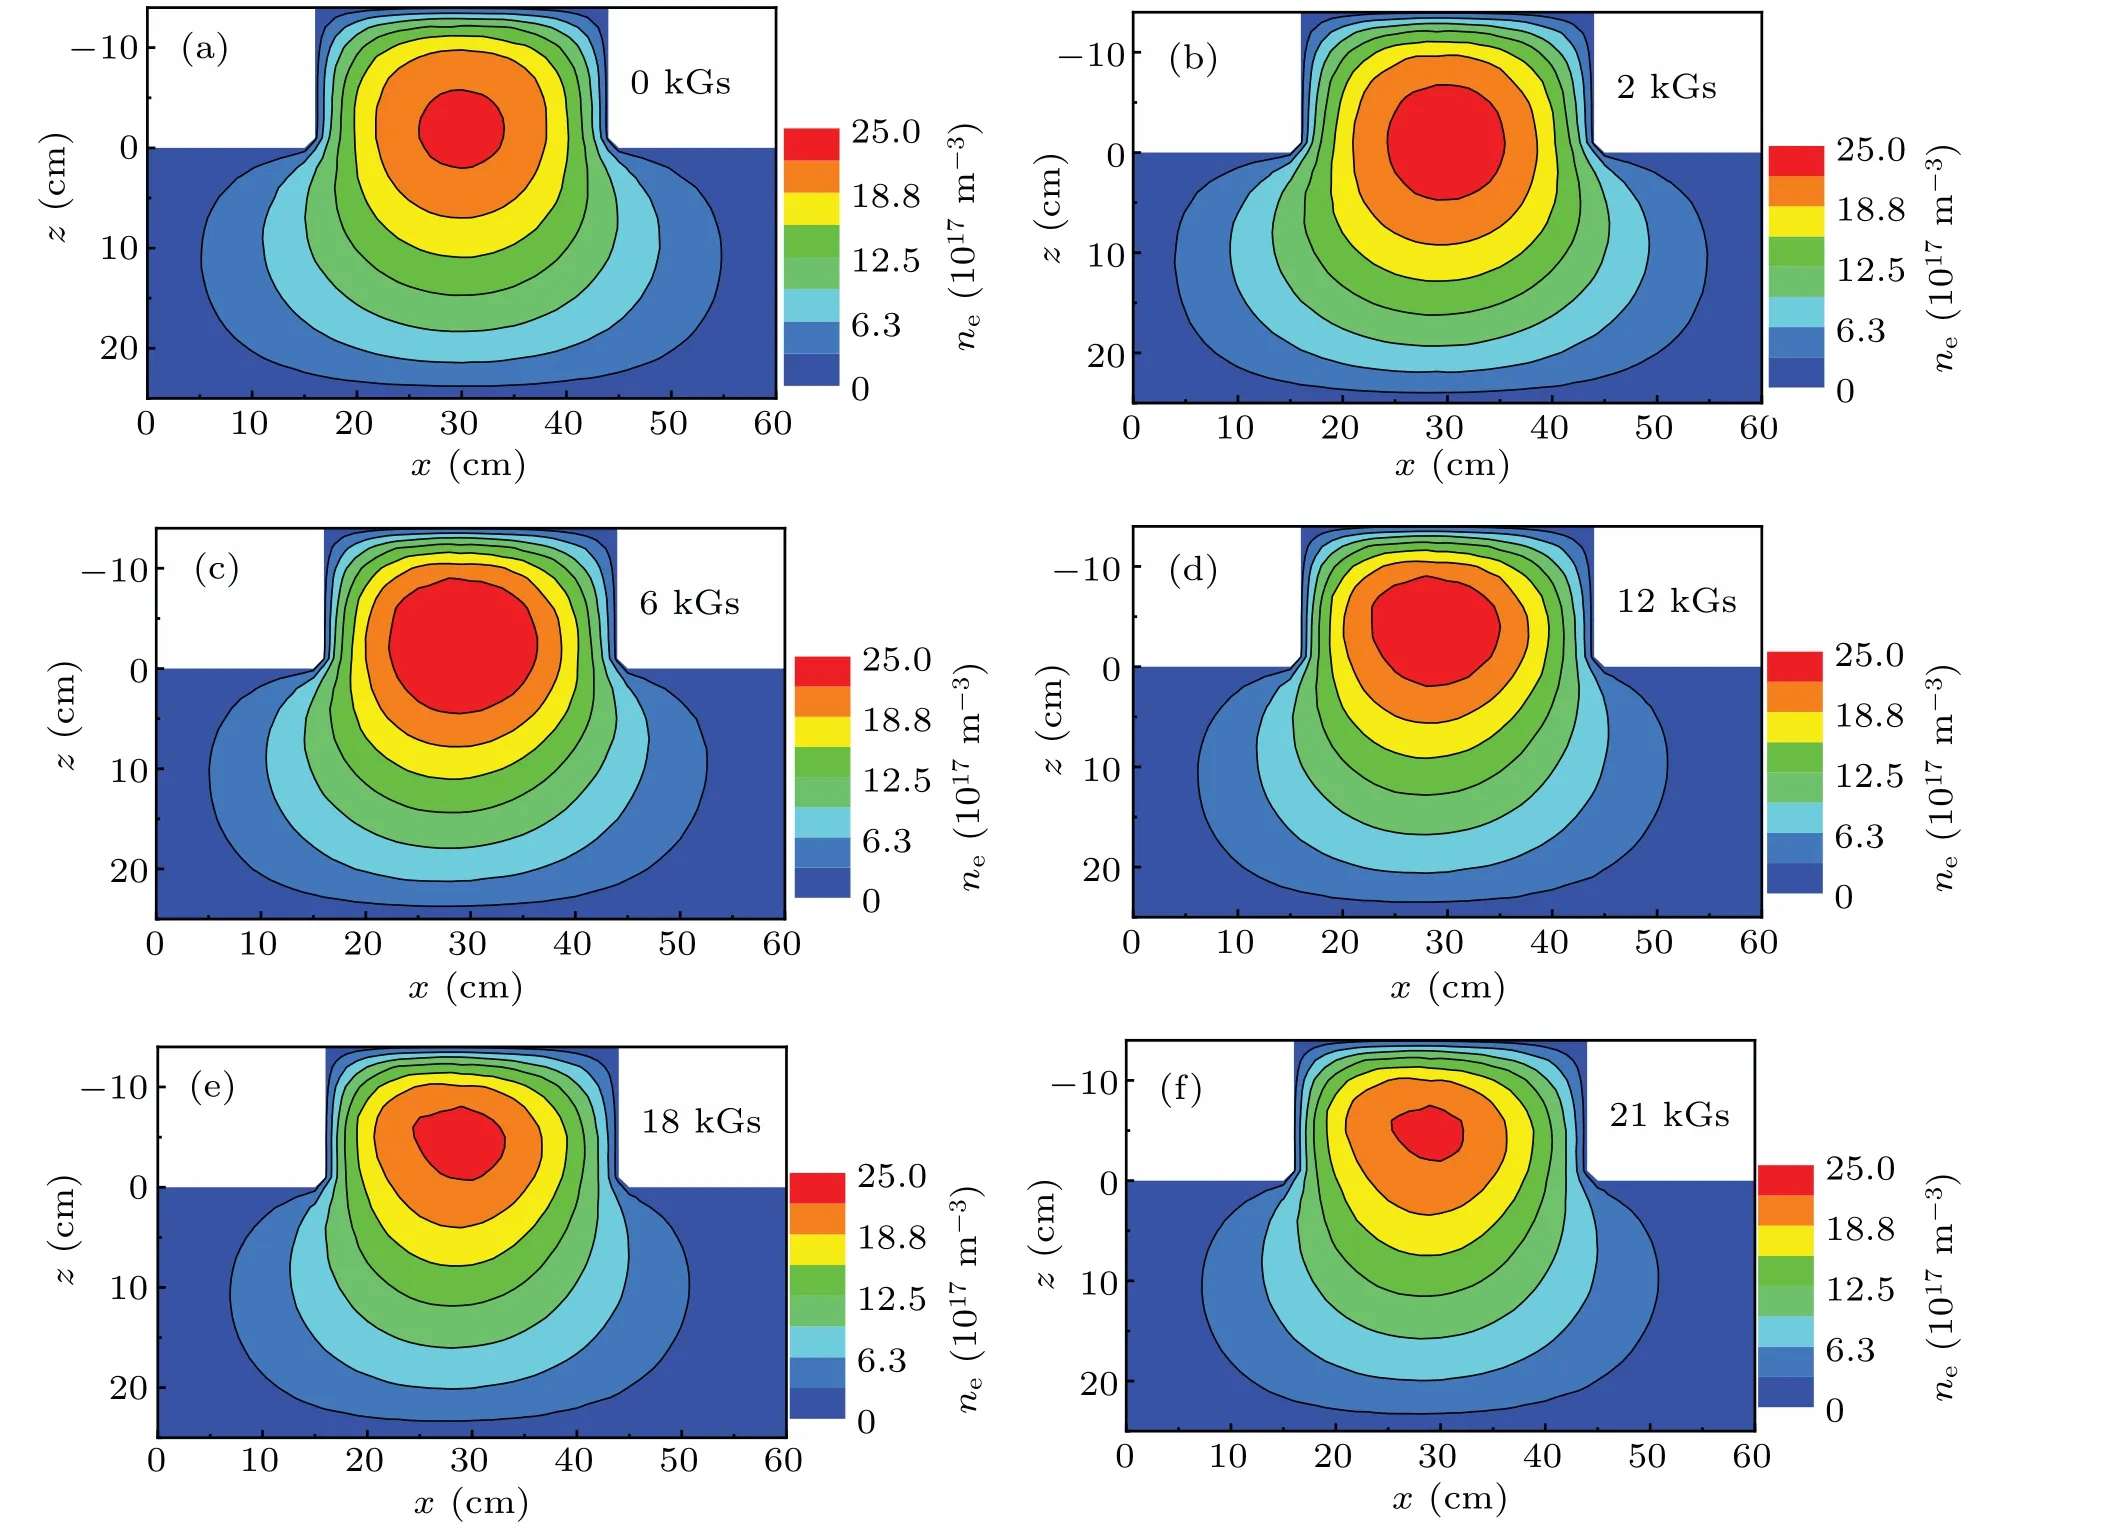
Fig.4.Spatial distributions of the electron density in the xz-plane for various RMPM:(a)RMPM=0 kGs,(b)RMPM=2 kGs,(c)RMPM=6 kGs,(d)RMPM=12 kGs,(e)RMPM=18 kGs,(f)RMPM=21 kGs,at 40 kW,0.6 Pa.
When the RMPM is less than 2 kGs,the electron temperature along the source centerline first rises slightly,and then it declines gradually from the driver region to the expansion region(see Fig.3(e)).However,the electron temperature decreases monotonically when the RMPM is higher than 6 kGs.Besides,when the magnetic field is introduced,the electron temperature in the driver region becomes lower,and the decline in the expansion region is more obvious.At the bottom of the expansion region,the electron temperature exhibits a parabolic profile.With the rise of the RMPM,the asymmetry of the electron temperature is enhanced,and the electrons are cooled effectively.For instance,the electron temperature decreases from about 3 eV–4 eV in the case without magnetic field to the expected value of about 1 eV–2 eV with the RMPM higher than 12 kGs.[30]
In order to illustrate the magnetic field effect on the plasma parameters in the 3D chamber clearly,the spatial distributions of the electron density and electron temperature are presented in the xz-plane(y=25 cm)and yz-plane(x=30 cm),respectively.First,figure 4 shows the spatial distribution of the electron density with different RMPM in the xzplane at 40 kW,0.6 Pa.As we mentioned above,the electron density first rises and then reduces with increased RMPM,and the maximum moves upwards simultaneously.For instance,when the RMPM is 6 kGs,the magnetic field is about 20 Gs at the bottom center of the expansion region,and the maximum electron density is the highest,meanwhile,the peak region is the largest.In addition,the asymmetry of the electron density becomes pronounced at higher RMPM,due to the deeper penetration of magnetic field.[12]
The spatial distributions of the electron temperature are presented in Fig.5.It is clear that the maximum of the electron temperature first decreases and then increases with RMPM,which is different from the trend of the electron density.Besides,the minimum of the electron temperature at the bottom of the expansion region reduces first and then almost keeps constant.In the absence of the external magnetic field,the electron temperature distribution in the xz-plane(y=25 cm)is symmetric(Fig.5(a)),and the asymmetry becomes more remarkable with the enhancement of the magnetic field.For instance,at RMPM of 21 kGs,the electron temperature at the left side of the driver region is higher,i.e.,up to 9 eV(Fig.5(f)),but it is only 7 eV at the right side wall.

Fig.5.Spatial distributions of the electron temperature in the xz-plane for various RMPM:(a)RMPM=0 kGs,(b)RMPM=2 kGs,(c)RMPM=6 kGs,(d)RMPM=12 kGs,(e)RMPM=18 kGs,(f)RMPM=21 kGs,at 40 kW,0.6 Pa.
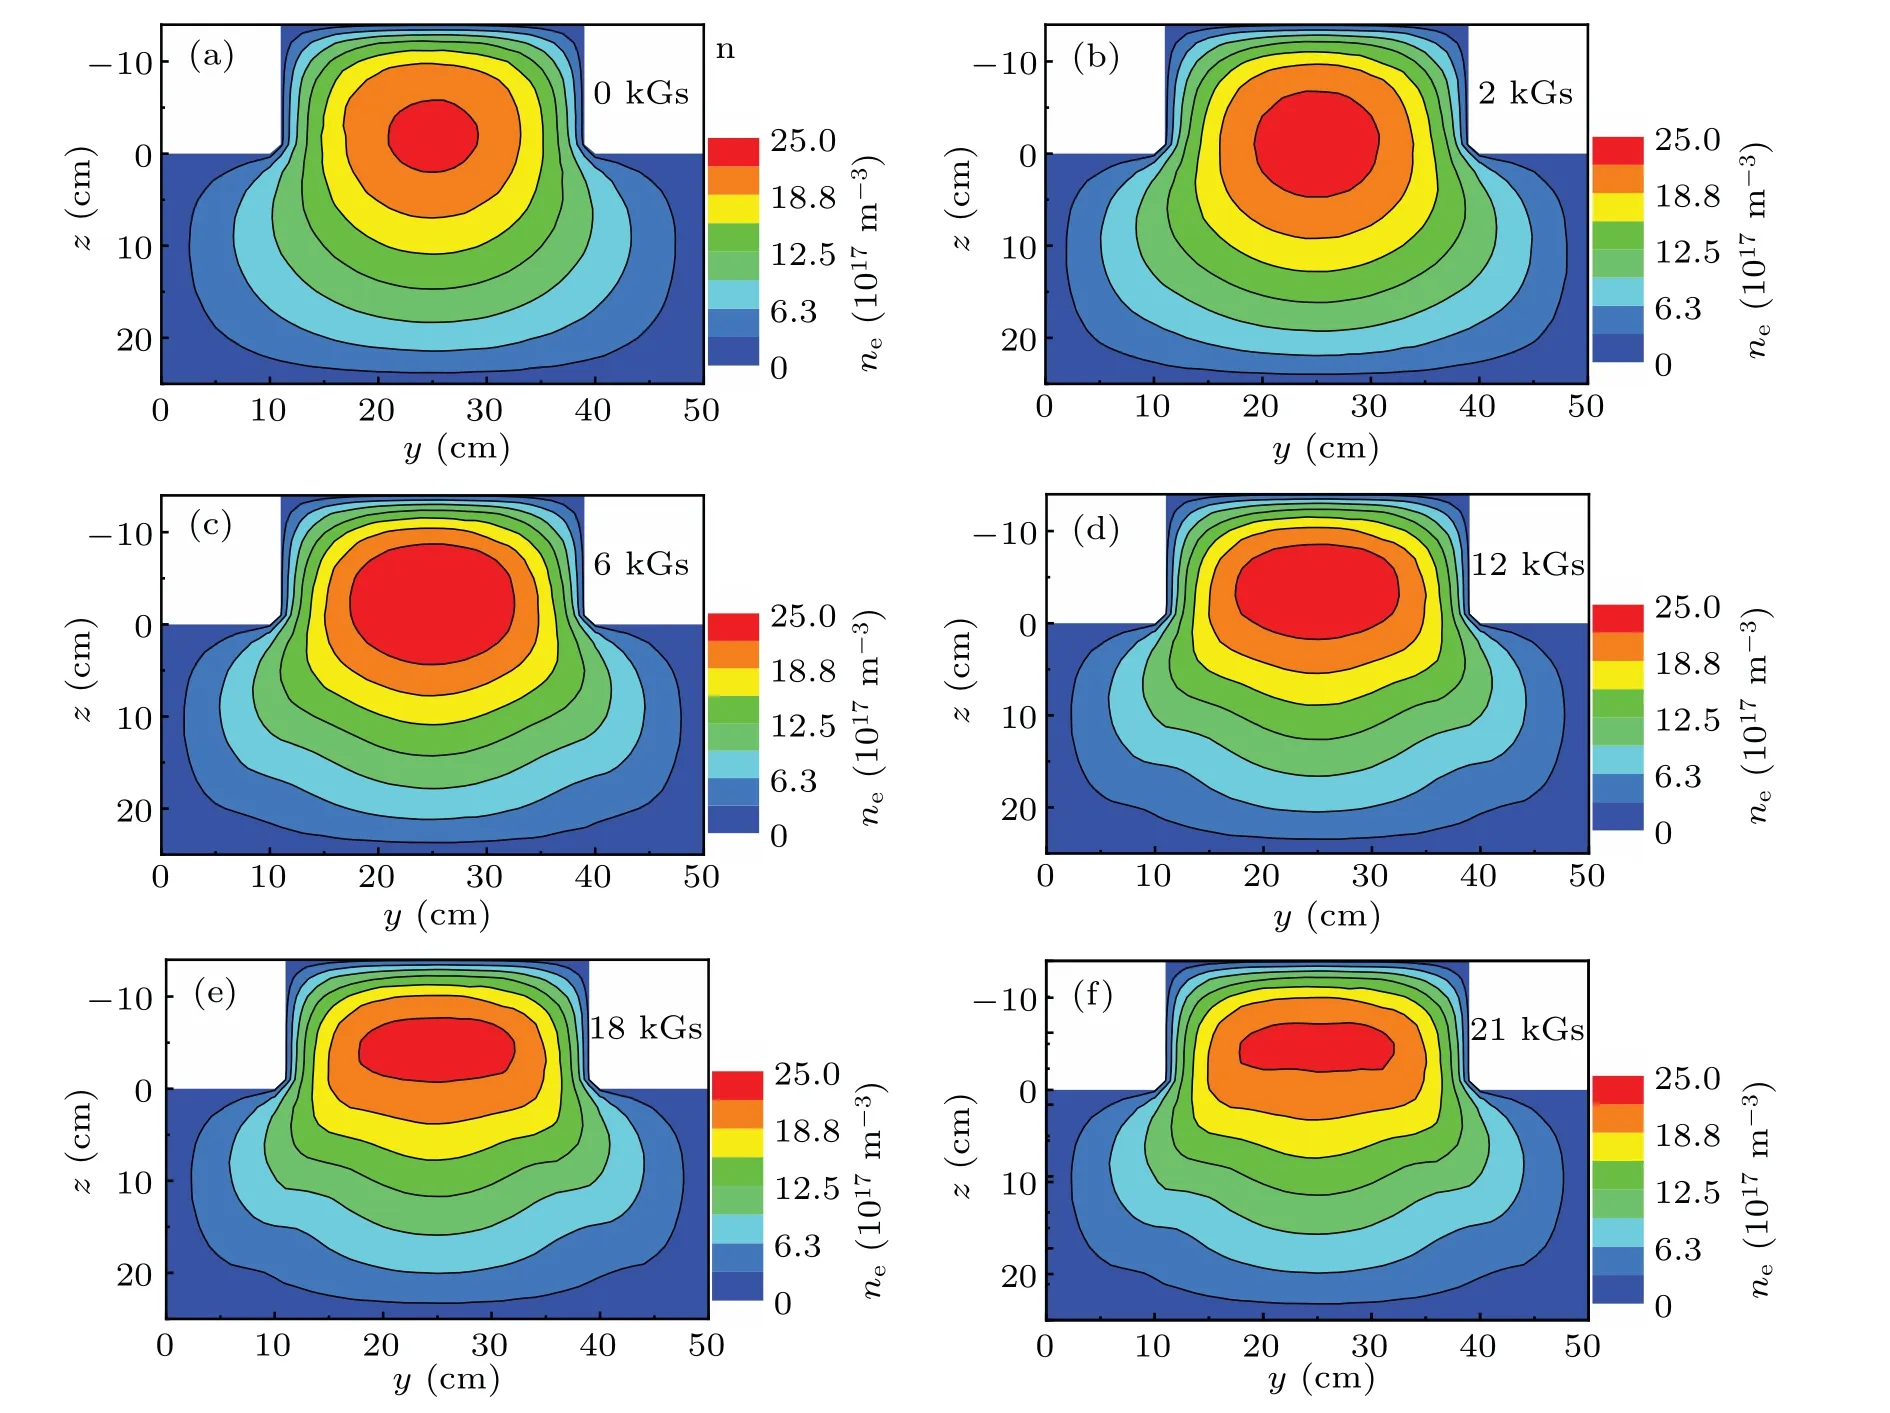
Fig.6.Spatial distributions of the electron density in the yz-plane for various RMPM:(a)RMPM=0 kGs,(b)RMPM=2 kGs,(c)RMPM=6 kGs,(d)RMPM=12 kGs,(e)RMPM=18 kGs,(f)RMPM=21 kGs,at 40 kW,0.6 Pa.
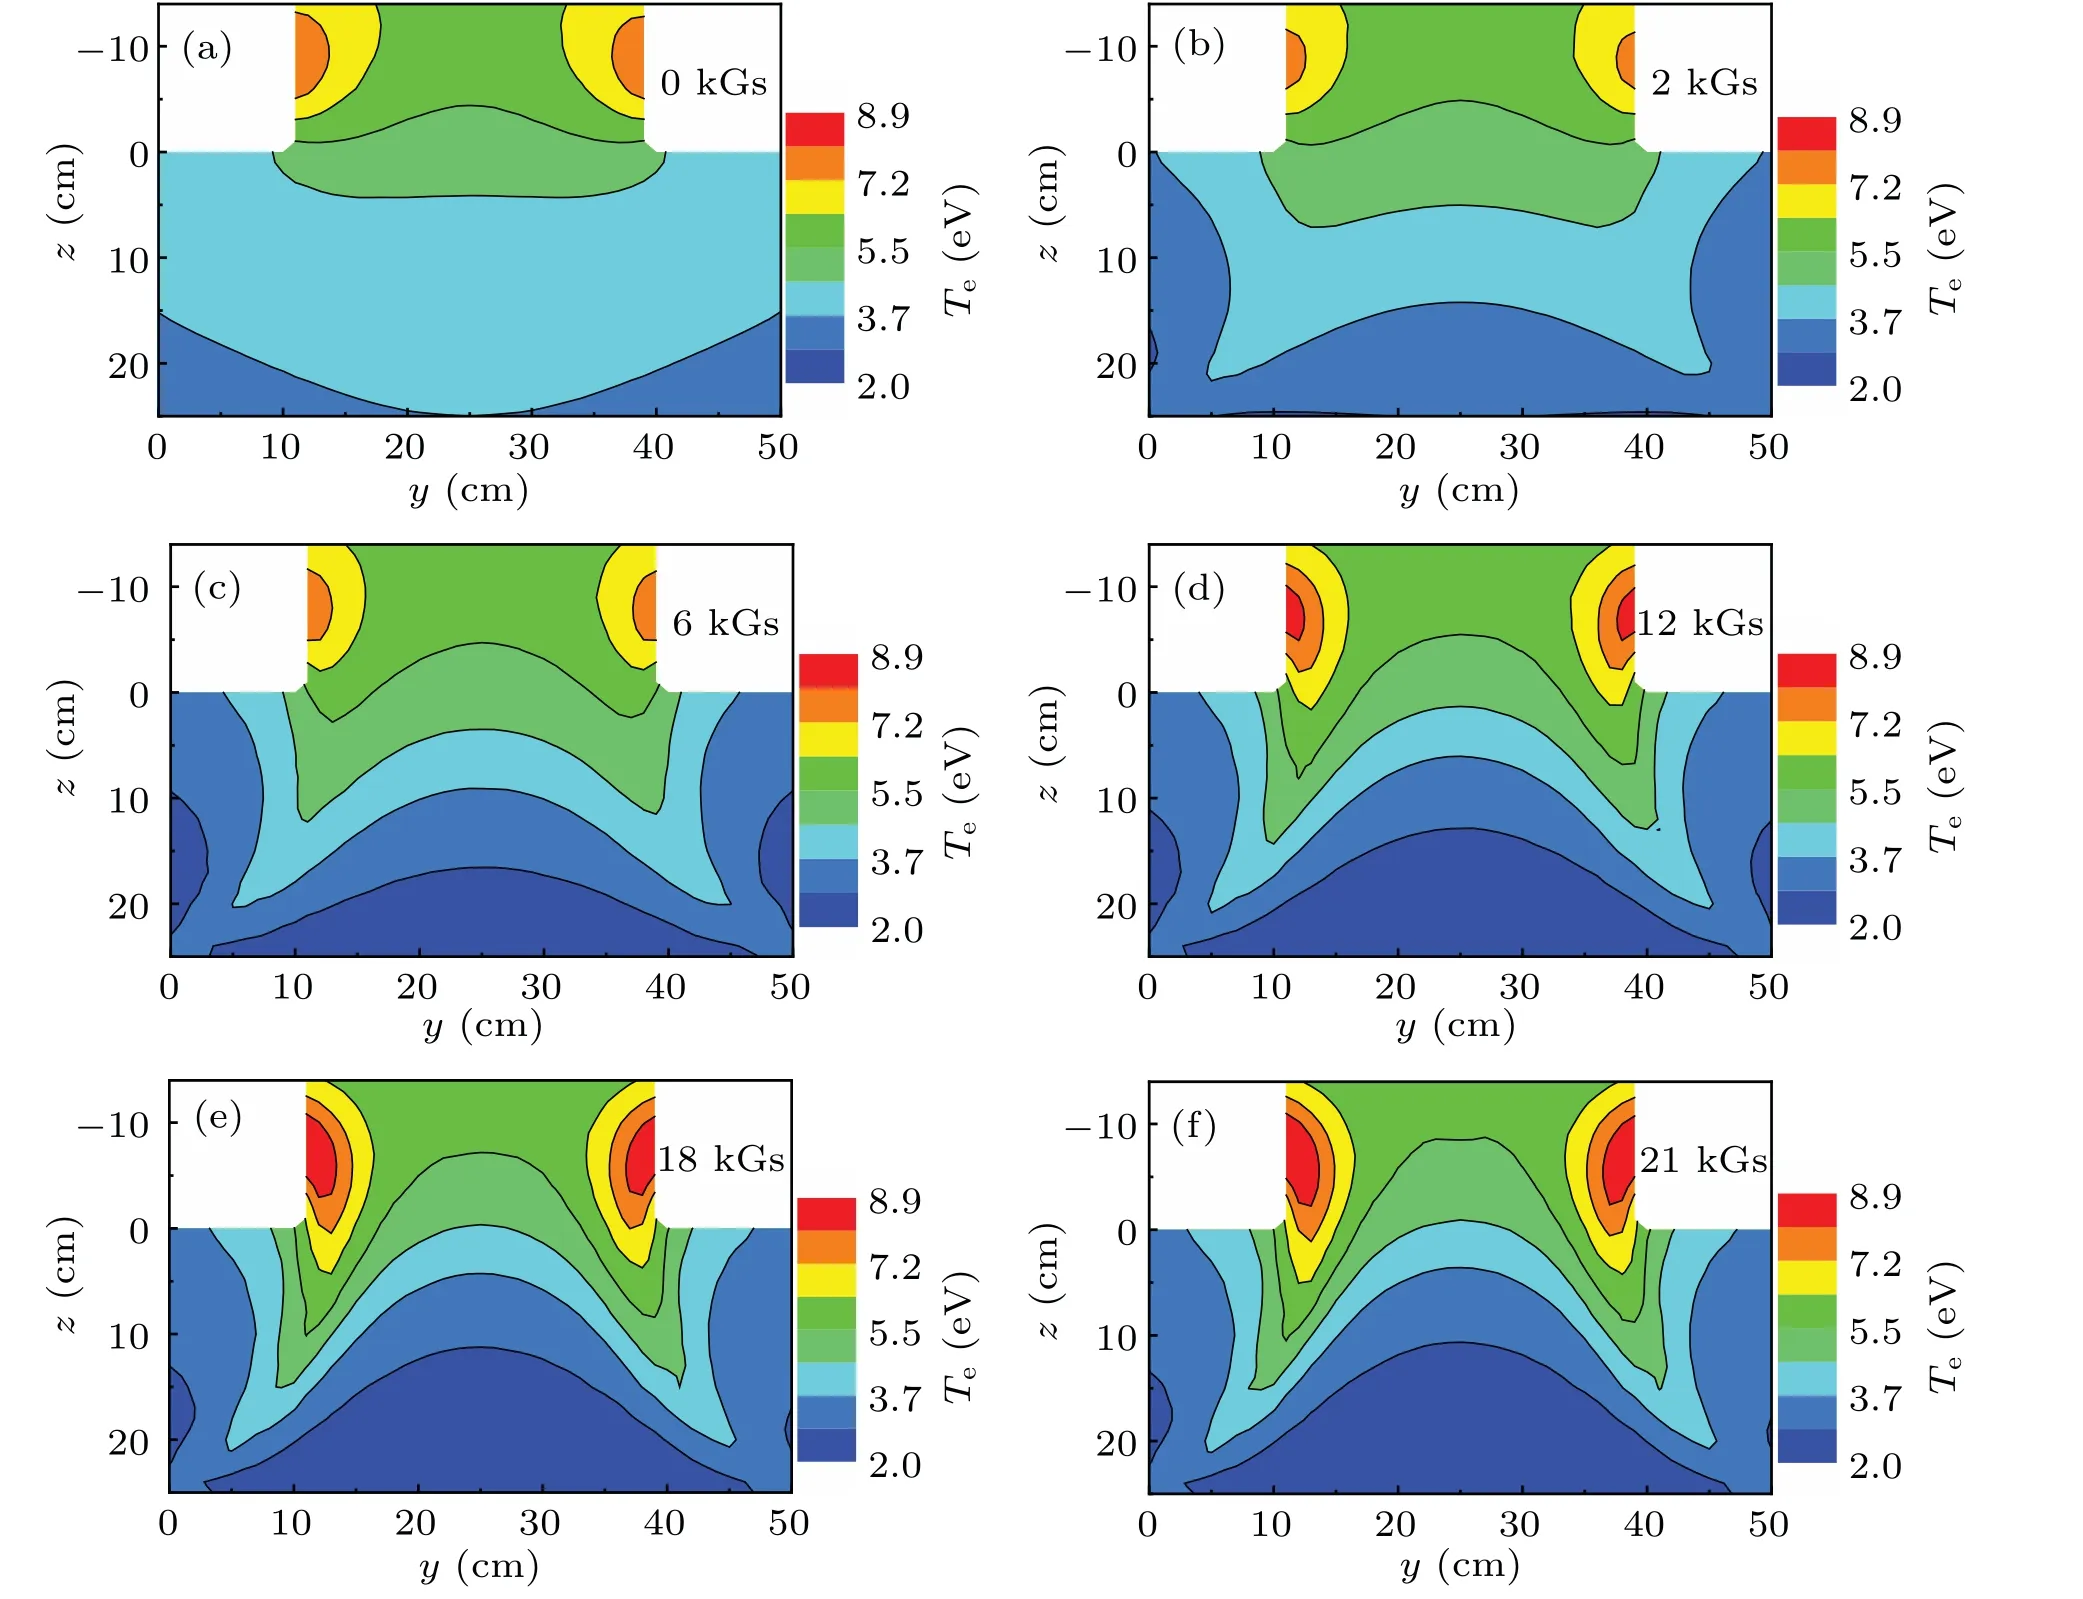
Fig.7.Spatial distributions of the electron temperature in the yz-plane for various RMPM:(a)RMPM=0 kGs,(b)RMPM=2 kGs,(c)RMPM=6 kGs,(d)RMPM=12 kGs,(e)RMPM=18 kGs,(f)RMPM=21 kGs,at 40 kW,0.6 Pa.
Figure 6 represents variations of the electron density with RMPM in the yz-plane at x=30 cm of the chamber.It is clear that the electrons drift to both sides of the y direction when the magnetic field is introduced,and the maximum of the electron density shifts to the driver region.Besides,the electron density distribution in the yz-plane is always symmetric whether the magnetic field is applied or not,which is different from the results in the xz-plane.
As shown in Fig.7,the electron temperature exhibits different profiles by taken the external magnetic field into account.For instance,in the case without the magnetic field,the electron temperature is about 4 eV throughout the expansion region.However,when the magnetic field is applied,the electron temperature at the bottom center of the expansion region decreases rapidly,especially at higher RMPM cases.
3.2.Pressure effect
At a fixed power of 40 kW,it is clear that the electron density increases significantly with gas pressure,as shown in Fig.8,i.e.,the maximum value is about 9.4×10¹⁷m−3at 0.3 Pa,and it increases dramatically to 6.58×10¹⁸m−3at 2 Pa.In addition,the maximum of the electron density moves upwards with pressure,i.e.,from the driver–expansion interface to the driver region.This is because the mean free path is larger at low pressures,so the electrons could induce substantial ionization in the expansion region,although they are mainly heated in the driver region.[13]
From Fig.9,it is shown that the electron temperature decreases rapidly with pressure,due to the higher collision frequency and more energy loss at high pressures.Furthermore,the asymmetry of the electron temperature distribution at low pressure is more obvious,i.e.,the magnitude is about 15.3 eV at the left sidewall of the driver chamber at 0.3 Pa,which is about 1.5 times higher than the value at the right sidewall.This is because more powers are deposited at the left sidewall at low pressures,due to the influence of the magnetic field.Indeed,the collision frequency is lower at low pressure,which leads to the higher non-pivot element in the plasma conductivity tensor(Eqs.(23)and(24)),giving rise to the pronounced influence of the magnetic field on the plasma properties.
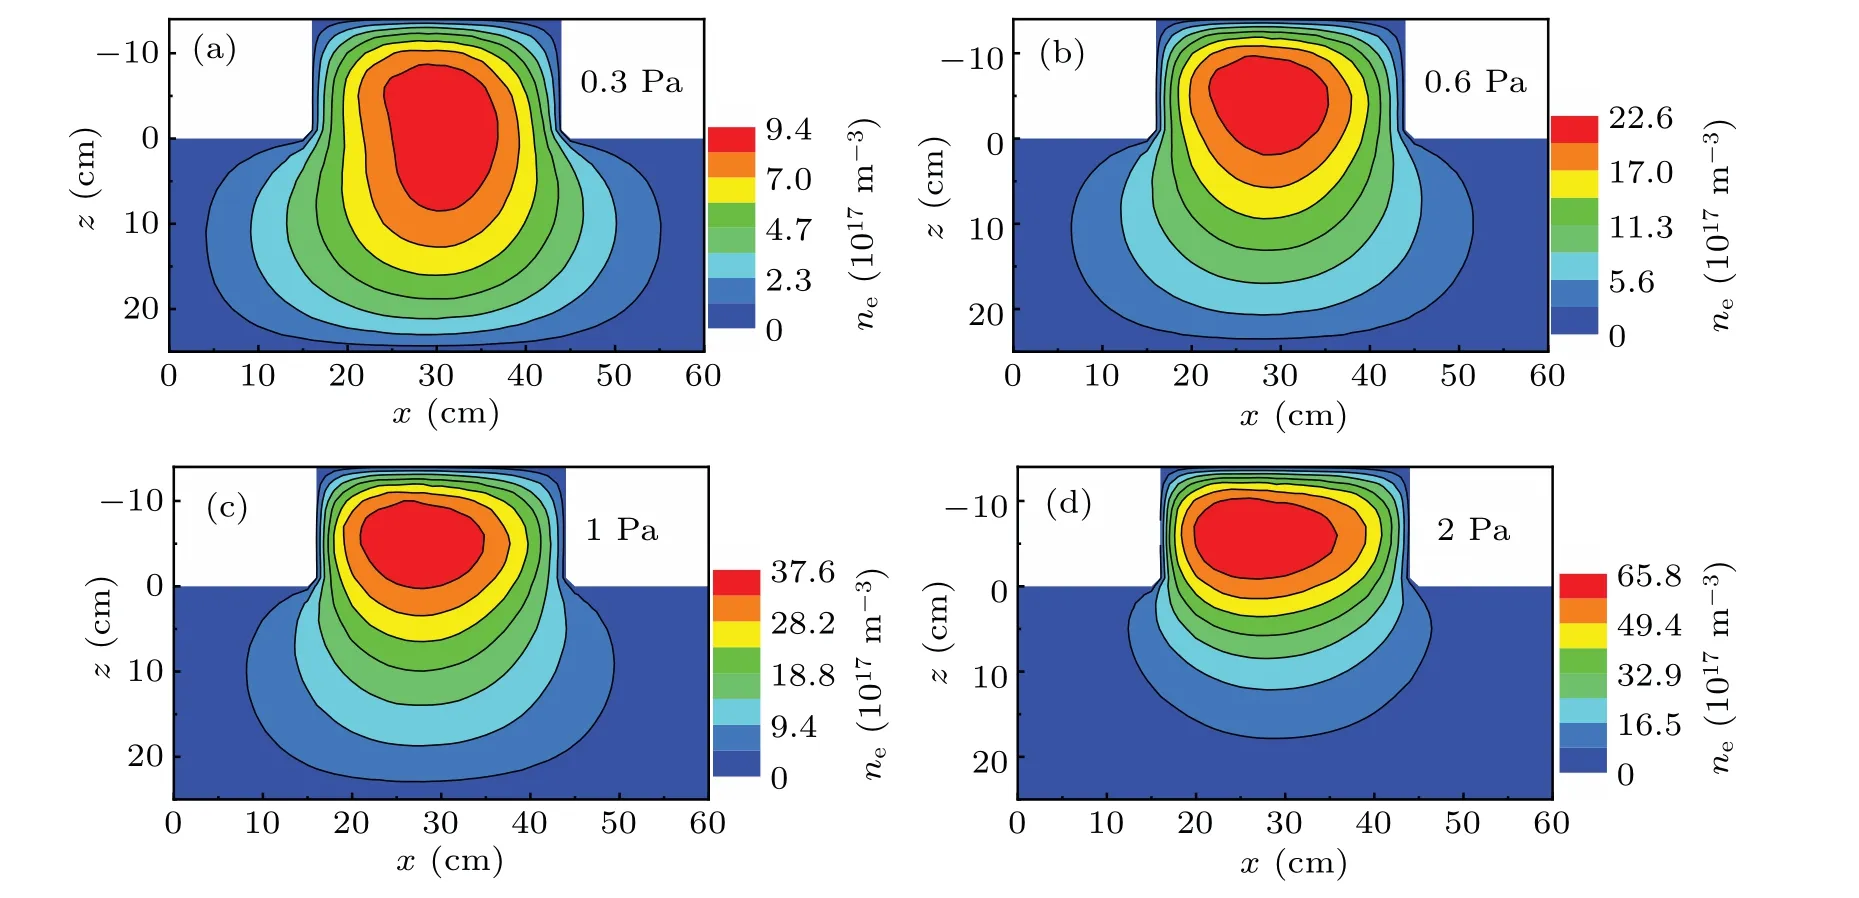
Fig.8.Spatial distributions of the electron density in the xz-plane for various pressures:(a)0.3 Pa,(b)0.6 Pa,(c)1 Pa,(d)2 Pa,at RMPM=21 kGs,40 kW.
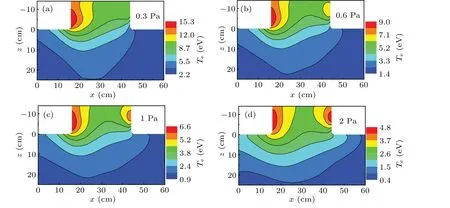
Fig.9.Spatial distributions of the electron temperature in the xz-plane for various pressures:(a)0.3 Pa,(b)0.6 Pa,(c)1 Pa,(d)2 Pa,at RMPM=21 kGs,40 kW.
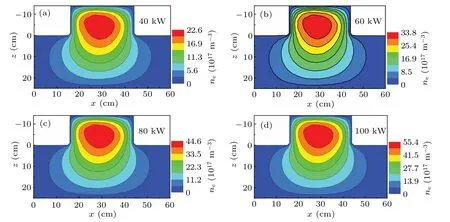
Fig.10.Spatial distributions of the electron density in the xz-plane for various powers:(a)40 kW,(b)60 kW,(c)80 kW,(d)100 kW,at RMPM=21 kGs,0.6 Pa.
3.3.Power effect
The influence of the RF powers(40 kW–100 kW)on the plasma properties is studied at 0.6 Pa and RMPM of 21 kGs.Although the electric field becomes stronger as power increases,the spatial distribution is almost unchanged,thus the electron density has similar profile for various powers.Besides,the electron density increases obviously with power,i.e.,the maximum value is about 2.26×10¹⁸m−3at 40 kW,and it increases to 5.54×10¹⁸m−3at 100 kW.

Fig.11.Spatial distributions of the electron temperature in the xz-plane for various powers:(a)40 kW,(b)60 kW,(c)80 kW,(d)100 kW,at RMPM=21 kGs,0.6 Pa.
The spatial distributions of the electron temperature at various powers are presented in Fig.11.As we mentioned above,the electron temperature exhibits a maximum at the left sidewall of the driver region,followed by a second peak at the right sidewall.In the expansion region,the electron temperature decreases strongly,i.e.,several eV lower,because there is no heating source.Indeed,the maximum value is about 9 eV in the driver region,whereas the minimum value is only about 1.3 eV in the expansion region.As power increases,the electron temperature at the right sidewall of the driver region increases slightly,and the area of the minimum region in the expansion chamber becomes larger.
4.Conclusion
In this work,a 3D fluid model,with electron effective collision frequency and high E-field ion mobility taken into account,is developed to investigate the inductively coupled H2discharges used for CFETR at low pressures and high powers.The results indicate that by using the low E-field ion mobility,the electron density is about four times lower than that in the case with high E-field mobility,whereas the electron temperature is several times higher.
In addition,the spatial distributions of the electron density and electron temperature are also illustrated under different magnetic fields.The results indicate that the application of magnetic field leads to different distributions of the plasma parameters in the xz-plane and yz-plane.In addition,since the magnetic field results in asymmetric power deposition,the electron temperature in the xz-plane at the left side wall of the driver region is much higher than that at the right sidewall.Besides,the asymmetry of the electron temperature and electron density becomes more pronounced with increasing RMPM,due to the deeper penetration of the magnetic field in the chamber.The distribution of the plasma parameters in the yz-plane is always symmetric regardless of whether the magnetic field is applied or not,due to the position of the permanent magnets.Meanwhile,the maximum of the electron density appears at RMPM of 6 kGs,and the electron temperature at the bottom of the expansion region first decreases and then almost keeps constant when the RMPM is higher than 12 kGs.Considering the lower electron temperature and worse asymmetry with increasing RMPM,12 kGs–18 kGs may be the best option under the discharge conditions investigated in this paper.
Moreover,the plasma characteristics are also investigated at various pressures and powers,with the application of magnetic field.As the pressure increases from 0.3 Pa to 2 Pa,the electron density becomes higher,with the maximum shifting from the expansion region to the driver region.Whereas,the electron temperature decreases with pressure,and the asymmetry of the electron temperature becomes less pronounced.Indeed,in the pressure range 0.3 Pa–1 Pa,the asymmetry of the plasma parameters could not be ignored,and this affects the local breakdown of multi-aperture extraction system.Therefore,it is very important to improve the symmetry,which will be explored in the future work.Besides,as power increases,profiles of the electron density and temperature only change slightly.
猜你喜欢
Plasma Science and Technology(2022年5期)2022-06-01
Plasma Science and Technology(2022年5期)2022-06-01
快乐作文(1.2年级)(2022年2期)2022-04-15
Plasma Science and Technology(2022年2期)2022-03-10
Plasma Science and Technology(2021年11期)2021-11-30
Chinese Physics B(2021年11期)2021-11-23
Plasma Science and Technology(2021年5期)2021-05-22
Chinese Physics B(2021年3期)2021-03-19
科学导报·学术(2020年49期)2020-12-06

- Chinese Physics B的其它文章
- Multiple solutions and hysteresis in the flows driven by surface with antisymmetric velocity profile∗
- Magnetization relaxation of uniaxial anisotropic ferromagnetic particles with linear reaction dynamics driven by DC/AC magnetic field∗
- Influences of spin–orbit interaction on quantum speed limit and entanglement of spin qubits in coupled quantum dots
- Quantum multicast schemes of different quantum states via non-maximally entangled channels with multiparty involvement∗
- Magnetic and electronic properties of two-dimensional metal-organic frameworks TM3(C2NH)12*
- Preparation of a two-state mixture of ultracold fermionic atoms with balanced population subject to the unstable magnetic field∗