
Defluoridation of Water Using Active Alumina Derived from Single-Layer Boehmite
2021-11-22 01:20JianchuanSunXuhuiWangShuaiqiChenYanqingLiaoAwangGaoYuhaoHuTaoYangXiangyuXuYingxiaWangJiaqingSong
物理化学学报 2021年10期
Jianchuan Sun , Xuhui Wang , Shuaiqi Chen , Yanqing Liao , Awang Gao , Yuhao Hu , Tao Yang ,Xiangyu Xu , Yingxia Wang , Jiaqing Song ,*
1 State Key Laboratory of Chemical Resource Engineering, Beijing University of Chemical Technology, Beijing 100029, China.
2 Institute of Inorganic Chemistry, College of Chemistry and Molecular Engineering, Peking University, Beijing 100871, China.
Abstract:The preparation of high-efficiency and low-cost adsorbents for the defluoridation of drinking water remains a huge challenge. In this study,single-layer and multi-layer boehmite were first synthesized via an organicfree method, and active alumina used for fluoride removal from water was obtained from the boehmite. The advantage of a single layer is that more aluminum is exposed to the surface, which can provide more adsorption sites for fluoride. The active alumina adsorbent derived from single-layer boehmite exhibits a high specific surface area and excellent adsorption capacity. The high surface area ensures a high adsorption capacity, and the organic-free synthesis method lowers the preparation cost. The asprepared adsorbent was characterized by X-ray powder diffraction (XRD),scanning electron microscopy (SEM), high-resolution transmission electron microscopy (HRTEM), Fourier-transform infrared spectroscopy (FTIR)and nitrogen adsorption-desorption analysis. The single-layer structure of boehmite was determined from the simulated XRD diffraction pattern of single-layer boehmite. The disappearance of the (020)diffraction peak of boehmite illustrates that the dimensions in the b direction are extremely small, and according to the XRD simulation results, the single-layer structure of boehmite could be determined. Single-layer boehmite with a surface area of 789.4 m2∙g−1 was formed first. The active alumina obtained from the boehmite had a surface area of 678.4 m2∙g−1, and the pore volume was 3.20 cm3∙g−1. The fluoride adsorption of the active alumina was systematically studied as a function of the adsorbent dosage, contact time, concentration, co-existing anions, and pH. The fluoride adsorption capacity of the active alumina obtained from the single-layer boehmite reached up to 67.6 mg∙g−1, which is higher than those of most alumina adsorbents reported in the literature. The adsorption capacities of the active alumina are related to the specific surface area and the number of hydroxyl groups on the surface. Dosages of 0.6, 1.0, and 2.6 g∙L−1 of active alumina were able to lower the 10, 20, and 50 mg∙L−1 fluoride solutions, respectively, below the maximum permissible limit of fluoride in drinking water in China (1.0 mg∙L−1), suggesting that the active alumina synthesized in this work is a promising adsorbent for defluoridation of drinking water. In addition, the fluoride adsorption is applicable in a wide pH range from 4 to 9 and is mainly interfered byFurther investigation suggested that the fluoride adsorption of the active alumina follows the pseudo second-order model and Langmuir isotherm model.
Key Words:Defluoridation; Active alumina; Single layer; High surface area; Adsorption;High adsorption capacity; Organic-free
1 Introduction
The fluoride contaminations of drinking water caused by natural and human activities have imposed great threats on the health of millions of people. According to the World Health Organization (WHO), fluoride is one of the three major drinking water pollutants, in addition to arsenic and nitrate1. Fluoride can prevent skeletal and dental decays at low concentrations, but can causes dental fluorosis, skeletal fluorosis and many other health problems at high concentrations2. The WHO has recommended the maximum contaminant level (MCL)for fluoride in drinking water of 1.5 mg·L−11, while the permissible limit established by the Ministry of Health of P. R. China is 1.0 mg·L−13. Therefore,the defluoridation of drinking water is of great significance.
Fluoride removal can be achieved by several techniques including precipitation4,5, membrane filtration6,7, electrochemical treatments8–10, ion exchange11,12and adsorption13. Among these methods, adsorption is the most extensively used because it is highly efficient and economic14. Therefore, a variety of adsorbents have been developed for fluoride removals, such as active alumina15–18, carbon materials19,20, layered double hydroxide21,22, zeolites23and natural materials24,25. Among all these adsorbents, active alumina has been proved to be an excellent one for defluorination with its low-cost and high binding affinity with fluoride. However, the adsorption capacities of most active alumina products are insufficient to maintain fluoride contents in drinking water lower than the permissible fluoride limit in China (1.0 mg∙L−1)at low dosages.In addition, to the best of our knowledge, there is little report for the application of active alumina with high surface areas to the fluoride removal26. In the present work, a boehmite of high surface area containing single octahedral AlOOH layer along the b-axis was used as precursor for the synthesis of active alumina with no aluminum alkoxide or template agent used27,28. The asprepared active alumina was characterized and its application to fluoride removal was explored.
2 Experimental and computational section
2.1 Materials
Sodium hydroxide (NaOH), aluminium hydroxide (Al(OH)3)and aluminium sulfate octadecahydrate (Al2(SO4)3·18H2O)were purchased from Beijing Chemical Works. Sodium fluoride(NaF)and other chemicals were purchased were purchased from Xilong Chemical Co. Ltd., Guangdong, China. All these chemicals were analytical grade and used as-received without further purification. A commercial boehmite powder procured from Sasol Germany GmbH, denoted as SB.
2.2 Preparation of adsorbents
According to the method in the patent29, two boehmite samples S1 and S2 were synthesized at different temperaturesviaan organic-free method using NaAlO2solution and Al2(SO4)3solution. S1 and S2 were calcined at 500 °C for 2 h to form the active alumina, which were respectively labeled as S1-500 and S2-500. The commercial sample SB, was also calcined at 500 °C for 2 h. The resultant active alumina, denoted as SB-500, was used as a contrast sample.
2.3 Characterization of adsorbents
X-ray powder diffraction (XRD)patterns were recorded on a Rigaku D/MAX 2500 X-ray diffractometer (Japan)with a graphite monochromator using CuKαradiation (λ= 1.54178 Å(1 Å = 0.1 nm)). The mean crystallite sizes were estimated with the Debye-Scherrer’s equation.

whereλis the wavelength of X-ray,Bmis the width of diffraction peak at half-maximum intensity of boehmite,Bsis the width of diffraction peak at half-maximum intensity of a highly crystalline material (high purity quartz sand), andθis the Bragg angle.
The morphologies of the active alumina particles were imaged using a ZEISS SUPER55 (Germany)scanning electron microscope (3/30 kV)and a JEM-2100 electron microscopy(Japan)for the SEM images and HRTEM images, respectively.
The surface area and pore volume of the active alumina were measured by the nitrogen adsorption-desorption method using a Micromeritics TriStar 3020 instrument (America).
2.4 Fluoride adsorption experiments
A fluoride stock solution (500 mg∙L−1)was prepared by dissolving NaF (dried at 120 °C overnight)in deionized water.The working solutions were freshly diluted from the stock solution. The active alumina samples prepared from boehmite were respectively put in the 300 mL polypropylene flasks containing 100 mL of different concentrations of fluoride solutions and shaken at 200 r·min−1at (25 ± 1)°C for a predetermined contact time in a shaker. The suspensions were respectively filtered and analyzed for residual fluoride. For the experiments with different adsorbent dosages, different amounts of active alumina were respectively added into the fluoride solutions. To determine the fluoride adsorption kinetics, S1-500 and S2-500 were respectively added into 100 mg∙L−1fluoride solutions at the adsorbent dosage of 0.2 g·L−1and for SB-500 10 mg∙L−1fluoride solutions were used. The fluoride adsorption isotherm investigation was conducted with the initial fluoride concentrations of 10, 20, 50, 100, and 200 mg∙L−1, respectively,and 0.2 g·L−1active alumina. The contact time was set to 24h.The fluoride concentration was measured with an F-Electrode-K2 and LE 302 (METTLER TOLEDO)in a total ionic strength adjustment buffer (TISAB III)solution to maintain pH = 5.3 and to eliminate the interference of complexing ions.
The fluoride adsorption capacityqt(mg·g−1)was calculated with Eq. (2).

whereC0(mg∙L−1)andCt(mg∙L−1)are the initial concentration and residual fluoride concentration at timet, respectively,V(L)is the solution volume, andm(g)is the mass of adsorbent.
3 Results and discussion
3.1 Characterizations of boehmite and active alumina
Fig. 1 shows the XRD patterns of S1, S2, SB, S1-500, S2-500 and SB-500. It is clear that S1, S2 and SB exhibit the characteristic reflection peaks of boehmite phase (Ref: JCPDS no. 74-1895)(Fig. 1a). No impurity peaks were observed,suggesting that the boehmites were highly pure. It is worth noting that S1 shows no (020)reflection peak due to the extremely small crystalline size along the b axis. Table 1 lists the mean crystalline sizes of each sample along thea,bandcaxes calculated with the Debye-Scherrer’s equation (Eq. (1)).

Fig. 1 XRD patterns of the adsorbents and their precursor.

Table 1 Mean crystalline sizes of S1, S2 and SB along a, b and c axes calculated by Debye-Scherrer’s equation.
TheD(020)of S1 and S2 could not be calculated from their XRD patterns due to the broad (020)reflection. Therefore, the software, Discuss, was used to simulate the X-ray diffraction patterns of boehmite with different number of cells. Three parameters,X,YandZ, were used to describe the number of unit cells per crystallite in thea,bandcdirections, respectively.Since the boehmite unit cell contains two octahedrally coordinated AlOOH layers along thebdirection, the simulation was conducted in the half-cell increments. In addition, the simulation uses the atom positions and thermal parameters of a well crystallized boehmite30. As shown in Fig. 2, the simulation results are in good agreement with the results reported in literature31. The (020)reflection only disappears ifYequals to 1/2. Therefore, there is only single layer of octahedral AlOOH in S1 and itsD(020)is only 1/2bwith the size of ~0.61 nm. The 1–2 octahedral AlOOH layers co-exist in S2.

Fig. 2 Simulated X-ray powder diffraction patterns of boehmite with different number of unit cells in the a, b and c axes.
Similarly, the S1-500, S2-500, and SB-500 display the typical reflection peaks of γ-Al2O3(Fig. 1b). The reflection peaks of S1-500 and S2-500 are broader than those of SB-500 due to their smaller crystal sizes. In all, the boehmite underwent a topotactic transformation into active alumina upon the calcination at 500 °C for 2 h.
Fig.3 shows the SEM and HRTEM images of the active alumina samples. SB-500 exhibits an irregular granular form,while S1-500 and S2-500 are nanoplates with wrinkle structures.The nanoplates with wrinkles provides large surface areas and high pore volumes, which is favorable to the fluoride adsorption.
The active alumina samples S1-500, S2-500 and SB-500 were dehydrated at 100 °C overnight and measured for their infrared spectra. As shown in Fig. 4, all samples exhibit the OH stretching transmittance bands centered at ~3446 cm−1and the peak at 1639 cm−1for the bending vibration of adsorbed H2O. It is worth noting that the OH stretching bands of S1-500 and S2-500 are much broader and stronger than that of SB-500, implying that S1-500 and S2-500 contain more active OH for the fluoride adsorption. It can be explained with their thin nanoplate structures that expose more Al to the surface.

Fig. 4 FT-IR spectra of S1-500, S2-500 and SB-500.
Table 2 lists the specific surface areas and pore volumes of the boehmite and active alumina. Due to its single layer structure, S1 shows the largest surface area up to 789.4 m2·g−1.The multi-layers and larger crystal sizes of S2 and SB lower their surface area to 572.8 and 286.7 m2·g−1, respectively. The surface areas and pore volumes of alumina S1-500 and S2-500 are larger than those of the commercial alumina SB-500, in particular, the surface area and pore volume of S1-500 are up to 678.4 m2·g−1and 3.2 cm3·g−1, respectively. Fig. 5 shows the low-temperature nitrogen adsorption and desorption isotherm curves of S1-500,S2-500 and SB-500. The isotherm curves of S1-500 and S2-500 are the type IV with the Type H3 hysteresis loops, which usually results from loosely coherent aggregates of plate-like mesoporous particles32,33, consistent with the HRTEM and SEM results (Fig. 3). The isotherm curve of SB-500 is the type IV with the Type H2 hysteresis loop, implying that SB-500 is mesoporous with homogeneously accumulated particles.

Table 2 Surface areas and pore volumes of boehmite and the corresponding active alumina.

Fig. 5 Low-temperature nitrogen adsorption and desorption isotherm curves of S1-500, S2-500 and SB-500.
3.2 Adsorption experiments
3.2.1 Effect of adsorbent dosage
Adsorbent dosage is one of the most important parameters to evaluate the fluoride removal efficiency, especially in the practical applications. Therefore, different doses of S1-500, S2-500 and SB-500 were respectively used for the fluoride removals of 100 ml fluoride solutions with the initial concentrations of 10,20 and 50 mg∙L−1. As shown in Fig. 6, the residual fluoride concentration decreased dramatically first and gradually became stable with the value lower than the MCL for fluoride in China(1.0 mg∙L−1)with the increase of the alumina dose from 0.2 to 40.0 g∙L−1. The initial sharp drop of the residual fluoride concentration is due to the large surface area where a large number of active sites are available for the fluoride adsorption.The adsorption reached equilibrium as the fluoride concentration decreased to a certain degree. For the 10 mg∙L−1fluoride solution, at least 35 g∙L−1SB-500 was required to lower the fluoride concentration to the MCL (1.0 mg∙L−1)(Fig. 6a). In contrast, only 0.6 g∙L−1S1-500 and S2-500 were needed to achieve such fluoride removal efficiency (Fig. 6b). In addition,only 1.0 and 2.6 g∙L−1active alumina prepared from boehmite were needed to lower the fluoride concentrations in 20 and 50 mg∙L−1fluoride solution to the MCL (Fig. 6c,d). Table 3 lists the fluoride adsorbent dosages used to achieve the permissible limit for fluoride reported in literature and those of the active alumina prepared in the present study for comparison purpose. It is clear that as-prepared active alumina is a much more effective adsorbent for the fluoride removal of drinking water.3.2.2 Adsorption kinetics
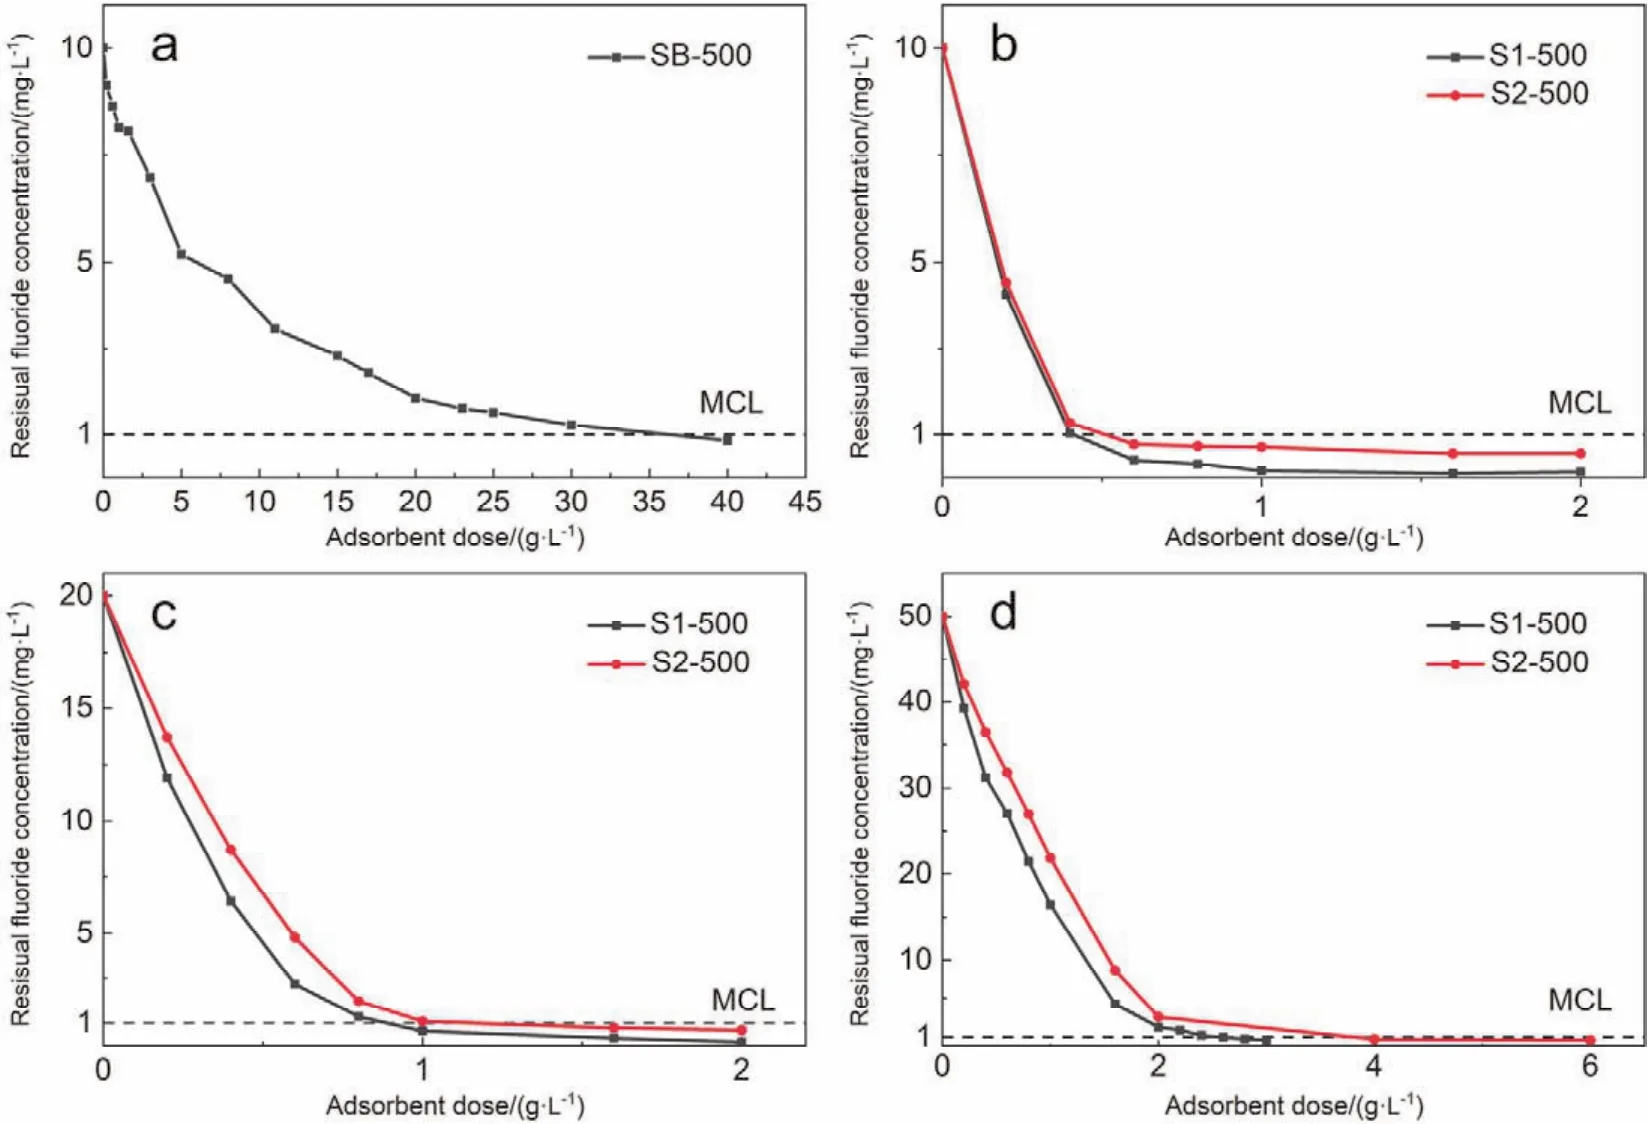
Fig. 6 Effects of the dosages of different adsorbents on the fluoride removal efficiency in fluoride solutions of different initial concentrations.

Table 3 Comparison of the minimum dosages of different adsorbents needed to lower fluoride concentration below theMCL for fluoride in China (1.0 mg∙L−1).
Contact time exhibited significant effects the fluoride adsorption of the active alumina adsorbent. Fig. 7a shows the variations of the fluoride adsorption capacities of S1-500, S2-500 and SB-500 with contact time. Each data point was obtained from an independent test. Initially, the adsorption capacity increased rapidly with the prolongation of contact time. The adsorption on S1-500 reached the equilibrium state in 60 minutes(Fig. 7a), longer than that on S2-500. However, the final adsorption capacity of S1-500 is higher than that of S2-500. The commercial adsorbent SB-500 exhibited the slowest adsorption rate and the lowest adsorption capacity. In all, the fluoride adsorption capacities of the adsorbents follow the order of S1-500 (63.0 mg∙g−1)> S2-500 (34.1 mg∙g−1)> SB-500 (8.7 mg∙g−1), consistent with the order of their surface areas of S1-500 (678.4 m2∙g−1)> S2-500 (450.9 m2∙g−1)> SB-500 (212.7 m2∙g−1).

Fig. 7 (a)Effects of contact time on fluoride adsorption of S1-500 and S2-500 (C0 = 100 mg∙L−1)and SB-500 (C0 = 10 mg∙L−1)and(b)pseudo second-order fitting plots of the fluoride adsorptions of S1-500, S2-500 and SB-500.
Pseudo first-order model can be used to explain the adsorption between a solid-liquid system based on the physisorption capacity of the solid37. The pseudo second-order model describes the chemisorption behaviors38. To explore the fluoride adsorption mechanism of the active alumina, the pseudo firstorder (Eq. (3))and the pseudo second-order (Eq. (4))were fitted to the experimental data. Table 4 summarizes the fitting results.


Table 4 Pseudo first-order and Pseudo second-order model parameters of the fluoride adsorptions on S1-500, S2-500 and SB-500.
Theqe,calvalues calculated with the pseudo first-order kinetic model differs appreciably from the experimental valuesqe,expt, and those calculated with the pseudo second-order kinetic model are very close to theqe,exptvalues. In addition, the correlation coefficients of determination (R2)of the pseudo second-order kinetic model are closer to the unity than those obtained from the pseudo first-order kinetic model. Therefore, the fluoride adsorption on the adsorbents follows the pseudo second-order model, suggesting that the adsorption is chemisorption. In addition, the active alumina prepared in the present work is a very effective adsorbent for fluoride removal.
3.2.3 Adsorption isotherms
Langmuir and Freundlich isotherm models are the most commonly models to describe the adsorption isotherms39,40. In the present work, the fluoride adsorption experimental data were fitted with these two models (Eqs. (5)and (6)). Table 5 lists the fitting results.

Table 5 Parameters of Langmuir and Freundlich isotherm models obtained by fitting the experimental data.

The experimental data of the fluoride adsorption on both S1-500 and S2-500 fit the Langmuir model better with higher correlation coefficients of determination (R2)than those obtained with the Freundlich model (Fig. 8), suggesting that the fluoride adsorption is monolayer. It is worth noting that the theoretical saturated adsorption capacity of S1-500 calculated with the Langmuir model is 67.6 mg∙g−1, higher than most of those reported in literature (Table 6). The high fluoride adsorption capacity is attributed to its single layer plate-like structure and large surface area that expose more hydroxyl groups, the active adsorption sites, for the fluoride adsorption.

Fig. 8 Linear fitting of the fluoride adsorption experimental data of S1-500 and S2-500 with the (a)Langmuir isotherm model and(b)Freundlich isotherm model.

Table 6 Comparison of the minimum dosages of different adsorbents needed to lower fluoride concentration below the MCL for fluoride in China (1.0 mg∙L−1).
3.2.4 Effect of coexisting anions
In general, the fluoride-contaminated water also contains other anions, such aswhich may compete with fluoride for the active sorption sites. Therefore, the adsorption was conducted with S2-500 and SB-500 as the adsorbents in the 10 mg∙L−1fluoride solutions containing the 50,200 and 400 mg∙L−1competitive anions. As shown in Fig. 9, the fluoride adsorptions on both SB-500 and S2-500 were not affected by Cl−andbut were inhibited by80% as the concentration ofincreased. It can be explained thatare more strongly negatively charged thanand thus can compete with fluoride for the adsorption.More specifically, the adsorption capacity decreased to 12% or

Fig. 9 Effect of coexisting anions on the fluoride adsorption on (a)S2-500 and (b)SB 500.
3.2.5 Effects of pH
The pH of fluoride solution can affect the surface charge of the active alumina, and thus influences its fluoride adsorption.The fluoride adsorption of S2-500 was then studied at different initial pH values ranging from 3 to 11. As shown Fig. 10a, the initial pH of fluoride solution exhibited remarkable effects on the fluoride adsorption capacity. The adsorption capacity slightly declines from 37.4 to 34.1 mg∙g−1as the initial pH increased from 4 to 9. The adsorption capacity is dramatically decreased at the initial pH below 4 because of the formation of the weakly ionized HF43. The fluoride adsorption capacity of the adsorbent at pH > 9 is also significantly lower.

Fig. 10 (a)Effect of pH on the fluoride adsorption on S2-500 and (b)the zeta potential curve for S2-500.
The fluoride adsorption capacity of the active alumina is closely related to the pH of the point of zero charge (pHpzc)44,45.Fig. 10b shows the zeta potential curve of S2-500 with the pHpzcof ~9.1. The hydroxyl groups on alumina are protonated at pHs below pHpzc, and dominant species on the alumina surface are positive charges. At low pHs, the strong electrostatic attraction between the negatively charged fluoride and the positively charged alumina surface results in higher adsorption capacities.At the pHs higher than the pHpzc, the hydroxyl groups are deprotonated, which turns the dominant species of alumina surface from the positively charged to the negatively charged,and thus causes the dramatic adsorption capacity drop at pH = 9.
4 Conclusions
In the present work, single-layer boehmite with high surface area of 789.4 m2∙g−1was synthesizedviaan organic-free method,which was used to prepare an active alumina adsorbent for the defluoridation of drinking water. The active alumina adsorbent exhibited the large surface area of 678.4 m2∙g−1, which resulted in the high fluoride adsorption capacity of 67.6 mg∙g−1. In addition, only a small amount of active alumina adsorbent is needed to lower fluoride solutions below the MCL of China (1.0 mg∙L−1). The fluoride adsorption can be described with the pseudo-second-order a kinetics model and the Langmuir isotherm model. The fluoride adsorption is not interfered by the test anions, except forThe interference fromis much more dramatic than that fromThe active alumina is applicable to the fluoride adsorption in a wide pH range of pH = 4–9. In conclusion, the high surface area and lowcost of active alumina is an excellent adsorbent with great application potentials for the defluoridation of drinking water.
- 物理化学学报的其它文章
- PVP封端剂对Pd纳米晶电催化氧化甲醇和乙醇性能的影响
- Photocrosslinking-Immobilized Polymer Vesicles for Lowering Temperature Triggered Drug Release
- Hollow Nitrogen-Rich Carbon Nanoworms with High Activity for Metal-Free Selective Aerobic Oxidation of Benzyl Alcohol
- CdTeSe合金幻数团簇的室温合成和形成机理研究
- 体相界面导通的复合快离子导体
- 异氰酸苯酯诱导的类胶原多肽自组装