
Effects of Climate Variability on Habitat Range and Distribution of Chub Mackerel in the East China Sea
2021-12-22 11:44YUWeiWENJianCHENXinjunLIGangLIYuesongandZHANGZhong
YU Wei, WEN Jian, CHEN Xinjun, 2), 3), 4), 5), 6), LI Gang,LI Yuesong, *, and ZHANG Zhong
Effects of Climate Variability on Habitat Range and Distribution of Chub Mackerel in the East China Sea
YU Wei1), 3), 4), 5), 6), WEN Jian1), CHEN Xinjun1), 2), 3), 4), 5), 6), LI Gang1), 3), 4), 5), 6),LI Yuesong1), 3), 4), 5), 6), *, and ZHANG Zhong1), 3), 4), 5), 6)
1),,201306,2),,266237,3),,201306,4),,,201306,5),,201306,6),,201306,
Spatio-temporal distribution of chub mackerelis strongly susceptible to climate variability. In this study, a weighting-based habitat suitability index (HSI) model was established to assess the impacts of Pacific Decadal Oscillation (PDO) on habitat range and distribution ofin the East China Sea (ECS) using vertical water temperature at depths of 2.5m, 25m and 50m. Results showed that the optimal HSI model selected from ten weighting scenarios can yield reliable predictions. Cor- relation analysis revealed a significant negative relationship between the PDO index and water temperature anomaly at different depths. The water temperatures at three different layers on the fishing ground oftended to be low in the warm PDO phase and high in the cold PDO phase, respectively. The range of suitable habitats and its spatial distribution exhibited large differ- ences between the warm and cold PDO regimes. During a warm PDO phase, vertical water temperature became cool, and the month- ly preferred water temperature at each depth forshifted southeastward. Consequently, habitat quality dramatically de- creased, and suitable habitat ranges also reduced and moved southeastward. Conversely, in a cool PDO phase, with the warmer ver- tical water temperature and northwestward shift of the preferred water temperature, the suitable habitats enlarged and migrated in the same direction. Our findings indicate that the PDO produced significant impacts on habitat range and distribution ofin the East China Sea.
; habitat pattern; vertical water temperature; Pacific Decadal Oscillation; the East China Sea
1 Introduction
Chub mackerelis a costal-pelagic fish species extensively distributed in the Pacific, Atlantic and Indian Oceans (Ystsu., 2005). On the continental shelf with warm and temperate waters in the East China Sea (ECS) and the Japan Sea,stock is divided into two regional stocks,., the Tsushima Current (TS) stock and the ECS stock, which are both abundant and tar- geted by many Asia-Pacific countries such as China, Japan, South Korea and Russia (Watanabe and Yatsu, 2002; Wa- tanabe., 2006). The spawning ground is located in the southern waters of ECS and the western waters of the Sea of Japan (Yamada., 1998; Li., 2014c).is a migratory species with strong swimming ability, it performs regular long-distance spawning, feeding and over- wintering migration (Shiraishi., 2008). Taking the ECSstock offor example, with the water tempera- ture increasing in spring, it migrates northward into the western areas of ECS, the Yellow Sea and the adjacent wa- ters around Kyushu Island for feeding. Sexually mature individuals may spawn in the Zhoushan Island. In autumn, the water temperature dramatically decreases, the ECS stock ofwill shift back from the northern Yellow Sea to the waters of ECS.
is one of the most important fishery stocks (Hiyama., 2010). Up to now, the production ofranks the 7th in the marine production world- wide. The commercialfisheries started in 1950, then this fishery largely expanded in the next decade. In 1960, the total catch was up to 500 thousand tons. With the improvement of fishing technique, the yearly total catch significantly increased, which was 100 thousand tons in 1967, and peaked up to 3413 thousand tons in 1978. In the following years,tended to be overexploited, and the annual catch gradually reduced. Many countries began to managefisheries, and its stock bio- mass recovered and fluctuated with about 2 million tons in recent years (FAO, 2018). The exploitation ofin China has a relatively long history, and now Chi- nese fishing vessels mainly fishin the ECS and within the western Pacific regions managed by the North Pacific Fisheries Commission (NPFC) using the light- ing purse-seine fishing technology (Chen., 2009; Yu., 2018). In the ECS, the spatial distribution of fishing ground depends on the seasons.It locates in the South ECSduring summer, in the north ECS and south Yellow Sea during autumn, and north Yellow Sea during winter (Li., 2014a).
Based on the annuallycatches in different countries, obviously, it tends to fluctuate from year to year(Hiyama., 2010; Yasuda., 2014). What cause such a drastic change? Climatic and environmental factors may be critical triggers. It is well recognized that large-scale climate variability and regional environmental changes are closely linked to the abundance and distribution ofstock (Li., 2014b; Yu., 2018; Taga., 2019). Previous findings suggested thatpreferred to inhabit in waters with sea surface temperature (SST) ranging from 15℃ to 20℃ and sea surface salinity (SSS) varying from 31.3 to 32.3 in the northern fishing ground of the ECS, while the suitable SST and SSS was 26.5–30℃ and 3.3–34.3, respectively, in the southern fish- ing ground (Zheng., 2008). Two indicators of food availability, including chlorophyll-concentration (Chl) and net primary production (NPP), showed significant cor- relations with spatio-temporal distribution ofstock. Suitable range of the two variables was 0.30–0.92mgm−3and 523.7–806.46mgm−2d−1, respectively (Li and Chen, 2007, 2009). Additionally, the El Niño and La Niña events play an important role in regulating the oceano- graphic and ecological conditions in the ECS system and further impacted habitat suitability of(Guo., 2018; Yu., 2018). Therefore, current research onwell revealed the interannual changes of spa- tial and temporal distribution of ECS stock, and the rela- tionship between resource fluctuations and environmental dynamics of sea surface parameters.
Although many studies have investigated impacts of sea surface environments on(Guan., 2013; Gao., 2015), whereas adultis a species performing vertical migration (Li, 2012). Vertical water tem- perature difference of the fishing ground may result in a various habitat conditionsa bottom-up process (Chen., 2014). How the habitat range and distribution ofin the ECS change with the vertical water temperature need further studies. In addition, the alternation of many pelagic fish species in the western North Pacific Oceans coincided with climate regime shift, particularly in response to Pacific Decadal Oscillation (PDO) (Tian., 2004; Anthony and Allen, 2011). The PDO is often described as a long-lived El Niño-like pattern of Pacific cli- mate variability (Zhang., 1997). In parallel with the El Niño and La Niña events, the extreme PDO regimes have been divided into warm (, positive) and cool (., negative) phases, defined by the water temperature ano- malies in the Northeast and tropical eastern Pacific Ocean. In general, in a warm PDO regime, SSTs are anomalously warm along the western Pacific coast of North America, and the sea level pressures are below the average over the North Pacific; while in a cool PDO regime, the situation is totally opposite (Mantua., 1997; Mantua and Hare, 2002). How does habitat pattern ofrespond to PDO on a longer time scale, such as decade or several decades? It is still unknown. For a more accurate understanding of habitat variations ofin the ECS on a basis of the vertical water temperature originated from climate change, a habitat model coupling with water tem- perature at different depths and PDO factors is required to explore its underlying mechanism.
In this study, a fishing effort-based habitat suitability in- dex (HSI) model was established to assess the impacts of PDO regime shift on habitat range and distribution ofin the ECS using vertical water temperatures at depths of 2.5m, 25m and 50m. The predictors in the HSI model were assigned ten weighting scenarios in order to differentiate the environmental contribution to spatial dis- tribution of. The purposes of this study are to 1) investigate and differ the contributions of the vertical water temperature to fishing ground; 2) develop an inte- grated habitat model to predict habitat hotspots; and 3) as- sess the impacts of PDO regime shift on habitat range and distribution of the ECS stock of.
2 Materials and Methods
2.1 Fisheries Data
Chinesefisheries data in the ECS were ob- tained from the National Data Center of Chinese distance- water fisheries in the Shanghai Ocean University. Due to the migration behavior of, this stock mainly was in the waters between 24˚–32˚N and 118˚–130˚E in the ECS from July to September, which is an important fish- ing season for(Yu., 2018). Thus, the da- ta period was from July to September in 2006 to 2015. The data information included fishing date (year and month), fishing location (longitude and latitude), catches (tons) and fishing efforts (haul). The spatial and temporal resolution of the fisheries data were0.25˚×0.25˚and month, respec- tively. The catch-per-unit-effort (CPUE) within a 0.25˚×0.25˚grid cell was determined based on the total catches in a certain grid divided by the total number of fishing ef- forts in the same grid.
2.2 Environmental Data and Climatic Index
Previous studies have shown that adultmain- ly inhabits in depths from sea surface to 50m during sum- mer to autumn, then moves in deeper water at 150m in win- ter (Li, 2012). Because the study period in this research was in summer and autumn, the water temperature was selected from the depths of 2.5m, 25m and 50m. The wa- ter temperature data were sourced from the eddy-resol- ving Ocean General Circulation Model for the Earth Simu- lator (OFES) model (Masumoto., 2004; Taguchi., 2007). The OFES simulation was conducted on the Earth Simulator with the support of Japan Agency for Marine- Earth Science and Technology. Spatial and temporal reso- lution of environmental data was 0.1˚×0.1˚ grid cell and month, respectively. The data included the period from 1977 to 2015 on the fishing ground ofin the ECS.
In this study, the PDO index data from January to De- cember during 1977–2015 were sourced from the Joint Ins- titute for the Study of the Atmosphere and Ocean (the website is: http://research.jisao.washington.edu/pdo/PDO. latest). The data were from the updated standardized va- lues, derived as the leading PC of monthly SST anomalies in the North Pacific Ocean, poleward of 20˚N. Based on the PDO index, the study period during 1977–2015 was classified into two PDO regimes, with a warm PDO phase from 1977 to 1998 and a cold phase from 1999 to 2015, which was consistent with the conclusions from Mantua and Hare (2002).
2.3 HSI Model Construction and Validation
In order to identify the habitat hotspots ofin the ECS and evaluated the impacts of PDO regime shift,the fishing effort-based HSI model was constructed to pre- dict the habitat suitability from 1977 to 2015. In this study, the HSI model was established by the following steps.
The first step was to examine the correlations between indicators of fishing effort (., fish occurrence) and wa- ter temperature at depths of 2.5m, 25m and 50m using his- togram analysis. Based on the relationship, the observed suitability index (SI) for each environmental variable was determined. Thevalue was calculated by using the fre- quency distribution of total fishing effort within a certain environmental class interval divided by the maximum fre- quency value of fishing effort (Chen., 2010). The wa-ter temperature class interval was determined by 1.0℃. The observedwas determined by the following equation (Li., 2014):

whereEffort is the total fishing effort at a given class in- terval of the environmental variables; Max(Effort) is the maximum fishing effort at a certain class interval.
The second step was to fit the SI model using the ob- servedvalues and the class interval values for each en- vironmental variable. The SI model was fitted by the fol- lowing equations (Yu., 2015, 2016):

whereandare the estimated model parameters, which are solved with a least squares estimate to minimize the residuals between the observed and predictedvalues;Tempis the class interval value for water temperatures at depths of 2.5m, 25m and 50m, respectively. Each SI mo- del from July to September was statistically tested based on analysis of variance. The data during 2006–2014 were applied to develop the SI models.
The third step was to combine all the SI models into an integrated HSI model based on the Weighted Arithmetic Mean Model (WAMM) method (Gong., 2012).may have different habitat preferences according to the water temperatures at different depths. Thus, the pre- dictors in the HSI model were assigned ten weighting sce- narios in order to differentiate the environmental contri- bution to spatial distribution of. The ten sce- narios for the weights in the HSI model corresponding to water temperatures at depth of 2.5m, 25m and 50m were as follows: Case 1 [0, 1, 0], Case 2 [0, 0, 1], Case 3 [0.1, 0.8, 0.1], Case 4 [0.1, 0.1, 0.8], Case 5 [0.25, 0.5, 0.25], Case 6 [0.25, 0.25, 0.5], Case 7 [0.5, 0.25, 0.25], Case 8 [0.333, 0.333, 0.333], Case 9 [0.8, 0.1, 0.1], Case 10 [1, 0, 0] (Yu., 2018). The WAMM-based HSI model was finally determined as the following equation (Gong., 2012):
whereSIis the predictedvalues for each variablebased on the fitted SI model;wis the weight of variable;is the number of environmental variables included in the HSI model. Thevalues were predicted under the ten weighting scenarios. All thevalues varied from 0 to 1. The areas with<0.2, 0.2≤≤0.6 and with>0.6 were defined as poor habitat, common habitat and suitable habitat, respectively, forfishery.
The final step was to select, validate and test the optimal HSI model by examining the model prediction performance. First, the monthly SI model for each environmental variable was statistically analyzed and tested. Se- cond, the HSI model was constructed by the data between 2006 and 2014. All the predicted HSIs on the fishing ground ofwere tested by examining the percentages of catch and fishing effort corresponding to fiveclass intervals (0.0–0.2, 0.2–0.4, 0.4–0.6, 0.6–0.8, 0.8–1.0) un- der ten weighting-based HSI models. Generally, the percentage of catch and fishing effort increased with thevalues (Gong., 2011). In general, with the increasedvalues, the percentages of catch/fishing effort account- ing for the total catches/fishing efforts also increased. Based on this HSI theory, the optimal HSI model with the best model performance was selected. Ultimately, the data in 2015 were used to cross-validate the optimal HSI model. Percentages of catch, fishing effort, and averaged CPUE in 2015 within differentclass interval were examined.
2.4 Evaluating the Impacts of PDO Regime Shift on S. japonicus Habitat
To examine the variations in the vertical water tempe- rature and its response to PDO, the water temperature ano- malies (the anomaly at different depth is how different the water temperature at a particular location at a particular time is from the average temperatures for that place) at depths of 2.5m, 25m and 50m from 1977 to 2015 were de- termined and compared between the warm and cold PDO phases. Statistical relationship between the PDO index and water temperature anomaly at different depths was exam- ined based on the correlation analysis (Igarashi., 2017). We further showed the spatial distribution of the correla- tion coefficient during the study period on the fishing ground of. Spatial distribution of the averaged water temperature anomalies at depths of 2.5m, 25m, and 50m during the warm and cold PDO were also drawn.
To detect the variations of habitat range and distribution ofunder different PDO phases, spatial distribu- tion of the averagedunder warm and cold PDO regimes was examined. Interannual-to-decadal variability in yearly averageanomaly (the anomaly at a particular location at a particular time is how different theis from the averagefor that place) from July to Septem- ber were further determined and compared during the warm and cold PDO phases. Spatial distribution of the predictedanomaly was also mapped in each PDO phase. Addi- tionally, spatial distributions of the isoline of the suitable habitat (=0.6) were drawn in the warm and cold PDO phases to identify the changes of habitat distribution. Spa- tial distribution of the isoline of the most suitable water temperature at depths of 2.5m, 25m, and 50m ofwere also mapped from July to September in each PDO phase. The most suitable water temperature at different depths was determined by the fittedcurves (., the water temperature at whichwas equal to 1).
3 Results
3.1 The HSI Model Results
Table 1 and Fig.1 showed the statistical analysis of mon- thly fittedcurves for each environmental condition from July to September. All the SI models were significantly with high correlation coefficients, while the only exception was the SI model for water temperature at 50m in September. The fittedcurves were consistent with the observedvalues. Comparing the frequency of fishing effort and catch within differentclass intervals estimated from ten weighting-based HSI models, it was found that the poor habitat yielded high fishing efforts and cat- ches from Case 1 to Case 8, implying that these cases couldnot output reliablepredictions (Fig.2). Comparing Case9 and Case 10, Case 9 yielded the lowest percentage of fish- ing effort and catch withinfrom 0.0 to 0.2, and the highest percentage of fishing effort and catch occurred inbetween 0.6 and 1.0. Thus, case 9 was considered as the optimal HSI model to predict habitat suitability forin the ECS from July to September.

Table 1 Statistical analysis of monthly fitted suitability index (SI) curve of water temperatures at different depths for Scomber japonicus in the East China Sea

Fig.1 Fishing effort-based fitted suitability index (SI) curves of water temperatures at depths of 2.5m, 25m and 50m for Scomber japonicus from July to September in the East China Sea.
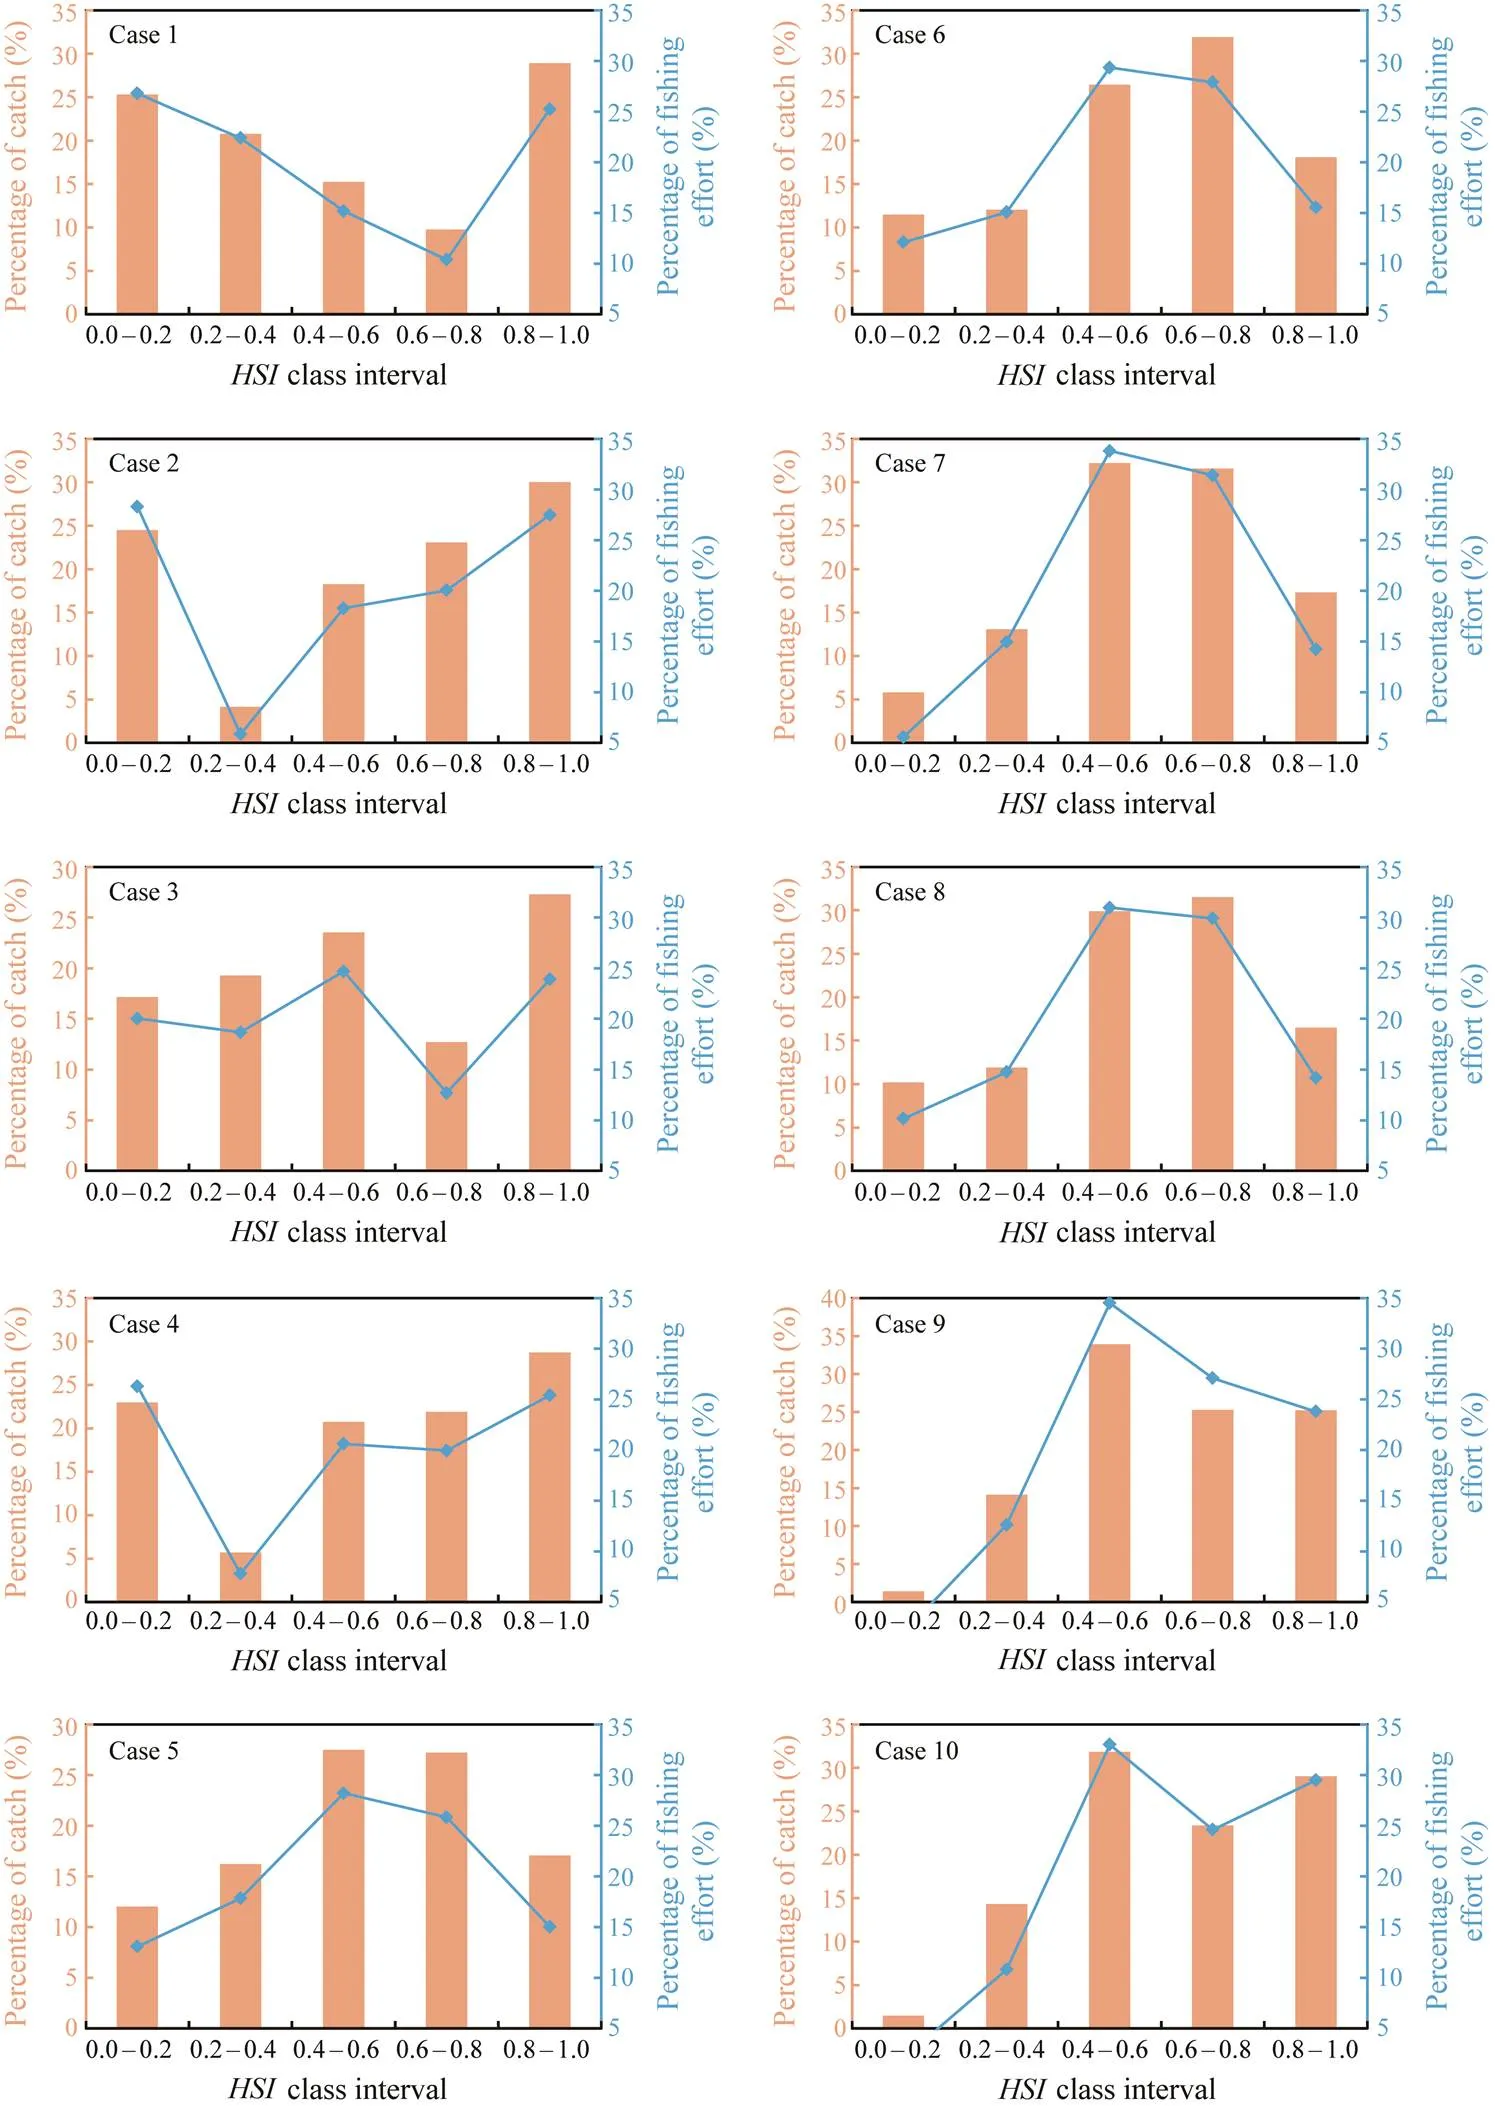
Fig.2 Percentages of catch and fishing effort from 2006 to 2014 corresponding to five habitat suitability index (HSI) class intervals (0.0–0.2, 0.2–0.4, 0.4–0.6, 0.6–0.8, 0.8–1.0) under different weighting-based HSI models.
The optimal HSI model selected from case 9 was used to forecast the habitat quality in 2015 and matched with the actual fisheries data. The percentages of fishing effort, catch and CPUE within differentclass intervals were shown in Fig.3. It was found that most of the fishing efforts and catches occurred inclass interval between 0.6–0.8 and 0.8–1.0. Only a small proportion of fishing efforts and catches occupied the waters in the poor habitat withinranging from 0.0 to 0.2. No fishing effort and catch were distributed in the common habitat withvarying from 0.2 to 0.6. Moreover, the CPUE significant- ly increased with theclass interval. It was 5, 9.7 and 12.8 ton per haul in theclass interval between 0.0–0.2, 0.6–0.8, and 0.8–1.0, respectively.

Fig.3 Percentages of catch and fishing effort, and averaged catch-per-unit-effort (CPUE) in 2015 within different habitat suitability index (HSI) class interval based on the HSI model from case 9.
3.2 Correlation Between PDO and Water Temperature at Different Depths
Correlation analysis revealed a significant negative relationship between the PDO index and water temperature anomaly at depths of 2.5m, 25m and 50m (Fig.4), imply- ing that the warm PDO would yield cool waters, whereas the cold PDO would yield warm waters on the fishing ground ofin the ECS. The water temperature ano- maly at the three layers on the fishing ground offrom 1977 to 2015 were further examined (Fig.4). It tended to be low in a warm PDO phase and high within a cold PDO phase, consistent with the results of spatial cor- relation analysis. Spatial distributions of the averaged wa- ter temperature anomaly at different depths were drawn in Fig.5 for each PDO phase. Clearly, extensive waters with negative water temperature anomaly were distributed on the fishing ground ofduring the warm PDO phase, and the waters were extremely cold in the southwestern regions of the fishing ground at depths of 25m and 50m. On the contrary, positive water temperature ano- maly was found in the cold PDO phase, in particularly, the waters tended to be anomalously warm at depths of 25m and 50m.

Fig.4 Spatial distribution of the correlation coefficients between the Pacific Decadal Oscillation (PDO) index and the water temperature anomaliesat depths of 2.5m, 25m and 50m from 1977 to 2015 (upper panel), and the water temperature anomalies at depths of 2.5m, 25m and 50m from July to September between 1977 and 2015 (lower panel), the red- shaded water temperature anomaly corresponded to warm PDO phase (1977–1998), the blue-shaded water temperature anomaly corresponded to cold PDO phase (1999–2015).

Fig.5 Spatial distribution of the averaged water temperature anomaly at depths of 2.5m, 25m, and 50m during the warm Pacific Decadal Oscillation (PDO) phase (1977–1998, left panel) and cold PDO phase (1999–2015, right panel) from July to September between 1977 and 2015.
3.3 Impacts of PDO on Habitat Range and Distribution of S. japonicus
In order to evaluate the impacts of PDO on habitat pat- tern of, the habitat range and its spatial dis- tribution were examined under different PDO regimes. It was observed that the range of suitable habitats and its geo- graphical distribution exhibited large differences between the warm and cold PDO regimes. First, suitable habitats in both PDO phases were distributed along the main axis of the Kuroshio Current. However, regarding to the habitat quality, the habitat suitability ofwas much higher in the cold PDO phase than that in the warm PDO phase (Fig.6, upper panel). Large ranges of poor habitats occurred in the coastal waters of China and northwest re- gions of the fishing ground in the warm PDO phase. How- ever, in the cold PDO phase, the poor habitats dramati- cally decreased, the common and suitable habitat enlarged. Second, theanomaly was compared between the warm and cold PDO phases (Fig.6, middle panel). It was appa- rent that theanomaly was low within the warm PDO phase and high in the cold PDO phase, implying that the habitat quality was unfavorable in the warm phase and fa- vorable in the cold PDO phase forComparing theanomaly in space between the two PDO phases, thequality in the warm PDO regime tended to de- crease in the northwestern and southeastern regions of the fishing ground, while it increased a little bit along the mainaxis of the Kuroshio Current (Fig.6, lower panel). It show- ed the opposite patterns in the cold PDO phase. With re- spect to the spatial distribution of suitable habitats ofrelative to the cold PDO phase, the suitable ha- bitats moved southeastward in the warm PDO phase (Fig.7). Correspondingly, the monthly preferred water tempera- ture at depths of 2.5m, 25m and 50m forall shifted southeastward (Fig.8).
4 Discussion
Under climate variability, global marine species have the potential to change their geographical location and redis- tribute from the original regions, especially in the sensi- tive oceans (Hollowed., 2013; Kibria., 2017). In general, large-scale climate variability strongly affects re- gional ocean conditions, and the changing oceanic envi- ronments have a major impact on marine fish life cycles, such as reproduction time and location, the larvae recruit- ment and transport, habitat range and spatial distribution (Pecl and Jackson, 2008; Brander, 2010). Therefore, under-standing how climatic and environmental variability at dif- ferent spatial and temporal scales affect habitat pattern of pelagic fish species is very important for fish sustainable exploitation and effective management (Anderson and Rod- house, 2001). Habitat modeling approach is an important and also popular tool to predict spatial-temporal habitat distributions of marine species, and explore the potential impacts of climate variability (Yu., 2015; Silva., 2016; Yen., 2017; Yi., 2017). In the present study,temperatures at three critical water layers (2.5m, 25m, 50m) were used as predictors to develop an integrated HSI model foron the fishing ground in the ECS. Based on this model, the impacts of PDO regime shift on habitat range and distribution ofwere detect- ed over the period of 1977–2015.

Fig.6 Mapping the predicted habitat suitability index (HSI) values on the fishing ground of Scomber japonicus (upper panel),the monthly averaged HSI anomaly (middle panel) and spatial distribution of the HSI anomaly (lower panel) during the warm Pacific Decadal Oscillation (PDO) phase (1977–1998) and cold PDO phase (1999–2015) from July to September between 1977 and 2015.

Fig.7 Spatial distribution of the isoline of the suitable habitat (HSI=0.6) during the warm Pacific Decadal Oscillation (PDO) phase (1977–1998, red line) and cold PDO phase (1999–2015, blue line) from July to September.

Fig.8 Spatial distribution of the isoline of the most suitable water temperature at depths of 2.5m, 25m, and 50m for Scom- ber japonicus in the East China Sea during the warm Pacific Decadal Oscillation (PDO) phase (1977–1998, red line) and cold PDO phase (1999–2015, blue line) from July to September.
Some issues should be discussed concerning the HSI mo- del construction. First, why the vertical water temperature was selected to construct the HSI model? There were many different models to detecthabitats, most of the models used environmental variables such as SST, SSS, NPP, SSH, and so on (Chen., 2009; Li., 2014a; Yu., 2018). However, none of them considered the vertical water temperature differences.mainlyfed on zooplankton such as crustaceans, including euphau- siacea, copepods, endopods,. Some small fishes were also in the food list, such as clupeiformes, perciformes and small cuttlefish (Yoon., 2008; Takagi., 2009). These preys performed vertical movement from day to night. At night, these zooplanktons migrate to the surface or subsurface waters (Hazen and Johnston, 2010). There- fore, adultmoved with their preys into the surface waters at the depths from 0 to 50m in summer. Vertical water temperature played an important role in the spatial distribution of food concentration and physiological metabolism for fish species (Yang., 2019). Thus, temperatures at depths of 2.5m, 25m, and 50m were included in this study.
Second, for Chinese purse seine fishery, CPUE was referred to the ratio of accumulative catches and fishing sets based on the assumption that fishing effort was randomly distributed relative to environments (Li., 2014a). During the actual fishing period, fishermen tend to fish in one area if the catch rate remains at a high level. They have to move to another region if the catch rate dramatically drops (Li., 2014a). In fact, fishing effort showed nor- mal distribution or skewed distribution in relation to va- rious environmental factors (Chen., 2009; Yu., 2018). Thus, using CPUE to fit the SI model may underestimate or overestimate the suitability for. Li. (2014a),while fishing effort is a better input in the HSI model than CPUE. Thus, the SI models were fitted according to the fishing effort in this study, not CPUE. In addition, ten weighting scenarios were considered for the inputs of the HSI model. In general, the AMM method isregarded as a good way to aggregate the finalvalues (Tian., 2009). However, this method assumed all the input environments contribute equally to the spatial and temporal distribution of habitat hotspots (Xue., 2017). In this study, to highlight the various contributions of wa- ter temperatures at different depths, the weighting-based AMM model was applied. Not surprisingly, the surface wa- ter temperature at 2.5m was the most important thermal con-dition forhabitat formation. Although the HSI model in this study has been well developed and validated,some biases still exist. For example, the input factors as in-dicators of food availability were not considered in this mo- del.
The PDO has shown significant impacts on pelagic fish species. The first report on PDO impacts explored its relationship with adult salmon catches in the Northeast Pacific Ocean. The authors noted that the cold PDO phase from 1947 to 1976 coincided with high returns of Chinook salmon and coho salmon to Oregon rivers, while the warm PDO phase from 1977 to 1998 was consistent with steadily declined salmon numbers (Mantua., 1997). More recent studies have paid attentions to assess the im- pacts of decadal-scale climate variability (., PDO) on Pacific fish species. For example, the recruitment of Pa- cific sardinewas directly related to the PDO. The warm PDO yields high recruitment of sardine, while the cold PDO decreases the recruitment (Zwolinski and Demer, 2013). Strong associations were found between albacore CPUEs in the Northeastern Pacific with regional SST and climate environmental variables including PDO. The PDO index showed a significantly negative impact on albacore stock (Phillips., 2014). Moreover, habitat range and distribution of the short-lived squid species in the Pacific Ocean, such as the autumn cohort of Japanese flying squidin the Japan Sea and the western Pacific Ocean off Japan, the neon flying squidand the jumbo flying squidin the Southeastern Pacific Ocean off Peru, were related to PDO-driven local environmental variabilities (Yu., 2017; Wu., 2018; Wen., 2020).
In this study, the PDO phenomenon was linked to va- riations in the vertical water temperature on the fishing ground and habitat pattern ofin the ECS. It was found that the vertical water temperature at depths 0–50m became extremely cold in the warm PDO phase and anomalously warm in the cold PDOphase. Yu. (2018) examined the relationship between habitat quality ofand SST, and they concluded that negative rela- tionship was revealed between them. Therefore, the cool vertical water temperature during the warm PDO regime might be unfavorable for the growth ofand led to low-quality habitats. The following findings were con- sistent with above-mentioned inference. The range of suit-able habitats and its spatial distribution exhibited large dif- ferences between the warm (1977–1998) and cold (1998–2015) PDO regimes.
According to the results, the potential mechanism how the PDO affects habitat range and distribution ofin the ECS is deduced in this study. During a warm PDO regime, due to unfavorably cool vertical water temperature, the habitat quality ofwas likely to decrease, thus, suitable habitat ranges reduced. Moreover, the monthly preferred water temperature at depths of 2.5m, 25m and 50m forall shifted southeastward,because fish species preferred to inhabit in suitable environments. Once the environments became unfavorable, they would immediately move to more suitable regions (Za- inuddin., 2006, 2008). Therefore, the spatial distri- bution of potential habitat was consistent with the pre-ferred environmental conditions. Consequently, suitable ha- bitats moved southeast, similar to the movement of the preferred water temperature at different depths. Converse- ly, in a cool PDO regime, with the warmer vertical water temperature and northwestward shift of the preferred water temperature, the suitable habitats enlarged and migrated in the same direction. Our findings indicate that the PDO regime shift indeed produced significant impacts on ha- bitat range and distribution ofin the ECS.
Acknowledgements
This study was financially supported by the National Key R&D Program of China (No. 2018YFD0900906), the National Natural Science Foundation of China (No. 4190 6073), the Natural Science Foundation of Shanghai (No. 19ZR1423000) and the Shanghai Universities First-Class Disciplines Project (Fisheries A).
Anderson, C. I., and Rodhouse, P. G., 2001. Life cycles, oceano- graphy and variability: Ommastrephid squid in variable oceano- graphic environments., 54 (1): 133-143.
Anthony, K. J., and Allen, C. A., 2011. The influence of the ocean environment on the abundance of market squid,, paralarvae in the southern California Bight., 52: 205-213.
Brander, K., 2010. Impacts of climate change on fisheries., 79: 389-402.
Chen, X. J., Li, G., Feng, B., and Tian, S. Q., 2009. Habitat suit- ability index of Chub mackerel () from July to September in the East China Sea., 65 (1): 93-102.
Chen, X. J., Tian, S. Q., and Guan, W. J., 2014. Variations of ocea- nic fronts and their influence on the fishing grounds ofin the Northwest Pacific., 33 (4): 45-54.
Chen, X. J., Tian, S. Q., Chen, Y., and Liu, B. L., 2010. A mo- deling approach to identify optimal habitat and suitable fishing grounds for neon flying squid () in the Northwest Pacific Ocean., 108 (1): 1- 14.
FAO (Food and Agriculture Organization of the United Nations), 2018. The state of world fisheries and aquaculture. FAO Fish- eries and Aquaculture Department, Rome.
Gong, C. X., Chen, X. J., Gao, F., and Chen, Y., 2012. Importance of weighting for multi-variable habitat suitability index model: A case study of winter-spring cohort ofin the northwestern Pacific Ocean., 11 (2): 241-248.
Gong, C. X., Chen, X. J., Gao, F., Guan, W. J., and Lei, L., 2011. Review on habitat suitability index in fishery science., 20 (2): 260-269 (in Chinese with English abstract).
Guan, W. J., Chen, X. J., Gao, F., and Li, G., 2013. Study on the dynamics of biomass of chub mackerel based on ocean net primary production in southern East China Sea., 35 (5): 121-127 (in Chinese with English ab- stract).
Guo, A., Zhang, Y., Yu, W., Chen, X. J., Qian, W. G., and Li, Y. S., 2018. Influence of El Niño and La Niña with different intensity on habitat variation of chub mackerelin the coastal waters of China., 40 (12): 58-67 (in Chinese with English abstract).
Hazen, E. L., and Johnston, D. W., 2010. Meridional patterns in the deep scattering layers and top predator distribution in the central equatorial Pacific., 19 (6): 427- 433.
Hiyama, Y., Yoda, M., and Ohshimo, S., 2010. Stock size fluctua- tions in chub mackerel () in the East Chi- na Sea and the Japan/East Sea., 11 (6): 347-353.
列车运营日计划编配问题可表述为:在时刻表/车次信息、股道信息、车组信息已知情况下,对列车运营日计划表进行编配。列车运营日计划要满足道岔转换最小时间约束、早高峰指定车次约束、出库便捷性约束和唯一性约束,选用合适的良好车组去担当特定的列车车次。
Hollowed, A. B., Barange, M., Beamish, R. J., Brander, K., Co- chrane, K., Drinkwater, K.,., 2013. Projected impacts of climate change on marine fish and fisheries., 70 (5): 1023-1037.
Igarashi, H., Ichii, T., Sakai, M., Ishikawa, Y., Toyoda, T., Masu- da, S.,., 2017. Possible link between interannual variation of neon flying squid () abundance in the north pacific and the climate phase shift in 1998/99., 150: 20-34.
Kibria, G., Haroon, A. K. Y., and Nugegoda, D., 2017. Climate change impacts on tropical and temperate fisheries, aquaculture, and seafood security and implications-a review., 22: 1-29.
Li, G., and Chen, X. J., 2007. Tempo-spatial characteristic ana- lysis of the mackerel resource and its fishing ground in the East China Sea., 37 (6): 921-926 (in Chinese with English abstract).
Li, G., and Chen, X. J., 2009. Study on the relationship between catch of mackerel and environmental factors in the East Chi- na Sea in summer., 27 (1): 1-8 (in Chinese with English abstract).
Li, G., Chen, X. J., Lei, L., and Guan, W. J., 2014a. Distribution of hotspots of chub mackerel based on remote-sensing data in coastal waters of China., 35 (11-12): 4399-4421 (in Chinese with English abstract).
Li, Y. S., 2012. Simulation study of ecological dynamics of early life history of Chub mackerel () in the East China Sea. PhD thesis. Shanghai Ocean University (in Chi- nese with English abstract).
Li, Y. S., Chen, X. J., Chen, C. S., Ge, J. Z., Ji, R. B., Tian, R. C.,., 2014b. Dispersal and survival of chub mackerel () larvae in the East China Sea., 283: 70-84.
Li, Y. S., Pan, L. Z., and Chen, X. J., 2014c. Effect of spawning ground location on the transport and growth of chub mackerel () eggs and larvae in the East China Sea., 34 (2): 92-97.
Mantua, N. J., and Hare, S. R., 2002. The Pacific decadal oscillation., 58 (1): 35-44.
Mantua, N. J., Hare, S. R., Zhang, Y., Wallace, J. M., and Francis, R. C., 1997. A Pacific interdecadal climate oscillation with impacts on salmon production., 78 (6): 1069-1079.
Masumoto, Y., Sasaki, H., Kagimoto, T., Komori, N., Ishida, A., Sasai, Y.,., 2004. A fifty-year eddy-resolving simulation of the world ocean: Preliminary outcomes of OFES (OGCM for the Earth Simulator)., 1: 35-56.
Pecl, G. T., and Jackson, G. D., 2008. The potential impacts of cli- mate change on inshore squid: Biology, ecology and fisheries., 18 (4): 373-385.
Phillips, A. J., Ciannelli, L., Brodeur, R. D., Pearcy, W. G., and Chil- ders, J., 2014. Spatio-temporal associations of albacore CPUEs in the northeastern Pacific with regional SST and climate environmental variables., 71 (7): 1717-1727.
Shiraishi, T., Okamoto, K., Yoneda, M., Sakai, T., Ohshimo, S., Onoe, S.,., 2008. Age validation, growth and annual reproductive cycle of chub mackereloff the waters of northern Kyushu and in the East China Sea., 74 (5): 947-954.
Silva, C., Andrade, I., Yáñez, E., Hormazabal, S., Barbieri, M. Á., Aranis, A.,., 2016. Predicting habitat suitability and geo- graphic distribution of anchovy () due to cli- mate change in the coastal areas off Chile., 146: 159-174.
Taga, M., Kamimura, Y., and Yamashita, Y., 2019. Effects of wa-ter temperature and prey density on recent growth of chub mac- kerellarvae and juveniles along the Paci- fic coast of Boso-Kashimanada., 85: 931- 942.
Taguchi, B., Xie, S. P., Schneider, N., Nonaka, M., Sasaki, H., and Sasai, Y., 2007. Decadal variability of the Kuroshio Extension: Observations and an eddy-resolving model hindcast., 20 (11): 2357-2377.
Takagi, K., Yatsu, A., Itoh, H., Moku, M., and Nishida, H., 2009. Comparison of feeding habits of myctophid fishes and juvenile small epipelagic fishes in the western North Pacific., 156 (4): 641-659.
Tian, S. Q., Chen, X. J., Chen, Y., Xu, L. X., and Dai, X. J., 2009. Evaluating habitat suitability indices derived from CPUE and fishing effort data forin the north- western Pacific Ocean., 95 (2-3): 181-188.
Tian, Y. J., Ueno, Y., Suda, M., and Akamine, T., 2004. Decadal variability in the abundance of Pacific saury and its response to climatic/oceanic regime shifts in the northwestern subtro- pical Pacific during the last half century., 52: 235-257.
Watanabe, C., and Yatsu, A., 2006. Long-term changes in ma- turity at age of chub mackerel () in relation to population declines in the waters off northeastern Japan., 78 (2-3): 323-332.
Watanabe, C., Yatsu, A., and Watanabe, Y., 2002. Changes in growthwith fluctuation of chub mackerel abundance in the Pacific wa- ters off central Japan from 1970 to 1997., 60: 60-62.
Wen, J., Lu, X. Y., Yu, W., Chen, X. J., and Liu, B. L., 2020. De- cadal variations in habitat suitability ofin the Southeast Pacific Ocean off Peru., 42 (6): 36-43 (in Chinese with English abstract).
Wu, S. N., Yu, W., and Chen, X. J., 2018. Variations in environ- mental conditions on the spawning grounds of autumn cohort ofand their impacts on squid abundance., 40 (02): 129-138.
Xue, Y., Guan, L. S., Tanaka, K., Li, Z. G., Chen, Y., and Ren, Y. P., 2017. Evaluating effects of rescaling and weighting data on habitat suitability modeling., 188: 84- 94.
Yamada, T., Aoki, I., and Mitani, I., 1998. Spawning time, spawn-ing frequency and fecundity of Japanese chub mackerel,in the waters around the Izu Islands, Japan., 38 (1): 83-89.
Yang, S. L., Zhang, B. B., Zhang, H., Zhang, S. M., Wu, Y. M., Zhou, W. F.,., 2019. A review: Vertical swimming and dis- tribution of yellowfin tuna.,38 (1): 119-126.
Yasuda, T., Yukami, R., and Ohshimo, S., 2014. Fishing ground hotspots reveal long-term variation in chub mackerelhabitat in the East China Sea., 501: 239-250.
Yatsu, A., Watanabe, T., Ishida, M., Sugisaki, H., and Jacobson, L. D., 2005. Environmental effects on recruitment and productivity of Japanese sardineand chubmackerelwith recommendations for ma- nagement., 14 (4): 263-278.
Yen, K. W., Wang, G., and Lu, H. J., 2017. Evaluating habitat suit- ability and relative abundance of skipjack () in the western and central Pacific during various El Niño events., 139: 153-160.
Yi, Y., Cheng, X., Yang, Z., Wieprecht, S., Zhang, S., and Wu, Y., 2017. Evaluating the ecological influence of hydraulic projects: A review of aquatic habitat suitability models., 68: 748-762.
Yoon, S. J., Kim, D. H., Baeck, G. W., and Kim, J. W., 2008. Feed- ing habits of chub mackerel () in the South Sea of Korea., 41 (1): 26-31.
Yu, W., Chen, X. J., and Yi, Q., 2017. Analysis of variations in the environmental conditions on the fishing ground of neon flying squid () in the Northwestern Pacific Ocean under different climate modes., 41 (4): 525-534 (in Chinese with English ab- stract).
Yu, W., Chen, X. J., Yi, Q., Chen, Y., and Zhang, Y., 2015. Vari- ability of suitable habitat of western winter-spring cohort for neon flying squid in the Northwest Pacific under anomalous environments., 10 (4): e0122997.
Yu, W., Guo, A., Zhang, Y., Chen, X. J., Qian, W. G., and Li, Y. S., 2018. Climate-induced habitat suitability variations of chub mackerelin the East China Sea., 207: 63-73.
Yu, W., Yi, Q., Chen, X. J., and Chen, Y., 2016. Modelling the effects of climate variability on habitat suitability of jumbo flying squid,, in the Southeast Pacific Ocean off Peru., 73 (2): 239-249.
Zainuddin, M., Kiyofuji, H., Saitoh, K., and Saitoh, S. I., 2006. Using multi-sensor satelliteremote sensing and catch data to detect ocean hot spots for albacore () in the northwestern North Pacific., 53: 419- 431.
Zainuddin, M., Saitoh, K., and Saitoh, S. I., 2008. Albacore () fishing ground in relation to oceanographic con-ditions in the western North Pacific Ocean using remotely sensed satellite data., 17: 61-73.
Zhang, Y., Wallace, J. M., and Battisti, D. S., 1997. ENSO-like interdecadal variability: 1900–93., 10: 1004- 1020.
Zheng, B., Chen, X. J., and Li, G., 2008. Relationship between the resource and fishing ground of mackerel and environmen- tal factors based on GAM and GLM models in the East China Sea and Yellow Sea., 32 (3): 379- 386.
Zwolinski, J. P., and Demer, D. A., 2013. Environmental and pa- rental control of Pacific sardine () recruitment., 71 (8): 2198-2207.
September 7, 2020;
December 11, 2020;
February 2, 2021
© Ocean University of China, Science Press and Springer-Verlag GmbH Germany 2021
. Tel: 0086-21-61900306
E-mail: liys@shou.edu.cn
(Edited by Qiu Yantao)
猜你喜欢
铁路通信信号工程技术(2022年6期)2022-06-27
铁道运营技术(2020年4期)2020-10-13
铁道通信信号(2020年6期)2020-09-21
中国石油石化(2020年11期)2020-07-07
知识窗(2019年5期)2019-06-03
小哥白尼·军事科学画报(2019年12期)2019-03-02
测控技术(2018年10期)2018-11-25
现代城市轨道交通(2016年6期)2017-01-05
铁道通信信号(2016年2期)2016-06-01
城市轨道交通研究(2015年3期)2015-02-27
 Journal of Ocean University of China2021年6期
- Journal of Ocean University of China的其它文章
- Meshless Method with Domain Decomposition for Submerged Porous Breakwaters in Waves
- Facial Features of an Air Gun Array Wavelet in the Time-Frequency Domain Based on Marine Vertical Cables
- Magma Evolution Processes in the Southern Okinawa Trough:Insights from Melt Inclusions
- Summery Intra-Tidal Variations of Suspended Sediment Transportation–Topographical Response and Dynamical Mechanism in the Aoshan Bay and Surrounding Area, Shandong Peninsula
- High-Resolution Geochemical Records in the Inner Shelf Mud Wedge of the East China Sea and Their Indication to the Holocene Monsoon Climatic Changes and Events
- Geological Guided Tomography Inversion Based on Fault Constraint and Its Application