
光纤网络在线监测管理系统优化设计
2021-12-28 23:23:05朱云杰
计算机时代
2021年12期
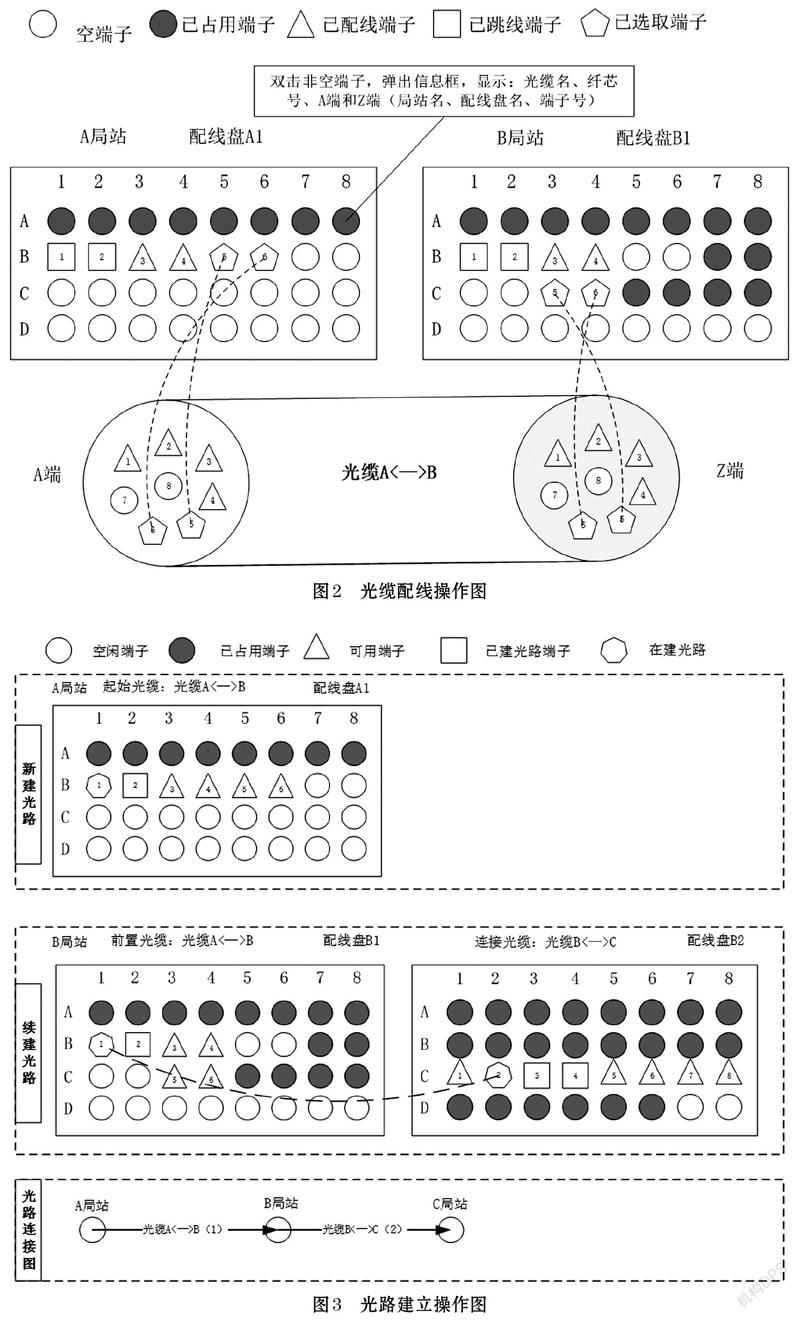
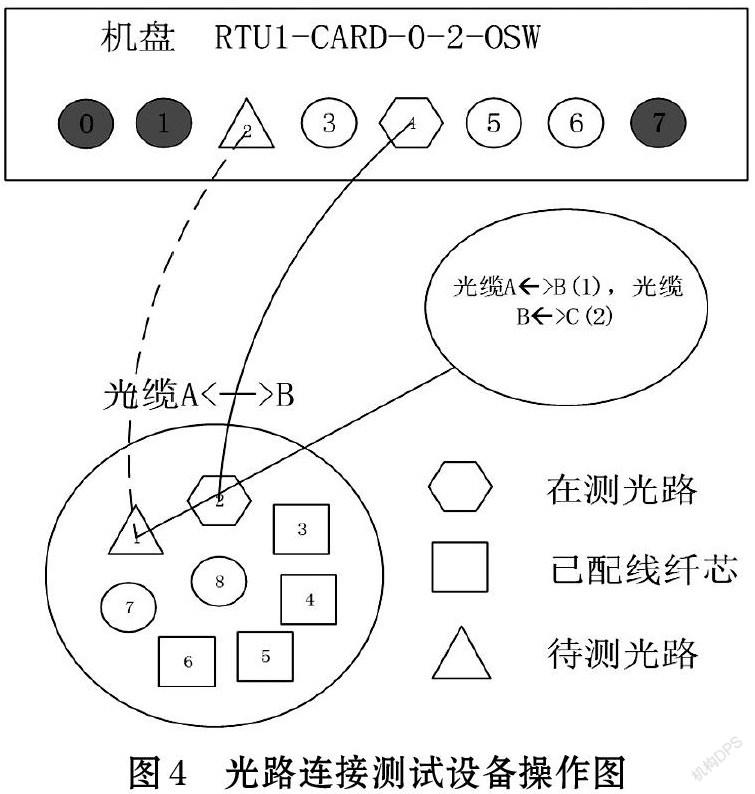
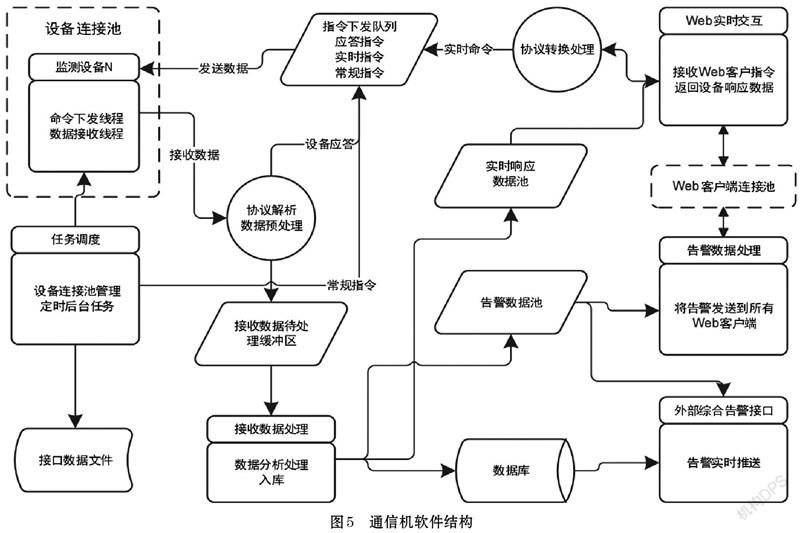
摘 要: 针对光纤网络在线监测系统在使用过程中存在诸如创建光路等操作繁琐、告警数据展现不实时、监测设备可扩展性差以及测试数据分析不够准确的问题,采用WebGIS、HTML5和WebSocket等技术对其进行优化改造。系统中增加了通信机,并采用一种基于小波变换动态降噪的方法进行OTDR曲线数据分析,实现了操作可视化、告警数据实时展现、兼容不同协议的监测设备,大幅提升OTDR曲线数据分析的快速性和准确性。
关键词: 网络地理信息系统; 小波变换; 通信机; 可视化操作
中图分类号:TP399 文献标识码:A 文章编号:1006-8228(2021)12-31-05
Abstract: Aiming at the problems of cumbersome operation such as creating optical path, non real-time display of alarm data, poor scalability of monitoring equipment and inaccurate analysis of test data in the use of optical fiber network online monitoring system, the WebGIS, HTML5 and WebSocket technologies are used to optimize and update it. A communication machine is added to the system, and a method of dynamic noise reduction based on wavelet transform is used for OTDR curve data analysis, which realizes visualized operation, real-time display of alarm data and compatible with monitoring equipment of different protocols, and greatly improves the rapidity and accuracy of OTDR curve data analysis.
Key words: WebGIS; wavelet transform; communication machine; visualized operation
0 引言
目前的智能光纤网络在线监测管理系统WebGIS[1-2]是基于富客户端技术flex开发。flex的特点及优势是作为浏览器插件,有跨平台,较炫的视觉效果而出名,缺陷是开发的swc包在浏览器端部署比较庞大,且没有flashbuilder就无法有效调试。
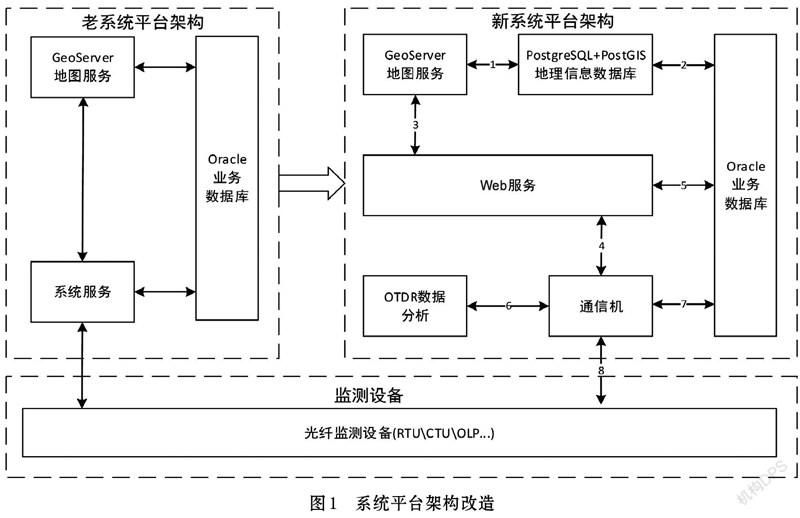
随着浏览器平台的去插件化潮流,html5[3-4]技术兴起并成熟,诸多本属于flex的優势如动画等特效已经可以基于纯浏览器端开发,移动端平台日益重要且不再支持flex,原系统由flex升级到html5正是时候。原系统功能全部在Web服务端实现,业务逻辑采用紧耦合方式,明显的缺点是系统的扩展性差,采用WebSocket[5]和分布式技术,将Web服务端拆成若干逻辑内聚性强的独立服务。OTDR测试曲线数据分析是系统的核心算法,原来的算法因曲线数据中夹杂的环境噪声数据而影响分析的准确性问题比较大,因此采用一种基于小波变换动态降噪的OTDR曲线数据分析方法[6],也是系统优化的重点。……
登录APP查看全文
