
Genome-wide association study identifies quantitative trait loci affecting cattle temperament
2022-01-27 08:22JiaFeiShenQiuMingChenFengWeiZhangQuratulainHanifBiZhiHuangNingBoChenKaiXingQuJingXiZhanHongChenYuJiangChuZhaoLei
Zoological Research 2022年1期
Jia-Fei Shen, Qiu-Ming Chen, Feng-Wei Zhang, Quratulain Hanif, Bi-Zhi Huang, Ning-Bo Chen, Kai-Xing Qu,Jing-Xi Zhan, Hong Chen, Yu Jiang,*, Chu-Zhao Lei,*
1 Key Laboratory of Animal Genetics, Breeding and Reproduction of Shaanxi Province, College of Animal Science and Technology,Northwest A&F University, Yangling, Shaanxi 712100, China
2 College of Animal Science, Xinjiang Agricultural University, Urumqi, Xinjiang 830052, China
3 National Institute for Biotechnology and Genetic Engineering, Pakistan Institute of Engineering and Applied Sciences, Faisalabad 577,Pakistan
4 Yunnan Academy of Grassland and Animal Science, Kunming, Yunnan 650212, China
5 Academy of Science and Technology, Chuxiong Normal University, Chuxiong, Yunnan 675000, China
ABSTRACT Cattle temperament is an interesting trait due to its correlation with production efficiency, labor safety,and animal welfare.To date, however, its genetic basis is not clearly understood.Here, we performed a genome-wide association study for a series of temperament traits in cattle, assessed with via open field and novel object tests, using autosomal single nucleotide polymorphisms (SNPs) derived from the whole-genome sequence.We identified 37 and 29 genome-wide significant loci in the open field and novel object tests, respectively.Gene set analysis revealed the most significant pathway was the neuroactive ligand-receptor interaction pathway,which may be essential for emotional control in cattle.Analysis of the expression levels of 18 tissuespecific genes based on transcriptomic data showed enrichment in the brain, with some candidate genes involved in psychiatric and neurodegenerative diseases in humans.Based on principal component analysis, the first principal component explained the largest variance in the open field and novel object test data, and the most significant loci were assigned to SORCS3 and SESTD1, respectively.Our findings should help facilitate cattle breeding for sound temperament by pyramiding favorable alleles to further improve cattle production.
Keywords: Cattle temperament; Open field test;Novel object test; SORCS3; SESTD1
INTRODUCTION
Animal temperament is usually used to describe a series of behavioral differences in response to human handling and challenging situations, and comprises various phenotypes,including docility, aggressiveness, flight reactivity, sensitivity,and response to novelty.Individual differences in temperament can be impacted by genetics, age, sex, and environment (Hoppe et al., 2010).Temperament is also a major part of bovine behavior and can influence animalwelfare, production, health, and fitness traits (Dos Santos et al., 2017; Haskell et al., 2014).For example, individuals with poorer temperament tend to exhibit lower average daily gain(Sant‘Anna et al., 2012), reduced reproductive efficiency(Phocas et al., 2006), lower milk production (Breuer et al.,2000), inferior meat quality (Hall et al., 2011), and higher morbidity (Fell et al., 1999).
Many measurement systems are used to determine animal temperament, e.g., open field test, novel object test, and heart rate variability.The open field test assesses numerous behavioral characteristics in animals, like reactivity towards social isolation (Friedrich et al., 2015).In model animals, the open field test is used to investigate physical responses during emotional stress (Koplik et al., 1995; Pijlman et al., 2003).The novel object test is used to assess an animal‘s responsiveness to novel stimuli (Gibbons et al., 2009) and has been used to study learning and memory by behavioral pharmacologists and neuroscientists (Bevins & Besheer,2006).Heart rate variability (HRV) is a suitable approach for determining the activity of the autonomous nervous system in the study of temperament (Graunke et al., 2013).
Cattle temperament has been of great interest since their domestication.Given different populations and metrical traits,there is a wide range of low to high heritabilities.For example,heritabilities for crush score and flight speed in Hereford cattle are 0.33 and 0.36, respectively (Hoppe et al., 2010), while heritability for flight speed in Nellore cattle is 0.21 (Valente et al., 2016).To date, many quantitative trait loci (QTL)accounting for variations in beef and dairy cattle temperament have been mapped, supporting a polygenic determinism(MacLeod et al., 2019).However, these studies have only used single nucleotide polymorphisms (SNPs) or microsatellite markers to conduct genome-wide association studies for a variety of temperament traits, such as aggressiveness at parturition (Vallée et al., 2016), reactivity (Santos et al., 2017),flight speed (Valente et al., 2016), flight from feeder, and social separation (Gutiérrez-Gil et al., 2008).
As the cost of genome sequencing has continued to decline,several studies have used genome-wide autosomal variation to perform genome-wide association mapping.For example, a recent genome-wide association study (GWAS) of hundreds of canine whole-genome sequences (WGS) explored the relationship of 16 phenotypes, including body weight, with genotype (Plassais et al., 2019).Furthermore, based on 25.4 million variants in the 1 000 Bull Genomes Run4 reference population of 1 147 WGS individuals, a GWAS meta-analysis revealed that 13.8% of variance in stature in cattle can be explained by 163 lead variants (Bouwman et al., 2018).However, few attempts have been made to identify candidate genes involved in cattle temperament using WGS data.
Brahman cattle (Bos indicus) are relatively flighty compared with B.taurus breeds (Burrow, 2001; Haskell et al., 2014).Yunling cattle are a typical hybrid breed of Brahman bull×Murray Grey bull/Yunnan indigenous cross cow, and thus are an ideal model for studying the genetic basis of complex traits, such as temperament.In this study, we examined 15 phenotypic traits using the open field test and 14 traits using the novel object test in Brahman and Yunling cattle, and then separately performed principal component analysis (PCA) for each test.We also conducted a GWAS based on the 29 traits and first principal component (PC1) of the open field and novel object tests using autosomal SNPs derived from WGS data.Our results provide new insights into the genetic basis of gentle temperament and provide information for the genetic improvement of domestic cattle and for studies on the mechanisms of behavioral abnormalities in humans and animals.
MATERIALS AND METHODS
Ethics statement
Ethics approval for all animal experiments was granted by the Institutional Animal Care and Use Committee of Northwest A&F University following the recommendations of the Regulations for the Administration of Affairs Concerning Experimental Animals of China.
Animal population
Animals used for the detection of temperament traits included both Brahman and Yunling cattle.Yunling cattle were bred by the Yunnan Academy of Grassland and Animal Science and all experimental animals were from its core breeding farm.All individuals were female, multiparous, and not at two weeks pre-calving, calving, and two weeks post-calving at the time of temperament assessment.In the feeding regime, the experimental animals comprised pen-feeding individuals and free-grazing individuals.The pen-feeding individuals were fed a total mixed ration (TMR) composed of 65% grass silage and 35% concentrate on a dry matter basis.The free-grazing individuals ate grass in the pasture during summer and autumn (from June to November) and were fed the abovementioned TMR during winter and spring (from December to May).
Temperament trait assessment
We combined the open field, novel object, and heart rate variability tests into a set of experiment procedures (Figure 1),with reference to previous studies (Friedrich et al., 2016;Graunke et al., 2013).The experiments were performed for each animal in an open field area.In total, 48 Brahman cattle(nine pen-feeding and 39 free-grazing) and 186 Yunling cattle(58 pen-feeding and 128 free-grazing) were selected for the behavioral experiments.The selected cattle were first walked through a single file raceway to a squeeze crush for the placement of a heart monitor system (Polar V800, Polar Electro, Finland), then walked into an open field area for acclimatization within 10 min, which was the period of open field test.Subsequently, for the novel object test, a yellow duck doll was placed in the center of the area for 5 min.The dimensions of the open field area and duck are shown in Supplementary Figure S1.During the test, the animal‘s behavior was recorded by a video camera.Total time of contact with the duck was calculated using a stopwatch.The quantification of sinus to quantification of sinus (QRS to QRS:RR) data series was downloaded and corrected with default parameters using gHRV v2.0 (Rodríguez-Liñares et al., 2014).The heart rate variability data consisted of the following:low/high frequency in open field test (LHO), ultra-lowfrequency in open field test (UFO), very low frequency in open field test (VFO), low frequency in open field test (LFO), high frequency in open field test (HFO), power in open field test(POO), mean heart rate in open field test (MHO), standard deviation of heart rate in open field test (HSO), proportion of interval differences of successive intervals greater than 50 ms in open field test (PNO), root mean square of successive differences in open field test (RMO), approximate entropy in open field test (APO), fractal dimension in open field test(FDO), low/high frequency in novel field test (LHN), ultra-low frequency in novel field test (UFN), very low frequency in novel field test (VFN), low frequency in novel field test (LFN),high frequency in novel field test (HFN), power in novel field test (PON), mean heart rate in novel field test (MHN),standard deviation of heart rate in novel field test (HSN),proportion of interval differences of successive intervals greater than 50 ms in novel field test (PNN), root mean square of successive differences in novel field test (RMN),approximate entropy in novel field test (APN), and fractal dimension in novel field test (FDN).The other five traits consisted of the number of steps the animal moved in open field test (STE), time of activity in open field test (ACT),number of vocalizations in open field test (VOC), time (s) until first lick or sniff of novel object (LAT), and total time (s) spent licking or sniffing novel object (DUR).The full name, definition,and significance of the 29 traits are shown in Figure 1 and Supplementary Table S1.Due to certain objective conditions,such as bad temperament, four Brahman cattle (two penfeeding and two free-grazing) and 10 Yunling cattle (seven pen-feeding and three free-grazing) did not complete the novel object test.

Figure 1 Schematic representation of open field test and novel object test
Phenotypic analysis
We used a general linear model to estimate the effect of breed on temperament traits with consideration of the effects of feeding regime using R (R Core Team, 2013) To investigate the relationships among temperament traits, and between temperament and body measurement traits, we calculated partial Pearson‘s correlations, adjusted for feeding regime and breed, using the ppcor package (Kim, 2015) in R.We performed PCA with the princomp function in R to condense several correlated measures into a small number of PCs.The Kaiser-Meyer-Olkin (KMO) measure of sampling adequacy was used to estimate the appropriateness of PCA using the REdaS package (Maier & Maier, 2015).The KMO values for the open field and novel object tests were 0.72 and 0.66,respectively.A correlation matrix with KMO>0.6 is considered sufficient to explain correlations between variables (Budaev,2010), therefore our data were appropriate for PCA.
Sample collection and genome sequencing
After completing all behavioral assessments, we collected ear tissue, whole blood, and body measurements from each animal in the squeeze crush.Genomic DNA was extracted from the ear tissues using standard phenol-chloroformprotocols (Green et al., 2012).The sequence data used were obtained from a previously published paper (Chen et al.,2020a).Detailed information on sampling and sequencing is provided in Supplementary Table S2.The whole blood and body measurement traits followed previous study (Chen et al.,2020b).
Read mapping and SNP calling
Firstly, we mapped clean reads to the cattle reference genome assembly GCF_002263795.1 using BWA-MEM with default parameters (Li & Durbin, 2009).Duplicate reads were filtered using the “REMOVE_DUPLICATES=true” option in Picard tools v2.26.2.Average alignment rate and coverage were 99.54% and 5.61×, respectively.The “HaplotypeCaller”,“GenotypeGVCFs”, and “SelectVariants” programs in the Genome analysis toolkit v3.8 (GATK) (Nekrutenko & Taylor,2012) were used for calling raw SNPs.“VariantFiltration” in the same toolkit was applied to all raw SNPs with the following options: QD<2, FS>60, MQRankSum<–12.5, ReadPosRank Sum<–8.0, and mean sequence depth (for all individuals)<1/3× and >3×.Haplotype-phase inference and missing allele imputation were produced using BEAGLE v5.2_21Apr21.304(Browning & Browning, 2007) for GWAS.Based on ~41 million autosomal SNPs, we estimated the eigenvectors using smartPCA in the EIGENSOFT v5.0 package (Patterson et al.,2006) to adjust population structure.Based on the genotype matrix, PC1 separated the Brahman and Yunling cattle(Supplementary Figure S2), as reported in previous study(Chen et al., 2020a).
GWAS analysis
A total of 13 006 271 SNPs and 12 948 424 SNPs were used in GWAS for the 15 traits in the open field test and 14 traits in the novel object test, respectively.The PC1 of each test also acted as a phenotype.For GWAS in the open field test, there were 30 Brahman genomes (five pen-feeding and 25 freegrazing) and 128 Yunling genomes (29 pen-feeding and 99 free-grazing).For GWAS in the novel object test, there were 29 Brahman genomes (five pen-feeding and 24 free-grazing)and 122 Yunling genomes (25 pen-feeding and 97 freegrazing).We carried out GWAS with a mixed linear model using the genome-wide efficient mixed-model association(GEMMA) software package (Zhou & Stephens, 2012).For two-breed GWAS, PC1 of autosomal SNPs, feeding regime,and breed information were defined as fixed effects.For within-Yunling cattle GWAS, PC1 of autosomal SNPs and feeding regime were defined as fixed effects.The kinship matrix was defined as the random effect.Because of its smaller sample size, we did not carry out within-Brahman cattle GWAS.
For multiple testing correction, because the effective number of independent SNPs for GWAS in the open field and novel object tests calculated using PLINK (Purcell et al., 2007)with the parameters (--indep-pairwise 50 5 0.2) were 750 367 and 737 545, respectively, the P-value significant threshold and suggestive threshold were approximately 5×10⁻⁸(0.05/750 367) and 1×10⁻⁶(1/750 367), respectively.These thresholds have been widely used in numerous studies.
Proportion of variance explained (PVE) was defined as follows (Teslovich et al., 2010):

Functional annotation in GWAS-associated loci
To reveal important candidate genes, we used the following strategies to focus our findings.First, we estimated the pairwise linkage disequilibrium (LD) relationships between associated SNPs.The boundaries of the associated loci were defined as associated SNPs in approximate linkage equilibrium with each other at r2>0.6 using PLINK v1.90b3.40(Purcell et al., 2007).To obtain important GWAS signals,those associated loci with associated SNPs <3 or length<1 000 bp were excluded.Second, we merged loci in which the significant SNPs were associated with two or more temperament traits.In each independent locus, the SNP with the smallest P-value was called the lead SNP.Third,functional annotation of associated SNPs was carried out according to the B.taurus reference genome (ARS-UCD1.2)using the ANNOVAR package v10.23.2012 (Wang et al.,2010).
Pathway and QTL enrichment analysis
According to the functional annotation supplied by ANNOVAR,protein-coding genes located within 500 kb of either side of the associated SNPs were defined as candidate genes.For the two-breed GWAS, 801 and 666 candidate genes were identified using the open field test and novel object test,respectively, which included 89 overlapping candidate genes.For each test, functional enrichment analysis was carried out on the candidate genes using the Kyoto Encyclopedia of Genes and Genomes (KEGG) database supplied by KOBAS 3.0 (http://kobas.cbi.pku.edu.cn/) (Xie et al., 2011).We also performed a chi-squared test using the chisq.test function in R(Champely et al., 2018) to compare the observed and expected number of independent loci overlapping with the QTLs of each trait in the Cattle QTL Database (https://www.animalgenome.org/cgi-bin/QTLdb/BT/index) (Hu et al., 2019).
Tissue expression analysis
In total, 85 B.taurus RNA-seq datasets were download from five studies in the Sequence Read Archive (SRA) database(PRJEB25677, PRJEB35127, PRJNA251439, PRJNA263600,and PRJNA522422).All clean reads for each sample were aligned to the B.taurus reference genome assembly using STAR v2.5.2a (Dobin et al., 2013) and HISAT2 v2.0.5.2 (Kim et al., 2015).Next, the transcript was assembled from aligned reads using Stringtie v1.3.3b (Pertea et al., 2015).Transcript FPKM was defined as the transcript expression levels using Ballgown v3.7 (Frazee et al., 2015).To identify brain-specific expressed genes, we calculated tissue specificity indices (τ)as described earlier (Wang et al., 2019).We filtered out weakly expressed genes in which the maximum expression level in all tissues was <1 FPKM.Here, τ is defined as follows:

We classified the genes as tissue-specific expressed genes when τ>0.8.
RESULTS
Variation in temperament traits
To evaluate differences in temperament in Brahman (48 animals) and Yunling cattle (186 animals), we measured 15 and 14 traits using open field and novel object tests,respectively (Supplementary Table S1).The abbreviations and definitions of traits are shown in Figure 1.In terms of feeding regime, the Brahman cattle included nine pen-feeding individuals and 39 free-grazing individuals, and the Yunling cattle included 58 pen-feeding individuals and 128 freegrazing individuals.Diverse phenotypic variations in these traits are shown in Supplementary Table S3 (open field test)and Supplementary Table S4 (novel object test).The coefficients of variation ranged from 2.89% to 248.26% for the open field test and from 5.32% to 1 300.90% for the novel object test.Most temperament traits followed a unimodal distribution, except for LAT (Supplementary Figure S3).We used a general linear model, with consideration of the effect of feeding regime, to test the effect of breed on temperament traits.Seven traits in Brahman cattle (FDO, APO, HSO, RMO,PNO, HSN, and PNN) were significantly higher than those in Yunling cattle (P<0.05) (Table 1), supporting previous observations that the docile B.taurus is easier to handle than the relatively flighty B.indicus (Burrow, 2001; Haskell et al.,2014).Breed differences in temperament traits have also been reported in other studies (Hoppe et al., 2010; Graunke et al.,2013).These results suggest that, at least at the breed level,differences in temperament traits are under some genetic control.
To clarify the interrelationships among the 29 studied traits,we calculated partial correlation coefficients, adjusting for feeding regime and breed.In total, 256 significant pair correlations were found among the 406 trait pairs(0.143–0.988) (Supplementary Figure S4).In general, traits within each group mirrored one another and were tightly correlated.For example, PON was positively correlated with UFN (rs=0.949, P=5.14×10−96), VFN (rs=0.967,P=1.33×10−113), LFN (rs=0.983, P=2.95×10−142), and HFN(rs=0.961, P=2.45×10−107).In addition, we also evaluated the relationships between these traits and the 15 body measurement traits (Supplementary Figure S4).In total, 75 significantly negatively correlated (0.144–0.435) and five significantly positively correlated pairs (0.144–0.179) were identified among the 435 body measurement and temperament trait pairs.Among these correlations, the relationship between body length and LFO was the most significant (rs=–0.435, P=5.96×10⁻¹⁰).
We next performed PCA to condense the correlated temperament traits into fewer variables.The loadings of the temperament traits on the two PCs in the open field test are shown in Supplementary Table S5.Seven temperament traits(UFO, VFO, LFO, HFO, POO, RMO, and APO) were loaded on PC1 with the highest factor loadings (>0.3).Thus, PC1 explained 50% of the variation in the open field test data.The loadings of the temperament traits on the two PCs in the novel object test are shown in Supplementary Table S6.Six temperament traits (VFN, LFN, HFN, PON, RMN, and APN)were loaded on PC1 with the highest factor loadings (>0.3).Thus, PC1 explained 51% of the variation in the novel object test data.These results indicate that the explanation of PC1 is of great significance for exploring the genetic mechanism of cattle temperament.
Two-breed GWAS for open field test
Based on ~13 million autosomal SNPs derived from the whole-genome sequences of 30 Brahman cattle and 128 Yunling cattle, we carried out a two-breed GWAS for 15 traits and PC1 in the open field test and identified 173 significant SNPs and 974 suggestive SNPs (Supplementary Figure S5 and Table S7), involving a total of 801 candidate genes.Gene set enrichment analysis of KEGG pathways revealed that the most significantly enriched pathway was neuroactive ligandreceptor interaction (corrected P=2.42×10⁻³) (Supplementary Figure S7A), which included many types of neuroreceptor genes, such as dopamine, serotonin, gamma-aminobutyric acid (GABA), and glutamate receptors.In fact, many neuroreceptor genes are involved in cattle behavior, such as dopamine receptor D4 (Wang et al., 2019), glutamate ionotropic receptor AMPA 2 (Lindholm-Perry et al., 2015), and serotonin receptor 2A (Garza-Brenner et al., 2017).Moreover,genes that interact with anti-psychotic drugs for schizophrenia characterized by abnormal emotional expression are overrepresented in the neuroactive ligand-receptor interaction pathway (Putnam et al., 2011).Therefore, this pathway is likely critical for emotional control in cattle.
To provide additional information about the functionalimpact of candidate genes on temperament, we used 85 B.taurus RNA-seq datasets from the SRA database containing 18 main classes and 36 subclasses (as described in Figures 2A, 3D) to identify genes specifically expressed in the brain (Supplementary Table S8).Results showed 17 662 expressed protein-encoding genes, including 1 646 brainspecific expressed genes (FPKM≥1).Amongst these brainspecific genes, 101 were candidate genes in the open field test, which is more than expected by chance (χ2test,P=6.314×10⁻³).

Table 1 Differences in temperament traits between 48 Brahman cattle and 186 Yunling cattle (least squares mean±standard error)
We performed a series of LD analyses for associated SNPs to count the number of LD blocks, resulting in 37 significantly and 34 suggestively independent loci (Supplementary Table S9).Among these independent loci, 29 were repeatedly observed in at least two traits.In addition, except for ACT,STE, and MHO, 12 out of the 15 temperament traits had at least two associated loci, supporting polygenic determinism(Haskell et al., 2014).
To establish the relationships between these traits and other quantitative traits, we investigated the enrichment of QTLs derived from the Cattle QTL Database in the independent loci found in open field test.Of the 71 independent loci, 13, 14,and 26 overlapped with the QTLs for health, meat and carcass, and production traits, respectively, more than expected by chance (Supplementary Table S10).These results suggest that the temperament traits in this study may be related to health, meat and carcass, and production traits.
To establish connections between independent loci and temperament, we reviewed published literature on 33 genes closest to the significant loci.Fifteen and four genes were associated with psychiatric and neurodegenerative diseases,respectively.For example, seven genes (LOC539383,PPARA, NMUR2, TLR4, DAB2IP, PFKP, and LOC788554)were involved in schizophrenia (Arnold et al., 2001; Costa et al., 2013; Inagaki et al., 2010; MacDowell et al., 2017; Singh,2013; Sullivan et al., 2019; Wockner et al., 2015).Eight candidate genes were also involved in psychiatric diseases in humans, including autism spectrum disorder (KLHDC7A,GABRG2, SLIT3, and SHANK2) (Cukier et al., 2014; Kuwano et al., 2011; Leblond et al., 2012; Sesarini et al., 2015), panic disorder (MANEA) (Jensen et al., 2014), bipolar disorder(KCNJ2) (Fabbri & Serretti, 2016), obsessive-compulsive disorder (CDH2) (McGregor et al., 2016), and neuroticism(SORCS3) (Eszlari et al., 2017).Only four candidate genes were involved in neurodegenerative disease in humans,including multiple sclerosis (CDK14) (Zheng et al., 2018) and Alzheimer‘s disease (LZTS1, KHDRBS2, and SORCS1)(Borjabad & Volsky, 2012; Lane et al., 2013; Gusareva et al.,2014).From the above studies, we hypothesize that genes predisposed to psychiatric disease may play crucial roles in emotional control in domestic cattle.
For PC1, the most significant association locus was located in the first intron of SORCS3 (Figure 3A–C), a gene encoding sortilin-related VPS10 domain-containing receptor 3.The SORCS3 locus was also associated with five other temperament traits (APO, HFO, LFO, POO, and UFO) in the open field test (Supplementary Table S7).In addition, the SORCS3 region was associated with the second largest number of traits in the open field test after the LZTS1 region.SORCS3 is a neuronal receptor, with prominent transcript expression in the cerebral cortex (Hermey et al., 2004).From the tissue expression profile, we observed that the mRNA expression of SORCS3 in the brain was higher than that in other tissues and SORCS3 was a brain-specific expressed gene (τ=0.88) (Figure 3E).The emotional-processing areas of the cerebral cortex can modulate activity of the autonomic nervous system (Westerhaus & Loewy, 2001).Moreover,SORCS3-deficient mice have demonstrated that SORCS3 is a postsynaptic modulator of synaptic depression and fear extinction (Breiderhoff et al., 2013).In addition, sortilin deficiency can prevent age-dependent degeneration of sympathetic neurons (Jansen et al., 2007).In our study, we combined the open field test and heart rate variability to explore activity of the autonomic nervous system (sympathetic and parasympathetic) in emotional control.We concluded that SORCS3 was a strong candidate gene contributing to emotional control in cattle.
Two-breed GWAS for novel object test
We also carried out a two-breed GWAS of 14 temperament traits and PC1 in the novel object test.We identified 154 significant SNPs and 847 suggestive SNPs (Supplementary Figure S6 and Table S10), involving a total of 666 candidate genes.Gene set enrichment analysis of KEGG pathways revealed that the most significant pathway was axon guidance(corrected P=1.79×10⁻⁴) (Supplementary Figure S7B).Theneuroactive ligand-receptor interaction pathway (corrected P=0.016) was also detected.Several studies have shown that this pathway plays an important role in cognition-related diseases, such as Parkinson‘s disease (Kong et al., 2015) and Alzheimer‘s disease (Meda et al., 2013).Therefore, we inferred that the neuroactive ligand-receptor interaction pathway is likely critical to cognitive function in cattle.We also found that 116 candidate genes were expressed specifically in the brain, more than expected by chance (χ2test,P=1.450×10⁻⁹) (Figure 4B), suggesting that these candidate genes may work in the central nervous system and contribute to differences in temperament.
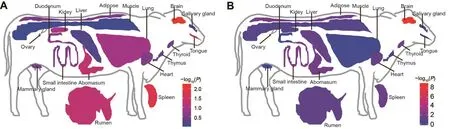
Figure 2 χ2 test comparing observed and expected number of genes in each tissue to determine dominant expression of candidate genes

Figure 3 Identification of strong candidate gene SORCS3 in open field test
After calculating the LD of associated SNPs to obtain independent loci, a total of 29 significant loci and 26 suggestive loci (Supplementary Table S12) were associated with 13 of the 14 temperament traits, with no associated loci for UFN.Among the independent loci, 11 were repeatedly observed in at least two traits.Moreover, except for HSN and MHN, 11 out of the 13 temperament traits had at least two associated loci, suggesting that most temperament traits werequantitative traits controlled by polygenes.In addition, 14, 12,and 22 of the 55 independent loci overlapped with the QTLs of health, meat and carcass, and production traits, respectively,more than expected by chance (Supplementary Table S13).These results indicate that the temperament traits in this study may be related to health, meat and carcass, and production traits.
After reviewing published literature on the 20 genes closest to the significant loci, a total of six and four genes were found to be associated with neurodegenerative and psychiatric diseases, respectively.Among these genes, amyloid-β precursor protein (APP) is well-known, with a mutation found to be protective against Alzheimer‘s disease and age-related cognitive decline (Jonsson et al., 2012).In our study, theAPPlocus was significantly associated with total time spent licking or sniffing the yellow duck, suggesting thatAPPmay be a strong candidate gene contributing to cattle cognition or recognition.Five other candidate genes were also involved inneurodegenerative diseases in humans, including Alzheimer‘s disease (NFATC2, CBLN4, and CBFA2T3) (Dou et al., 2019;Liu et al., 2018; Manocha et al., 2017), cerebellar ataxia(GRID2) (Hills et al., 2013), and mental retardation (RNF180)(Cetin et al., 2013).Only four candidate genes were involved in psychiatric diseases, including bipolar disorder (SESTD1 and NR3C1) (Perroud et al., 2014; Song et al., 2016),obsessive-compulsive disorder (SLITRK1) (Wendland et al.,2006), and mood disorder (KCTD12) (Cathomas et al., 2015)in humans.From the above studies, we hypothesize that genes predisposed to neurodegenerative disease may play crucial roles in cognition or recognition in domestic cattle.
For PC1, the most significant association locus was located in the first intron of SESTD1 (Figure 4A–C), a gene encoding SEC14 and spectrin domain containing 1.Moreover, the SESTD1 locus was also associated with four other temperament traits (APN, HFN, FDN, and RMN) in the novel object test.In addition, the SESTD1 region was associated with the largest number of traits in the novel object test(Supplementary Table S10).SESTD1, a developmentally dynamic synapse protein (Yang et al., 2019), is involved in lithium response (Song et al., 2016).Interestingly, due to the neuroprotective effects of lithium, it has been regarded as a candidate drug in disease-modification of neurodegenerative disorders, such as Alzheimer‘s disease and amyotrophic lateral sclerosis (Forlenza et al., 2014).Moreover, knockdown of SESTD1 can reduce dendritic spine density and excitatory synaptic transmission in hippocampal neurons (Lee et al.,2015).Numerous studies have demonstrated that the hippocampus plays a vital role in cognitive function (Bartlett et al., 2004; Connan et al., 2006).Tissue expression analysis revealed that the mRNA expression of SESTD1 in the brain was higher than that in the duodenum, kidney, liver, spleen,and muscle (Figure 4E).In our study, we combined the novel object test and heart rate variability to detect performance during a cognition test.These results imply that SESTD1 may be a strong candidate gene contributing to cattle cognition or recognition.
Within-Yunling cattle GWAS
We also performed within-Yunling cattle GWAS of temperament traits and PC1 in the open field and novel object tests.A total of 1 648 and 2 205 suggestive SNPs were associated with temperament traits in the open field and novel object tests, respectively.After detecting the LD of these SNPs, a total of 110 and 152 suggestive loci were detected in the open field and novel object tests, respectively.Among these association loci, 32 and 22 overlapped in the regions detected in the open field and novel object tests, respectively,through the two-breed GWAS (Supplementary Tables S14-17).The SORCS3 and SESTD1 loci identified via the twobreed GWAS were also detected in the within-Yunling cattle GWAS.Moreover, similar to previous study (Sanchez et al.,2017), we also found that the length of the QTL identified by the two-breed GWAS was shorter than that identified by the within-Yunling GWAS (t-test, P=0.03 in open field test and P=0.08 in novel object test), indicating that the two-breed approach provided smaller QTL confidence intervals than the within-breed analyses.This could be explained by the utilization of historical recombination events that occurred in each breed, resulting in less LD and better resolution (Raven et al., 2014).
DISCUSSION
With the establishment of correlations between temperament traits and economically important traits (e.g., production traits),cattle breeders will need to emphasis docility in future breeding programs.In this study, we applied open field and novel object tests as well as heart rate variability to explore temperament traits in cattle.Our experimental procedure reflected the activity of the autonomous nervous system in emotional control and recognition of a novel object.
Based on temperament traits in the open field and novel object tests, we used ~13 million SNPs from whole-genome sequencing data to clarify the relationship between genotype and phenotype through a two-breed GWAS.We identified 71 suggestive association loci (including 37 significant loci) in the open field test and 55 suggestive association loci (including 29 significant loci) in the novel object test.Although larger sample sizes are usually required for GWAS, variants with more significant effects and higher frequencies can be identified using a smaller sample size (Hong & Park, 2012).Using GWAS analysis with larger sample sizes, we hope to identify additional variants with smaller effects and lower frequencies in future work.As WGS contain more variants than SNP arrays, our GWAS on temperament traits had a higher resolution and our candidate genes were more plausible compared with previous studies.Moreover, although further functional experiments would allow us to validate the GWAS loci, most of the associated genes (e.g., neuroreceptor, brainspecific, and psychiatric and neurodegenerative risk genes)have biologically plausible links to temperament traits.In addition, several strong candidate genes (e.g., SORCS3,SESTD1, and APP) deserve specific study to confirm their putative role in modulating emotional expression or cognitive processes.Based on tissue expression profiles, the mRNA expression levels of SORCS3 and SESTD1 were higher in the brain than in other tissues.As a gene specifically expressed in the brain of cattle, SORCS3 is a postsynaptic modulator of synaptic depression and fear extinction (Breiderhoff et al.,2013) and may play an important role in emotional regulation in cattle.As the gene most associated with the largest number of traits in the novel object test, SESTD1 was highly expressed in the brains of domestic cattle.At the same time,studies on the relationship between SESTD1 and the hippocampus have shown that a decrease in SESTD1 expression can lead to the development of hippocampal neurons and decreased signal transmission ability (Lee et al.,2015).The hippocampus is also known to play a crucial role in cognitive function.Thus, these results suggest that SESTD1 is an important candidate gene for cattle cognition or recognition.
In the present study, we explored a large number of temperament traits and associated genetic datasets.Our results provide a theoretical basis for molecular-marker selection in the breeding and genetic manipulation of cattle temperament improvement to meet the increasing demand for better docility.Further studies on the causal genes underlyingtemperament will be necessary to perform genomic selection in domestic cattle and precision medicine in humans.
SUPPLEMENTARY DATA
Supplementary data to this article can be found online.
COMPETING INTERESTS
The authors declare that they have no competing interests.
AUTHORS’ CONTRIBUTIONS
C.Z.L.and Y.J.designed the study and supported the funding.J.F.S.and Q.M.C.curated and analyzed the data.J.F.S.wrote the original manuscript.Q.H.and N.B.C.reviewed and edited the manuscript.F.W.Z., K.X.Q., and J.X.Z.organized sampling and conducted fieldwork.H.C.and B.Z.H.provided the experimental animals and sites.All authors read and approved the final version of the manuscript.
ACKNOWLEDGMENTS
We would like to thank High-Performance Computing (HPC) of Northwest A&F University (NWAFU) for providing computing resources.
- Zoological Research的其它文章
- Zoological Research shines in the East
- Cenozoic Tethyan changes dominated Eurasian animal evolution and diversity patterns
- Opah (Lampris megalopsis) genome sheds light on the evolution of aquatic endothermy
- Comparative mitogenomic analyses unveil conserved and variable mitogenomic features and phylogeny of Chedrinae fish
- A new species of the gudgeon genus Huigobio Fang,1938 (Cypriniformes: Cyprinidae) from the Yangtze River Basin, southern China
- Multidimensional amphibian diversity and community structure along a 2 600 m elevational gradient on the eastern margin of the Qinghai-Tibetan Plateau