
Viscous effects on plasmoid formation from nonlinear resistive tearing growth in a Harris sheet
2022-02-15 11:07NisarAHMADPingZHU朱平AhmadALIandShiyongZENG曾市勇
Plasma Science and Technology 2022年1期
Nisar AHMAD,Ping ZHU(朱平),Ahmad ALI and Shiyong ZENG(曾市勇)
1 CAS Key Laboratory of Geospace Environment and Department of Engineering and Applied Physics,University of Science and Technology of China, Hefei 230026, People's Republic of China
2 International Joint Research Laboratory of Magnetic Confinement Fusion and Plasma Physics, State Key Laboratory of Advanced Electromagnetic Engineering and Technology, School of Electrical and Electronic Engineering,Huazhong University of Science and Technology,Wuhan 430074,People's Republic of China
3 Department of Engineering Physics, University of Wisconsin-Madison, Madison, Wisconsin 53706,United States of America
4 Pakistan Tokamak Plasma Research Institute, Islamabad 44000, Pakistan
5 Department of Plasma Physics and Fusion Engineering,University of Science and Technology of China,Hefei 230026, People's Republic of China
Abstract In this work, the evolution of a highly unstable m=1 resistive tearing mode, leading to plasmoid formation in a Harris sheet, is studied in the framework of full MHD model using the Non-Ideal Magnetohydrodynamics with Rotation,Open Discussion simulation.Following the initial nonlinear growth of the primary m=1 island,the X-point develops into a secondary elongated current sheet that eventually breaks into plasmoids.Two distinctive viscous regimes are found for the plasmoid formation and saturation.In the low viscosity regime (i.e.Pr 1), the plasmoid width increases sharply with viscosity, whereas in the viscosity dominant regime (i.e.Pr 1), the plasmoid size gradually decreases with viscosity.Such a finding quantifies the role of viscosity in modulating the plasmoid formation process through its effects on the plasma flow and the reconnection itself.
Keywords: viscosity, reconnection, plasmoids, Prandtl number
1.Introduction
Plasmoid instability(PI)is known to develop on the elongated current sheet formed during the externally driven Sweet–Parker(SP) reconnection, or from the intrinsically growing nonlinear kink or tearing mode.In general, when the aspect ratio of the elongated current sheet becomes sufficiently large, unstable secondary tearing can lead to the formation of plasmoids[1–5].The problem of the transition from the laminar reconnection during the early nonlinear stage, to the subsequent highly unstable one, characterized by sporadic production of plasmoids inside the sheet itself, with faster average reconnection rates, has been addressed by a number of past numerical and theoretical studies [6, 7], in the context of PIs following the externally driven SP reconnection [8–12], or the intrinsically nonlinear tearing mode[2,13–15],on the scaling and dynamics of plasmoid formation with different Lundquist numbers.
Previous studies have found the critical roles of plasma flow in the processes of reconnection in general and plasmoid formation in particular[16–21].Whereas the plasma outflow is stabilizing on the primary tearing mode or reconnection process [16–19], the effects of plasma flow itself, including both inflow and outflow,may contribute to the initial onset of PI[8].The plasma viscosity can affect the properties and topologies of plasma flow close to the thin current sheet as well as the reconnection rate.Because of the narrowness of the current sheet, viscosity can influence the nonlinear regime.In fact,viscosity increases the possibility of local changes in the flow topology.The robustness of the flow cells around the sheet might be weakened or even unstable due to the existence of strong flow gradients in the current sheet region [22].Finite viscosity inserts dissipation to the flow patterns that in turn interact with the island evolution and reconnection [22].Thus the plasma viscosity, both collisional and collisionless, is expected to be one of the key parameters that determine the onset and saturation conditions for the PI.
The effects of viscosity on linear and nonlinear resistive tearing mode as well as PI have been studied by many[12, 13, 22–31].In this paper we focus on exploring the impact of viscosity on the onset and saturation of PI.Most of the past studies on visco-resistive tearing and kink modes were made in a 2D reduced MHD model, however in this study, we use the complete resistive MHD equations implemented in Non-Ideal Magnetohydrodynamics with Rotation,Open Discussion (NIMROD) code [32].Both the onset and the dynamics of plasmoid differ greatly from those found in previous reduced MHD simulations [21, 22].
The rest of the paper is organized as follows.In section 2,we briefly describe our simulation model.In section 3, both linear and nonlinear simulation results are reported.At the end in section 4, summary and discussion are presented.
2.Simulation model and equilibrium
Our simulations are based on the single-fluid full MHD model implemented in the NIMROD code [32].
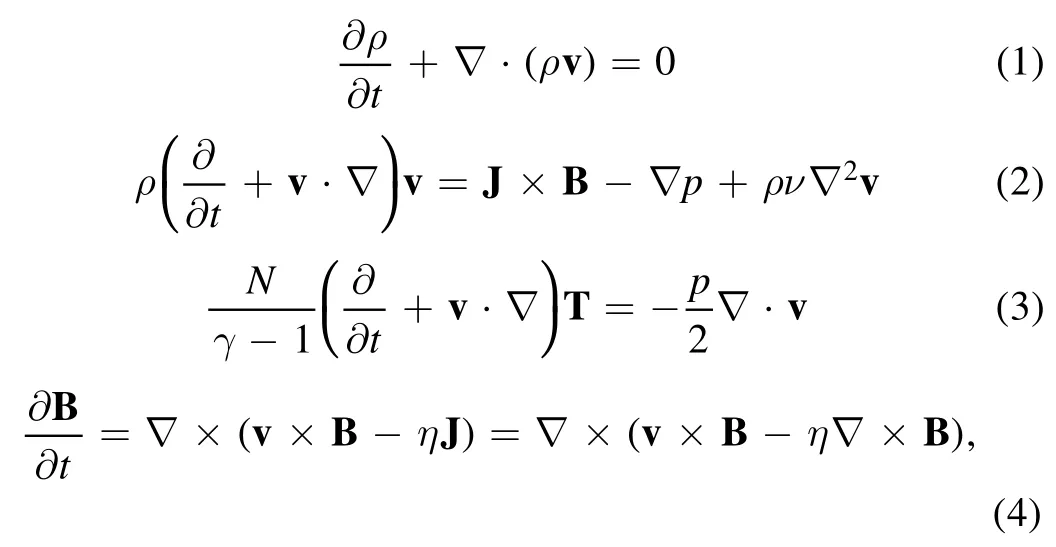
where ρ,N,p,T,J,v,B,η,γ and ν are the plasma mass density,number density, pressure, temperature, current density, velocity,magnetic field, heat flux, resistivity, specific heat ratio, and viscosity respectively.The resistive-viscous MHD model equations(1)–(4)used in the simulations are all dimensionless.In particular, the spatial normalization unit x0is of the same order as the Harris sheet width a, i.e.x0~a.The magnetic field is normalized by the field magnitude B0at the edge of the Harris sheet, i.e.x →±∞.The mass density is normalized by the field magnitude ρ0at the center of the current sheet x=0.The normalization units for velocity, time, and pressure areandrespectively.In addition, the heat flux is zero and the adiabatic index γ=5/3.In the dimensionless equations(1)–(4), both the resistivity η and the viscosity ν are the normalized dimensionless parameters,with η=S−1, andν=where S is the Lundquist numberis the unnormalized dimensionless resistivity,and Pr=μ0νD/ηDis the magnetic Prandtl number,νDis the unnormalized dimensionless viscosity,withThe Harris current sheet model is adopted for the equilibrium magnetic field [33]
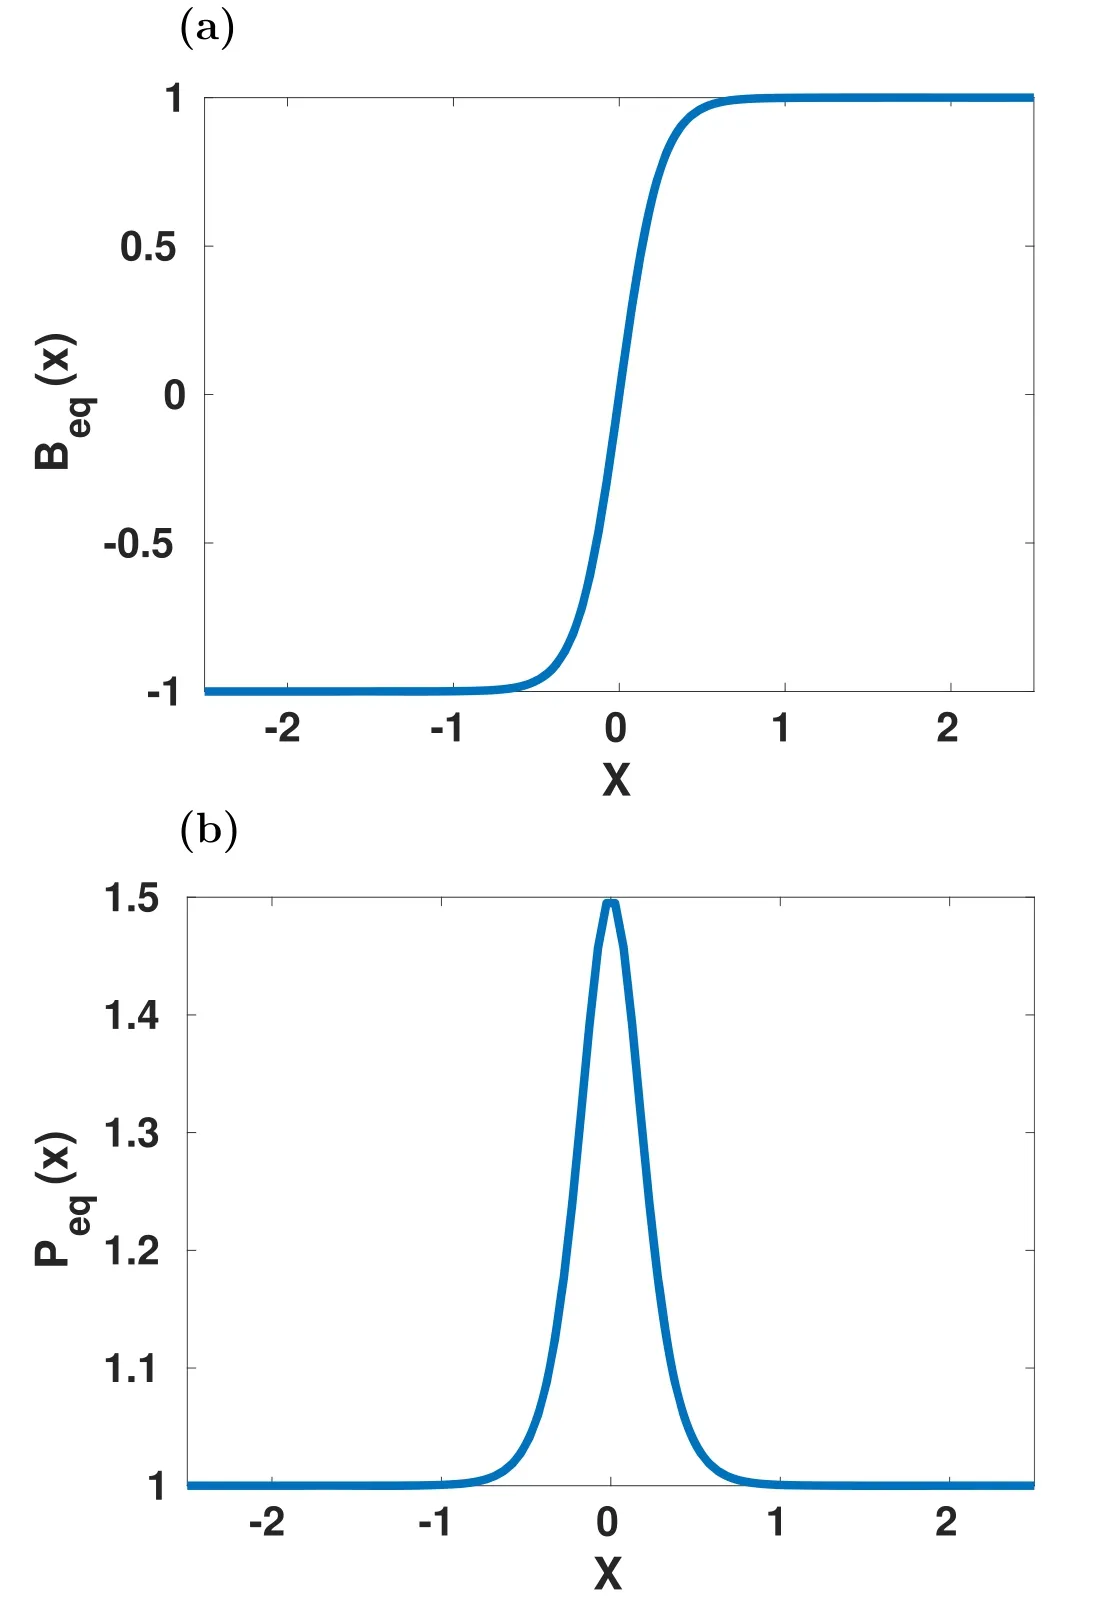
Figure 1.(a)Harris sheet equilibrium magnetic field and(b)pressure profiles.

The corresponding pressure profile from the static MHD force balance is determined as
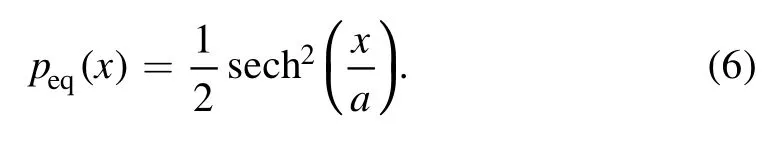
Figure 1 shows the above mentioned equilibrium magnetic field and pressure profiles.The resistive MHD equations(1)–(6)are numerically solved in a rectangular domain[−Lx,Lx]×[−Ly,Ly], where Lx=(−2.5, 2.5) and Ly=(−5, 5).The periodic boundary conditions are imposed at the y-boundaries, and the solid, perfect conducting walls are assumed at the x-boundaries.For the Harris current sheetΔ′a= 2 [(ka)−1−ka][34],so that the unstable modes have wave vector satisfying ka<1.HereΔ′is the discontinuity of logarithmic derivative of the outer flux function when approaching the singular layer at x=0,which is a measure of the free energy of the system.Here k is the mode wave number along y,and Ly=2πm/k,with m being the mode number.In our linear simulations, resistivity and viscosity are varied but nonlinear simulations are performed for a uniform plasma resistivity η=2.8×10⁻⁴and a wide range of viscosity(Pr=0.33–10).

Figure 2.(a)Linear growth rates as functions of the resistivity for the fixed value of ν=0.000 28 and Δ′ = 49.66.The blue and red lines,represent the theoretical scaling of the linear growth rate for low(γ ~η0.33) and large (γ ~η0.66) Prandtl number regimes respectively, whereas, the green line represents the simulation results.(b)Linear growth rates as functions of the viscosity for the fixed value of instability parameter Δ′ = 49.66 and various values of resistivity η.

Figure 3.Kinetic energy evolution for different numerical resolutions at Δ′ = 49.66.
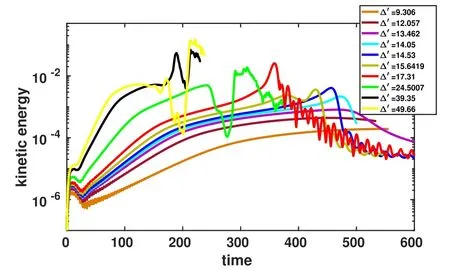
Figure 4.Kinetic energy evolution for Δ′ = 9.306, 12.057, 13.462,14.05, 14.53, 15.6419, 17.31, 24.5007, 39.35 and 49.66.
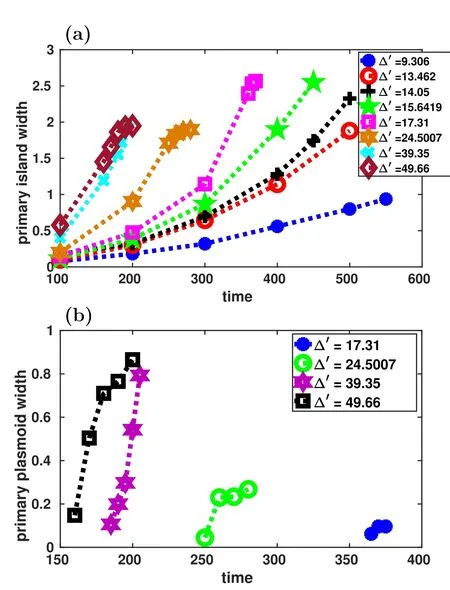
Figure 5.(a) Primary island evolution and (b) primary plasmoid evolution for different instability parameters.
3.Simulation results
3.1.Linear scaling

Figure 6.2D contours of the current density in z-direction and the 2D magnetic field lines at (a) time=450 and (b) time=570 for Δ′ = 13.462.
The PI tends to develop from the primary tearing growth in the largeΔ′ regime [2].One such case,Δ′ = 49.66 is examined first in simulations for its linear scaling in comparison with theory.The linear growth rate of the m=1 resistive tearing mode obtained from our NIMROD simulations scales with the resistivity η as γ ~η0.30for low Prandtl and γ ~η0.67for large Prandtl number regimes.These scalings are close to the resistive tearing scalings of γ ~η0.33and γ ~η0.66in the large Δ′ regime previously derived in theory [24, 29, 35](figure 2(a)).Viscosity in general introduces dissipation that reduces the linear growth of resistive tearing mode.This viscous dissipation is stronger in the Pr>1 regime, where the growth rate γ of the m=1 resistive tearing scales with the viscosity as γ ~ν−0.33,similar to the viscosity scaling obtained in previous reduced MHD simulations [29] and theory [24](figure 2(b)).
3.2.Nonlinear results
3.2.1.Critical Δ′for the X-point collapse and PI.Our nonlinear simulations find that the onset of secondary tearing instability and plasmoid formation occur only when theΔ′ is above a certain threshold value.In our nonlinear simulation, we mostly employ 64×48 2D finite elements with a polynomial degree of 5, which ensures the numerical convergence (figure 3).

Figure 7.2D contours of the current density in z-direction and the 2D magnetic field lines at (a) time=300 and (b) time=470 for Δ′ = 14.05.
The evolution of kinetic energy reaches its maximum sooner as we increase the value ofΔ′ (figure 4).In figure 5 the evolutions of the width of the primary island and plasmoids are shown which match the earlier simulation results[36].We have measured the width of primary plasmoid(i.e.secondary island)at the stage just before its ejection.Also at this stage we have referred to the primary island as the saturated island,since by this stage the width of the primary island has approached constant.
The minimum value ofΔ′ at which the X-point evolves into the Y-type is 14.04.ForΔ′ = 13.42, the current sheet remains the shape of X-point over the entire time(figure 6).As the value ofΔ′ increases to above 14.05, the X-point evolves into a Y-type current sheet as shown in figures 7 and 8.Waelbroeck[37]first predicted the criterion for the collapse of X-point into Y-type current sheet to beW>Wc≈ 25Δ′,where W represents the width of primary island and Wcrepresents the critical width at which X-point collapses.This conversion of X-point into Y-type current sheet is termed as the secondary instability (SI) [37].The subsequent collapse of the Y-type current sheet into plasmoids is known as the PI [38].

Figure 8.2D contours of the current density in z-direction and the 2D magnetic field lines at(a)time=200,(b)time=340,(c)time=360 and (d) time=365 for Δ′ = 17.31.
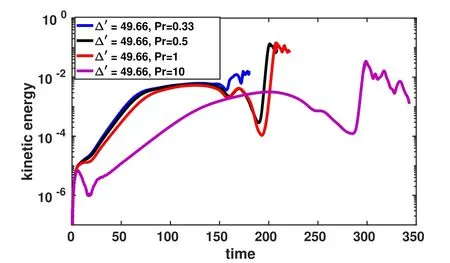
Figure 9.Kinetic energy evolution for Δ′ = 49.66 at Pr=0.33, 0.5, 1 and Pr=10.
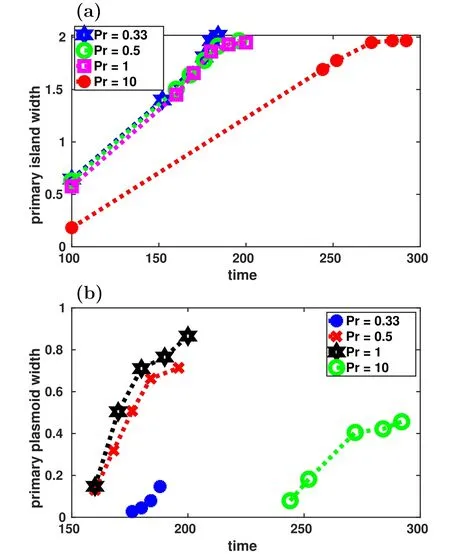
Figure 10.Primary island evolution and (b) primary plasmoid evolution for Δ′ = 49.66 at Pr=0.33, 0.5, 1 and Pr=10.
For η=2.8×10⁻⁴and Pr=1 the criticalΔ′value for the onset of PI isΔ′ = 17.31, which is in agreement with the previous reduced MHD simulation [21].In this case, at time 200(figure 8(a)),an X-point is formed as shown.At time 340(figure 8(b)), the Y-type current sheet develops during the nonlinear stage[6,9,39].At time 360(figure 8(c)),the current density reaches maximum and the current sheet becomes more stretched and thinner.Finally, at time 365 (figure 8(d)),formation of plasmoid takes place.
3.2.2.Effect of viscosity on the nonlinear evolution of resistive tearing mode for highly unstable system.In the following cases, to explore the viscosity effects, we only vary the viscosity in terms of Prby keeping the resistivity and instability parameter constant, which are η=2.8×10⁻⁴and Δ′ = 49.66 respectively.To study the effect of viscosity, we choose four different cases with Pr=0.33, 0.5, 1 and 10(figure 9).The evolution of the width of primary island and primary plasmoid for the above mentioned different Prandtl number cases is shown in figure 10.
In figure 11, the dynamics of the visco-resistive tearing mode growth are divided in 5 stages.The first stage is the initial transient stage when the linear instability starts to grow.The second stage is the FKR stage, during which both the reconnection rate and the magnetic island width grow exponentially.In the third stage, the so-called Rutherford stage, the island evolves toward saturation and subsequent decay.The X-point collapse and the Y-type, SP-like current sheet forms during the fourth stage (figures 12(a)–(c)).The transition from the X-type geometry to the Y-type current sheet is known as the SI.The first peak that appears in the kinetic energy evolution is due to the X-point collapse with the onset of SI at t=160 as shown in figure 9.After the X-point collapse, the SP-like current sheet starts to become elongated in the poloidal direction.During the fifth stage,the Y-type current sheet starts to become more elongated and SPlike.After the collapse of SP-like current sheet,the secondary island appears along with two X-points on both ends(figure 12(e)).After t=160,the growth rate starts to decrease up to t=170, and a significant change in the growth rate occurs due to the collapse of the Y-type current sheet and the formation of small plasmoid chain.

Figure 11.Growth rate evolution for all Pr=0.33, 0.5, 1 and 10 cases with Δ′=49.66.
The size of the secondary island increases up to some extent and both X-points collapse to form two tertiary current sheets with the passage of time.The second large peaks in the growth rate and the kinetic energy plots represent the collapse of these two tertiary current sheets.As the width of the secondary island approaches some critical value, the ejection of the secondary island takes place.At this point kinetic energy increases abruptly and the secondary island coalesces with the primary one(figure 13(d)).As the Y-type current sheet collapse and the PI appears, a drastic increase in the growth rate takes place (figure 11) which is much larger as compared to the growth rate of the SI.
The nonlinear stages of our simulation results described above are quite similar to the nonlinear secondary island evolution reported by Loureiro et al [2].But the collapse of the secondary island and direction of ejection are different in our cases.For example in our simulations for the Pr=0.5 and the Pr=5 cases,the direction of plasmoid ejection is upward,whereas for the Pr=1 and the Pr=10 cases the direction is downward.The directions of plasmoid ejection are different for different Prcases.Prmay not be the fundamental parameter that determines the direction of the plasmoid ejection, which may also depend on the initial condition.We leave this issue for future study.
Our simulations for various Prnumbers show viscous effects on both the timing and the spatial structure of PI.In the Pr=0.33 (i.e.very low viscosity), we find secondary islands that saturate early at smaller size(figure 12(f)).As we increase the viscosity further (Pr=0.5), the appearance and ejection of the secondary island become more prominent,along with the larger saturated island and plasmoid(figure 13).A clear transition occurs at Pr=1, when the size of the primary plasmoid becomes the maximum, and the onsets of the SI, the PI and the island saturation are significantly postponed(figure 14).The direction of plasmoid ejection also switches to the opposite.The second peak of kinetic energy increases with viscosity and reaches maximum at Pr=1 too.For higher Prandtl number(Pr=10,with η=2.8×10⁻⁴and viscosity=0.0028)the size of the plasmoid becomes smaller(figure 15).Figure 16 summarizes the relationships among plasmoid width, saturated island width, and Prnumber.At lower Pr, the width of saturated island is small, but as we increase viscosity, the width of saturated island increases sharply up to Pr=1,beyond which the saturated island width becomes almost independent of the Prnumber.The Pr=1 number also separates two regimes for the plasmoid width.In the Pr<1 regime,the width of plasmoid increases drastically with viscosity, whereas in the Pr>1 regime, the width of plasmoid slowly decreases with the viscosity.
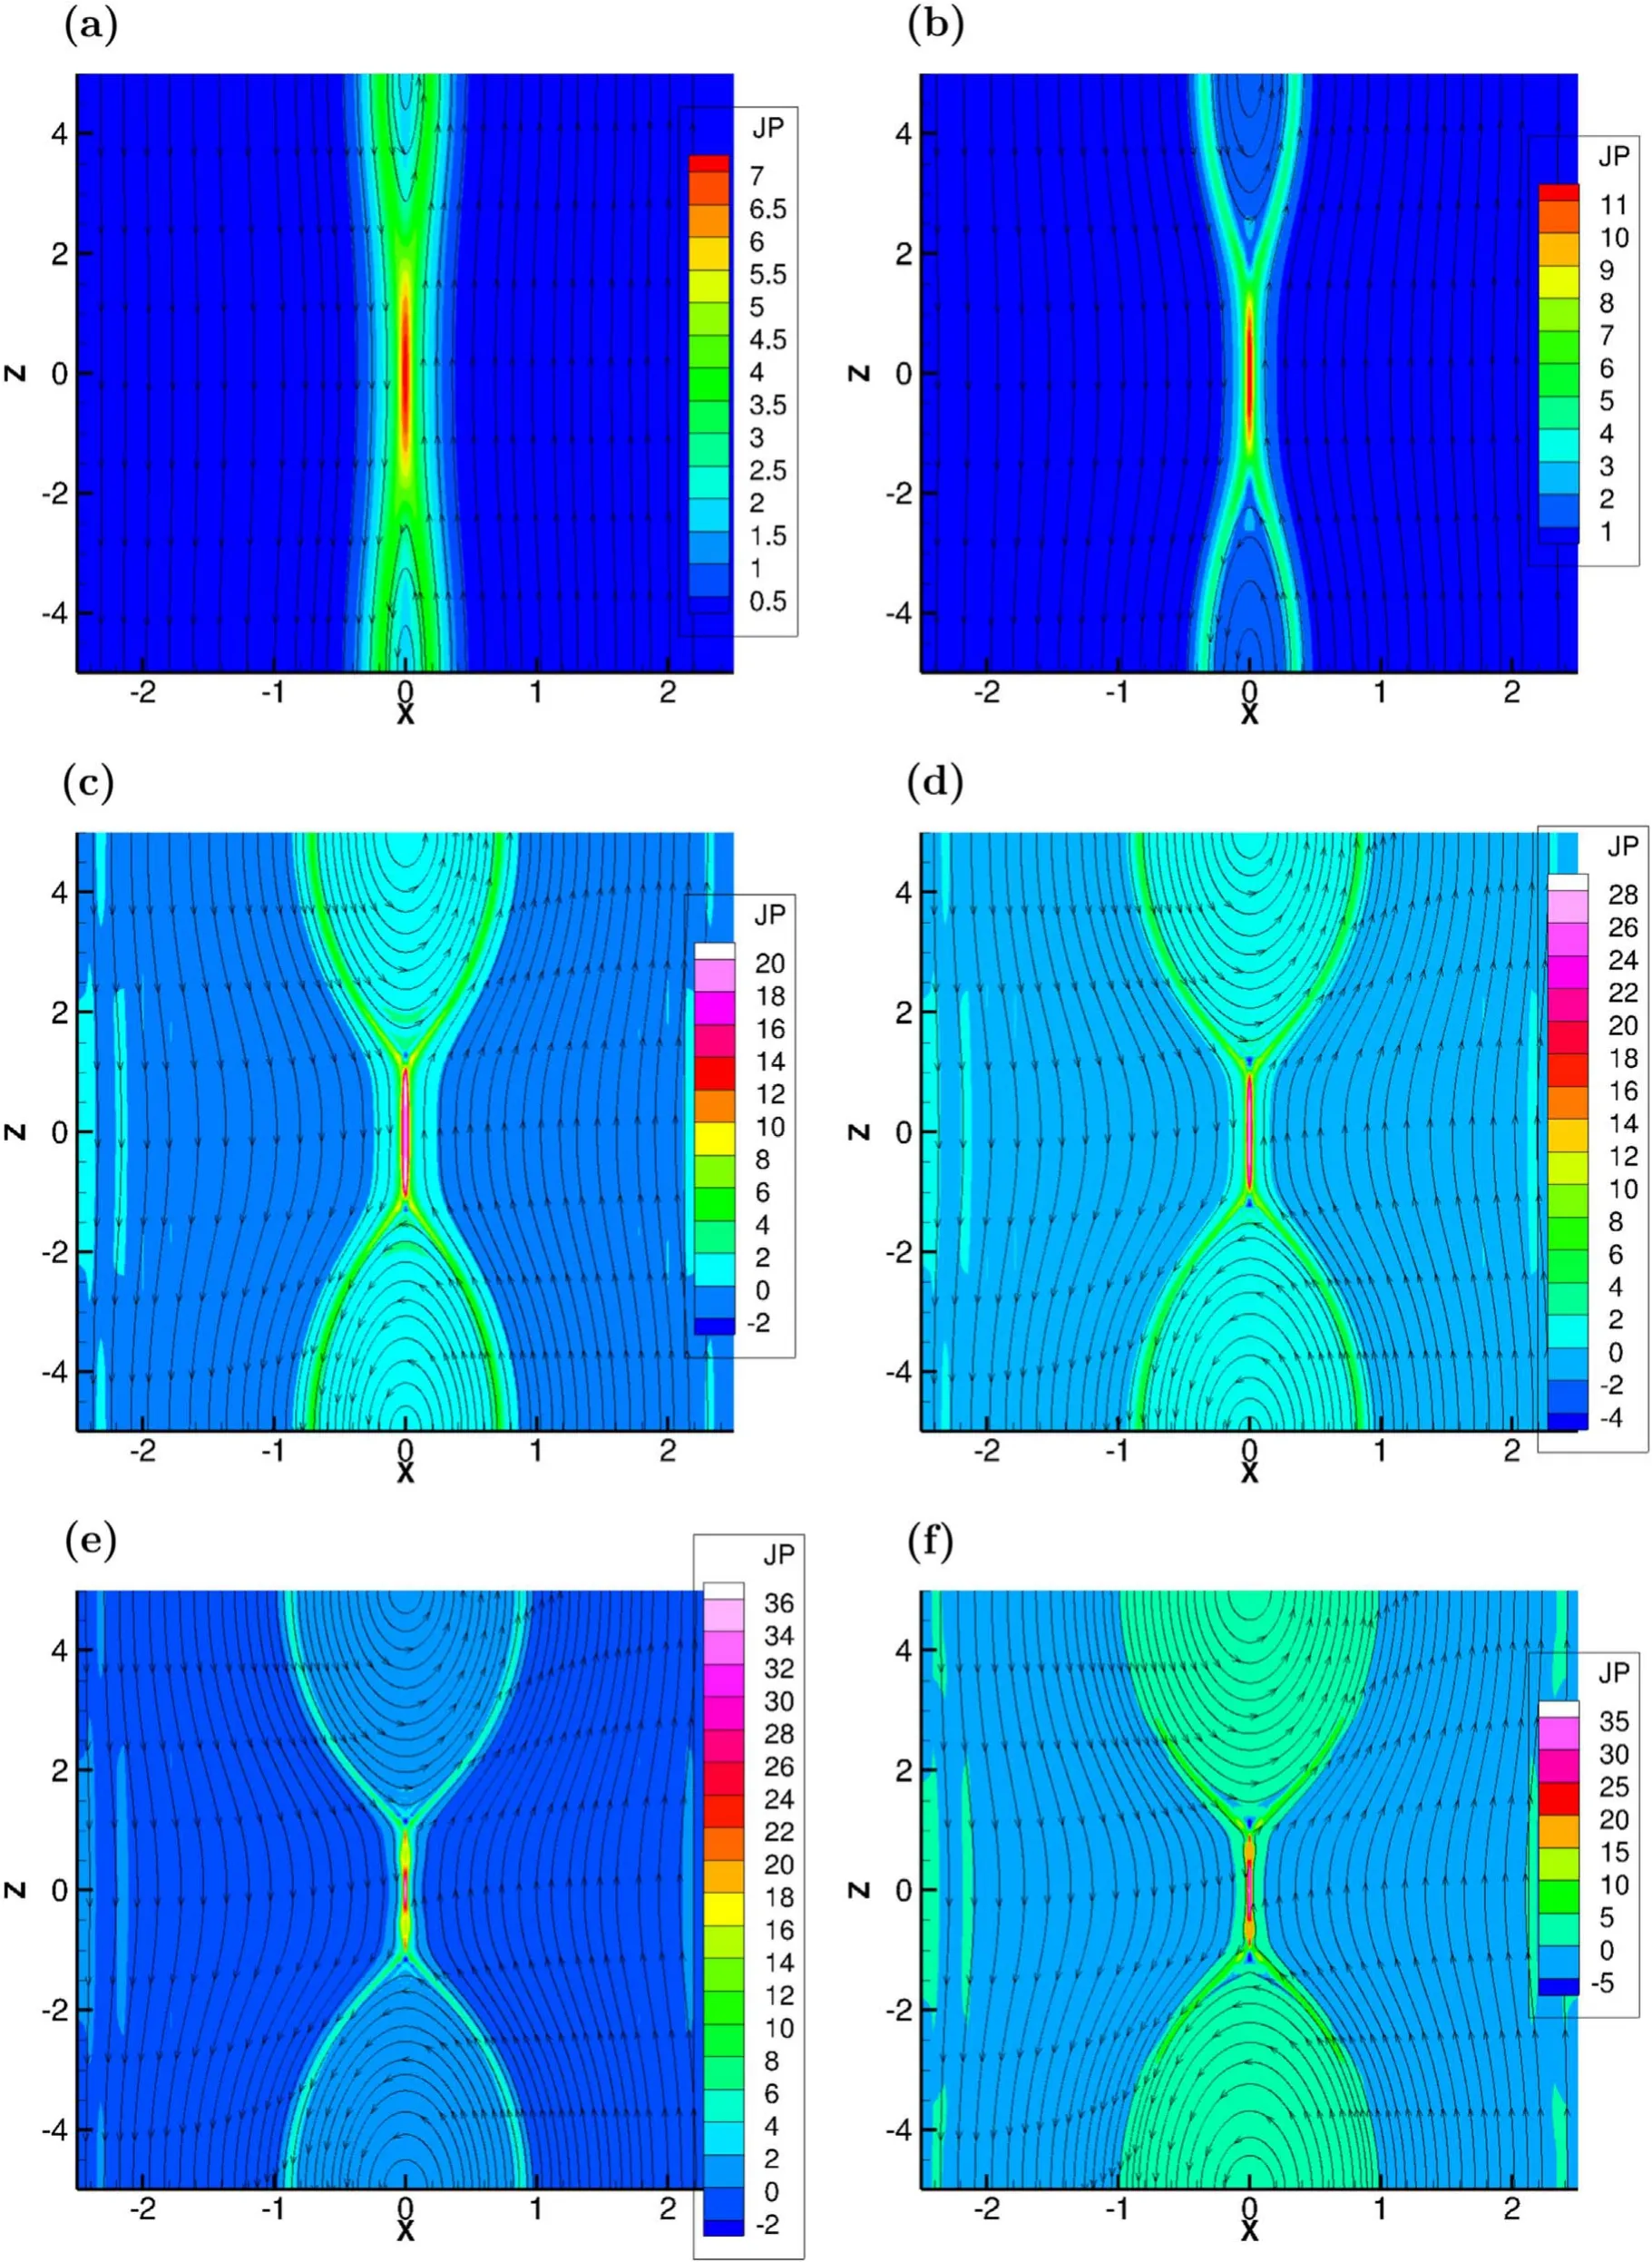
Figure 12.2D contours of the current density in z-direction and the 2D magnetic field lines at(a)time=70,(b)time=100,(c)time=152,(d) time=168, (e) time=172 and (f) time=176 for Δ′=49.66, Pr=0.33.
4.Summary
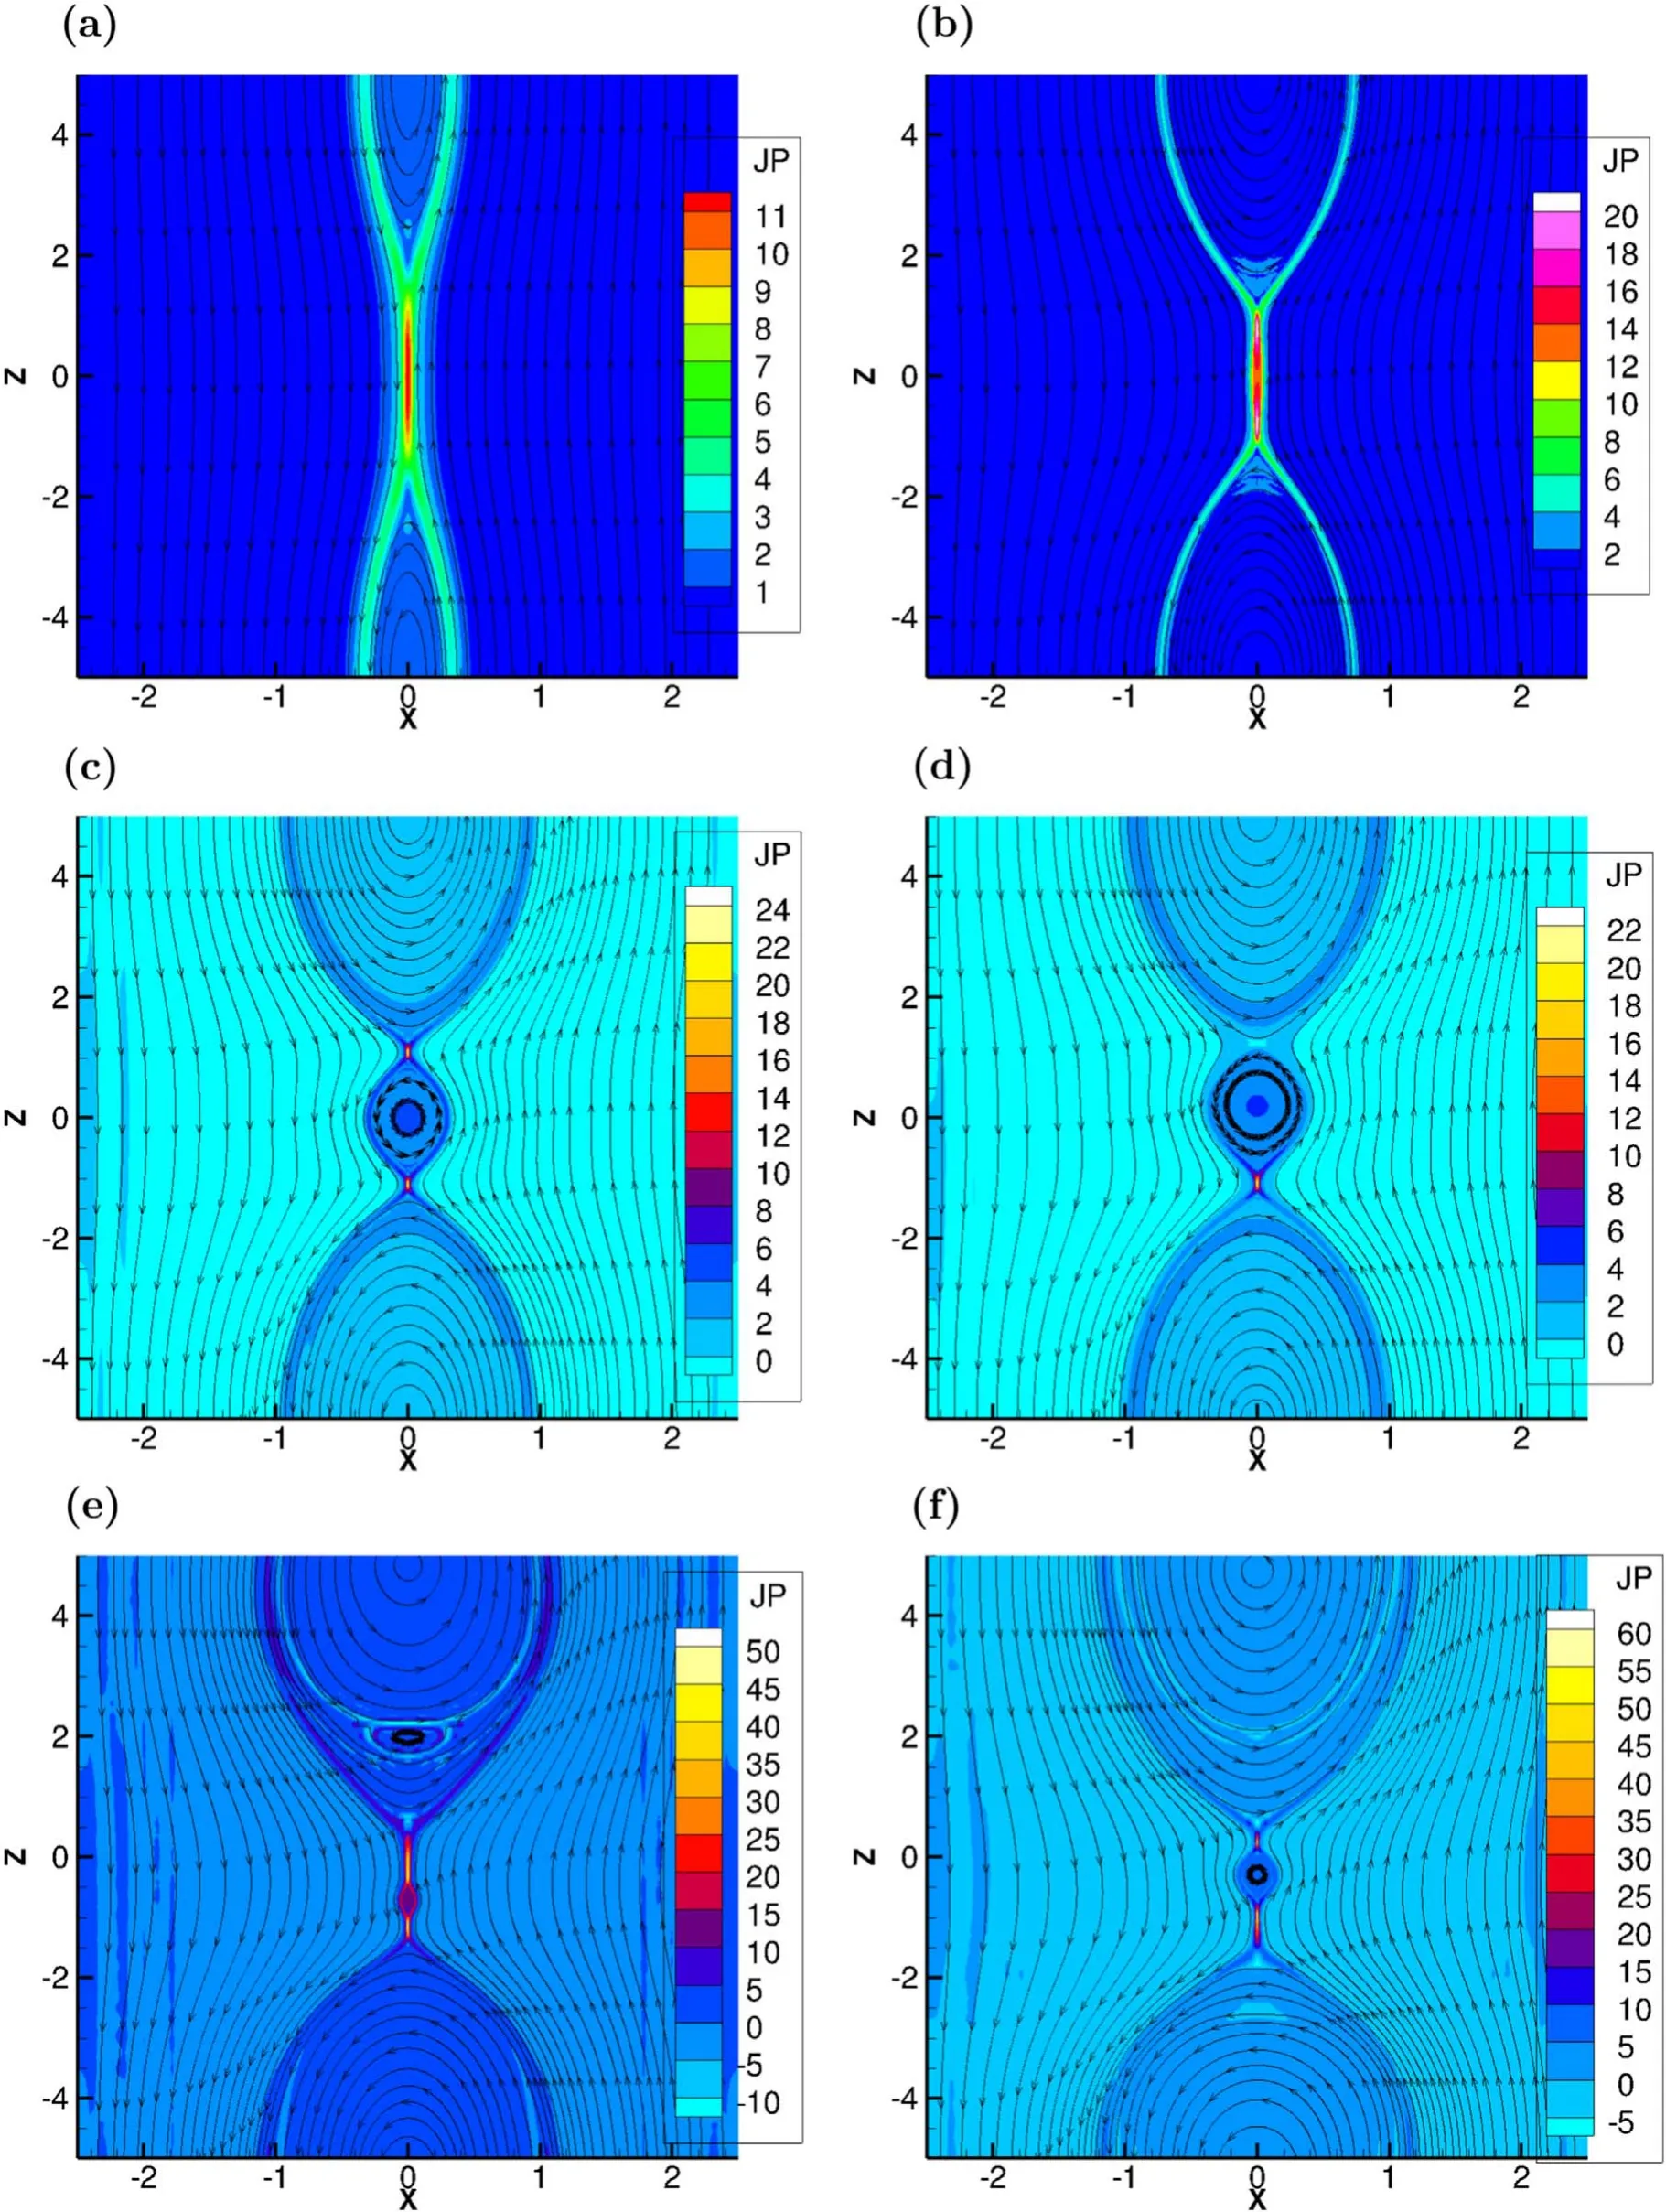
Figure 13.2D contours of the current density in z-direction and the 2D magnetic field lines at(a)time=100,(b)time=156,(c)time=180,(d) time=196, (e) time=204 and (f) time=208 for Δ′=49.66, Pr=0.5.
The key objective of this study is to explore the viscous effects on SI, plasmoid formation, their merging and ejection process during the nonlinear evolution of a resistive tearing mode in the largeΔ′ regime.For our equilibrium, we find the critical instability parameter for the onset of the SI, and the minimum value ofΔ′at which PI can take place.Two distinctive regimes of the Prnumber are found for the PI, which are separated by the value of Pr=1.In the Pr1 regime, the amplitude of the second peak for kinetic energy increases up to Pr=1,whereas in the Pr1 regime, this amplitude decreases with the viscosity.Both the saturated island width and the plasmoid size increase sharply with the viscosity in the Pr1 regime, however, the former slowly increases whereas the latter decreases with the viscosity in the Pr1 regime.In other words, the plasmoid size reaches maximum at Pr≃1.We plan to further explore the significance of such a finding in future work.

Figure 14.2D contours of the current density in z-direction and the 2D magnetic field lines at(a)time=100,(b)time=150,(c)time=190,(d) time=200, (e) time=205 and (f) time=215 for Δ′=49.66, Pr=1.

Figure 15.2D contours of the current density in z-direction and the 2D magnetic field lines at(a)time=150,(b)time=200,(c)time=280,(d) time=292, (e) time=296 and (f) time=340 for Δ′=49.66, Pr=10.

Figure 16.(a) Saturated island width and (b) plasmoid width as functions of the Prandtl number.
Acknowledgments
This research was supported by the National Magnetic Confinement Fusion Science Program of China (No.2019YFE03050004),National Natural Science Foundation of China (Nos.11 775 221 and 51 821 005), U.S.DOE (Nos.DE-FG02-86ER53218 and DESC0018001), and the Fundamental Research Funds for the Central Universities at Huazhong University of Science and Technology (No.2019kfyXJJS193).We are grateful for the support from NIMROD team.This research used the computing resources from the Supercomputing Center of University of Science and Technology of China.The author Nisar Ahmad acknowledges the support from the Chinese Government Scholarship.
 Plasma Science and Technology2022年1期
- Plasma Science and Technology的其它文章
- Numerical studies of the influence of seeding locations on D-SOL plasmas in EAST
- On the stability of small-scale ballooning modes in axisymmetric mirror traps
- Microwave preionization and electron cyclotron resonance plasma current startup in the EXL-50 spherical tokamak
- FEQ: a new flux coordinates based equilibrium solver including both magnetic axis and separatrix
- Dispersion and damping rate of Langmuir wave in space plasma with regularized Kappa distributed electrons
- Response of the low-pressure hot-filament discharge plasma to a positively biased auxiliary disk electrode