
Cytokine Profiles and Virological Marker Monitoring during 48 Weeks Peginterferon Alfa Treatment for HBeAg-Positive Chronic Hepatitis B*
2022-04-29 05:38LIMingHuiSUNFangFangCHENFengXinZENGZhanLINYanJieBIXiaoYueYANGLiuDENGWenJIANGTingTingHUANGRongHaiYIWeiandXIEYao
LI Ming Hui ,SUN Fang Fang ,CHEN Feng Xin ,ZENG Zhan ,LIN Yan Jie ,BI Xiao Yue ,YANG Liu,DENG Wen,JIANG Ting Ting,HUANG Rong Hai,YI Wei,and XIE Yao,,#
1.Department of Hepatology Division 2,Beijing Ditan Hospital,Capital Medical University,Beijing 100015,China;2.Department of Hepatology Division 2,Peking University Ditan Teaching Hospital,Beijing 100015,China;3.Capital Medical University,Beijing 100069,China;4.Department of Infectious Diseases,Capital Medical University,Beijing 100015,China;5.Department of General Surgery,Capital Medical University,Beijing 100015,China;6.Department of Gynecology and Obstetrics,Beijing Ditan Hospital,Capital Medical University,Beijing 100015,China
Abstract Objective This study aimed to investigate whether cytokine profiles and virological markers might add value in monitoring the effects of peginterferon (PEG-IFN) therapy for hepatitis B e-antigen (HBeAg)positive chronic hepatitis B (CHB).Methods HBeAg positive patients with CHB were treated with PEG-IFN for 48 weeks.Clinical biochemical,and HBV serological indexes,as well as cytokines,were detected at baseline and every 12 weeks.Results A total of 116 patients with CHB were enrolled in this study;100 patients completed the 48-week treatment and follow-up,of whom 38 achieved serum HBeAg disappearance,25 achieved HBeAg seroconversion,37 showed HBsAg decreases ≥ 1 log10 IU/mL,9 showed HBsAg disappearance,and 8 became HBsAb positive.The cytokine levels at baseline and during treatment were similar between the HBeAg disappearance group and non-disappearance group.The disappearance of HBeAg was independently associated with HBeAg levels at weeks 12 and 24,and with the HBeAg decline at week 24(P <0.05).The HBsAg response was independently associated with HBsAg,the HBsAg decline,HBeAg,the HBeAg decline at week 12,and HBsAg at week 24 (P <0.05).Conclusion There was no significant correlation between the response to interferon (IFN) and cytokines during PEG-IFN treatment.The changes in virological markers predicted the response to IFN after 48 weeks.
Key words:Chronic hepatitis B;Cytokine;Peginterferon;HBsAg;HBeAg
INTRODUCTION
In Chinese patients with liver cirrhosis and hepatocellular carcinoma,the proportions of cases caused by hepatitis B virus (HBV)infection are approximately 60% and 80%,respectively[1].Therefore,chronic hepatitis B (CHB)remains one of the most important infectious diseases in China[2].Interferon (IFN) antiviral therapy significantly decreases the incidence of cirrhosis and liver cancer[3],and is recommended by most guidelines[4,5]as an important step to delay the progression of liver diseases.IFN induces the maturation and activation of dendritic cells (DCs);stimulates the expression and secretion of natural killer (NK) cells,cluster of differentiation 4+(CD4+)helper T lymphocytes,clusterof differentiation 8+(CD8+) cytotoxic T lymphocytes,and monocytes;and activates B IFN lymphocytes to achieve the elimination of virus-infected cells[6,7].The central roles of cytokines and the immune environment in the control and clearance of HBV by IFNs has been well confirmed[8-13].Our team's preliminary studies have also indicated that the pathogenesis of CHB and antiviral efficacy are associated with immune cells,such as plasmacytoid DCs,regulatory T cells (Treg and NK cells),and cytokines [IFN-γ,transforming growth factor beta(TGF-β),and interleukin-10 (IL-10)].The incidence of hepatitis B is positively correlated with the IFN-α level and negatively correlated with the levels of TGF-β and IL-10[11,14].The levels of IFN-γ,interleukin-17A (IL-17A),interleukin-6 (IL-6),IL-10,and TGF-β have been found to significantly decrease (P<0.001),whereas the level of IFN-α2 has been found to significantly increase (P<0.001),during weeks 12–24 of IFN treatment[13].
However,which changes in cytokines or other clinical parameters that are associated with IFN treatment and are predictive of the response to IFN therapy remain unclear.We detected cytokines that caused liver inflammation and immunosuppression (IL-6,IL-10,TNF-α,and TGF-β),factors that stimulate immune cell function (IFN-α),and factors that are involved in viral clearance (IL-17A and IFN-γ) or stimulate the proliferation of DC and NK cells(Flt3-L)[12,13,15-17].In this study,we aimed to investigate changes in cytokines and virological markers in patients with CHB during a 48-week IFN treatment.
MATERIALS AND METHODS
Study Design
This was a prospective observational cohort study in patients with CHB who were HBeAg positive.From November 2017 to November 2018,HBeAgpositive patients with CHB who were willing to be treated with PEG-IFNα-2a in the Department of Hepatology Division 2 of the Beijing Ditan Hospital Affiliated with Capital Medical University signed informed consent and were enrolled in the study.PEG-IFNα-2a was injected subcutaneously at a dose of 180 μg/w for 48 weeks.The disappearance of HBeAg and a 1 log10IU/mL decrease in HBsAg at week 48 of Peg-IFN treatment were used as response indicators for group analysis.HBeAg <1 S/CO was defined as disappearance of HBeAg,and HBsAg<0.05 IU/mL was defined as disappearance of HBsAg.Patients with and without disappearance of HBeAg were divided into two groups.Those with an HBsAg decrease <1 log10IU/mL were considered non-responders,and those with an HBsAg decrease>1 log10IU/mL were considered responders.Virological and serological markers,biochemistry,and AFP were measured every 12 weeks during the treatment period.Liver imaging was performed every 24 weeks.Cytokines (Flt3-L,IFN-α2,IFN-γ IL-10,IL-17A,IL-6,TGF-β1,TGF-β2,TGF-β3,and TNF-α)were measured at baseline,and after 12 and 24 weeks.
Enrollment Criteria
The enrollment criteria[13]for HBeAg positive patients with CHB were as follows:1) persistent HBsAg positivity (HBsAg ≥ 0.05 IU/mL) for 6 months;2) HBeAg positivity,HBeAg ≥ 1.0 S/CO;3) HBV DNA positivity(>104IU/mL);4) abnormal glutamic-pyruvic transaminase (ALT) (≥ 80 IU/L) lasting for more than 3 months or significant liver inflammation (above G2)in histological examination;5) age of 18–65 years;and 6) no hormones and/or immunosuppressants and other hepatoprotective drugs.
The exclusion criteria were as follows:1) coinfection with other hepatitis virus (HCV or HDV);2) autoimmune liver diseases;3) other viral infections,such as EB virus (EBV),cytomegalovirus(CMV),or human immunodeficiency virus (HIV)infection;4) chronic alcohol abuse and/or use of other drugs that damage the liver;5) mental illness;6) evidence of liver tumors (clinical diagnosis of liver cancer or alpha fetal protein(AFP) >100 ng/mL);7) hepatic fibrosis and cirrhosis confirmed with Fibroscan[18];8) serious diseases of the heart,brain,lung,kidney,and other systems that would prevent long-term follow-up;and 9)other liver diseases (e.g.,fatty liver or metabolic liver disease).
Treatment Strategy Adjustment
According to the response guide therapy,patients were treated with PEG-IFNα-2a 180 μg/W alone for 12 weeks,and then patients with an HBV DNA load >103IU/mL were treated with PEG-IFNα-2a combined with ETV until the end of week 48.If the HBV DNA load was <103IU/mL after PEG-IFNα-2a therapy alone for 12 weeks but still exceeded 20 IU/mL at week 24,then ETV was added to PEGIFNα-2a until week 48.The detection limit of HBV DNA was <20 IU/mL.This study mainly observed the responses of the two groups in the 48 weeks of treatment.After 48 weeks,PEG-IFNα-2a treatment was discontinued or changed to nucleic acid (NA)treatment according to the patients' wishes.
Determination of Sample Size
We previously found that approximately 30% of patients with CHB achieved HBeAg disappearance(clinical outcome event) after 48 weeks of IFN treatment[13].Six factors (age,sex,HBsAg,HBeAg,HBV DNA,and immune cells) affecting the effects of IFN on CHB treatment were considered,and five patients with outcome events were enrolled for each factor (5 × 6=30 patients).On the basis of the 30%incidence of endpoint events,we determined that 100 patients should be enrolled.Considering a loss rate of 10%,we determined the necessary sample size to be 110 cases.We ultimately enrolled 116 patients with CHB in this prospective study,thus meeting the statistical power requirements.
Detection of HBV DNA,HBV Serology,and Clinical Index
Liver function (Wako Pure Chemical Industries,Ltd,Japan),kidney function (Sekisui Medical CAL Co,Ltd,Japan),routine blood measurements (Sysmex Corporation,Japan),alpha-fetoprotein (Abbott Ireland Diagnostics Division,Finisklin Business Park,Sligo,Ireland),serum HBV DNA load (Cobas AmpliPrep/Cobas TaqMan 96),HBsAg/anti-HB,and HBeAg/anti-HBe (Abbott Architac i2000) were detected.
Quantitative Detection of Plasma Cytokines
The levels of IFN-α,IFN-γ,IL-10,IL-17A,IL-6,TGFβ,and TNF-α in the plasma were detected with the Luminex technique and analyzed with a FLEXmap 3D analyzer.Our study sought to investigate whether cytokines might enable early prediction of the efficacy of IFN therapy for CHB;therefore,we tested cytokines primarily at baseline,week 12,and week 24.
Statistical Analysis
For continuous variables in demographic data,the mean,median,standard deviation,maximum and minimum values were calculated.The frequency and percentage are listed in statistical tables.Response rates for the primary and secondary endpoints were calculated as percentages and 95%confidence intervals.
Descriptive analysis was conducted with chisquare test and rank sum test.Bonferroni correction was used to correct the rank-sum test results at each time point,and the correction level was α.Biochemical,viral,serological,and other indicators were observed at five time points.The α was set to 0.01,andP<0.01 was considered statistically significant.We used three observation time points for cytokines.The α was set as 0.013,andP<0.013 was considered statistically significant.
Single factor analysis was used to determine the relationships between the study factors and HBeAg and HBsAg response,and stratified analysis was used for the main confounding factors.The statistical methods included chi-square test,Mantel-Haenszel stratified analysis,trend chi-square analysis,and analysis of variance.
Because many factors affect HBeAg and the HBsAg response,multivariate analysis was necessary.
RESULTS
Clinical Characteristics and Treatment Outcomes of Patients
From November 2017 to November 2018,221 of 250 eligible HBeAg-positive patients with CHB provided signed informed consent to enter the antiviral study.Among them,116 patients were treated with PEG-IFNα-2a,and 105 patients chose oral NAs.Three patients in the PEG-IFNα-2a group withdrew from the study because of adverse effects of PEG-IFNα-2a,five withdrew because of a fertility plan,and eight patients did not complete the 48-week follow-up.Finally,100 patients (average age 31,60 men) treated with PEG-IFNα-2a completed the 48-week follow-up(Figure 1).A total of 55 patients were treated with ETV after 12 weeks of PEG-IFNα-2a,and 10 patients were treated with ETV after 24 weeks of PEG-IFNα-2a.After 48 weeks of treatment,72 patients achieved virological response,and 64 patients showed ALT normalization;38 patients achieved serum HBeAg disappearance,and 25 patients achieved HBeAg seroconversion;37 patients showed an HBsAg decrease ≥ 1 log10IU/mL,nine patients showed HBsAg disappearance,and eight patients achieved HBsAb positivity.
Prior to Holly s birthday, Susan had been a regular visitor in our home. On several occasions, she rode the bus home with Holly and was one of the few friends ever permitted to stay over on a school night. The girls did their homework together and went to bed at a reasonable hour.

Figure 1.Patient enrollment and deposition.
Subgroup Analysis Performed According to the Disappearance of HBeAg after 48 weeks of IFN Treatment
There were 38 cases in the HBeAg loss group(26 men) and 62 cases (34 men) in the non-loss group.The age,biochemical indexes [ALT,glutamic oxalacetic transaminase (AST),total bilirubin (TBil),and albumin (ALB)],virological indexes (HBV DNA,HBsAg,and HBeAg),and peripheral blood cytokines between groups are shown in Table 1.Statistically significant differences were observed in the median HBeAg levels between groups at week 12 (HBeAg 13.98vs.94.18 S/CO,Z=−3.821,P<0.001);week 24(HBeAg 1.29vs.22.51 S/CO,Z=−6.908,P<0.001);week 36 (HBeAg 0.46vs.21 S/CO,Z=−7.955,P<0.001);and week 48 (HBeAg 0.43vs.49 S/CO,Z=−8.367,P<0.001).
Subgroup Analysis Performed According to the Decrease in HBsAg after 48 Weeks of IFN Treatment
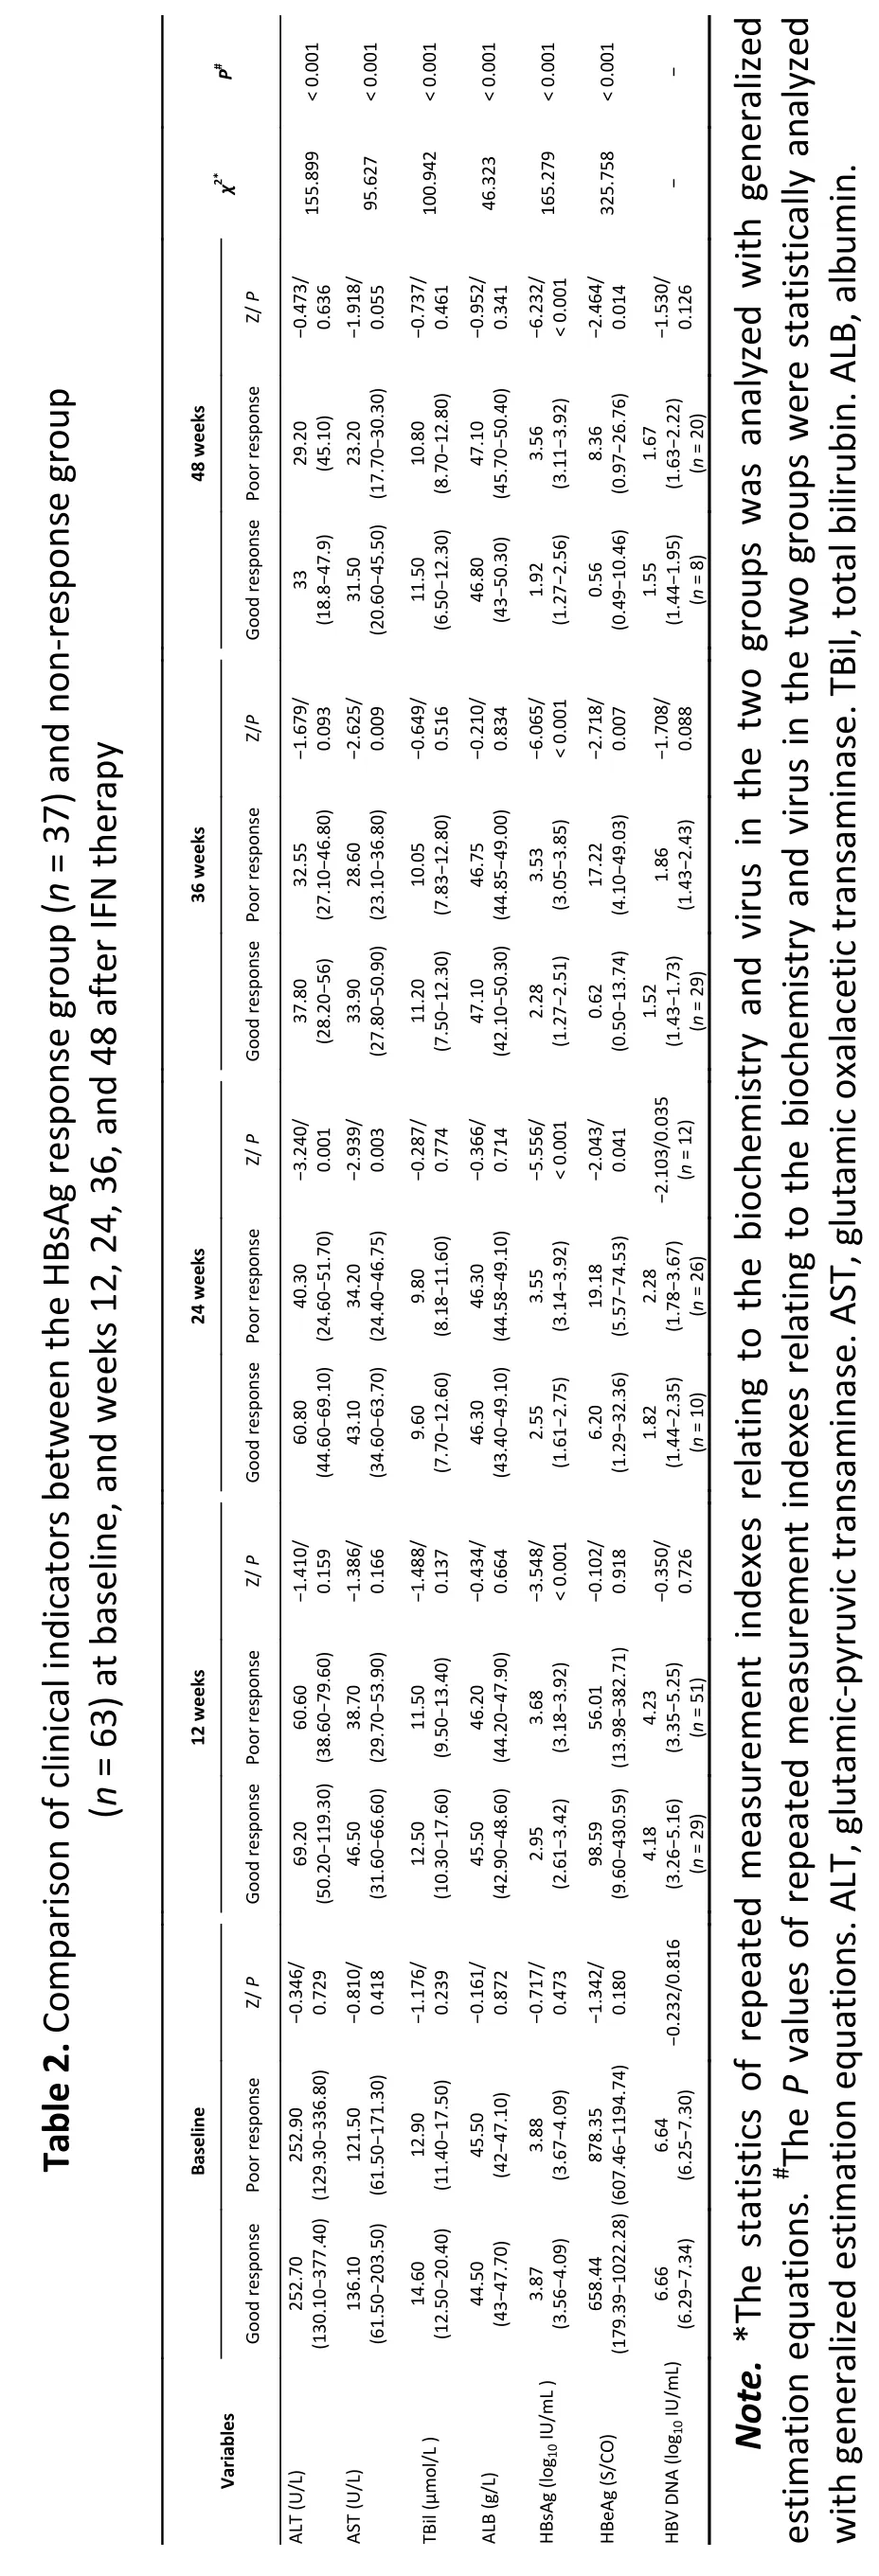
The patients were divided into a response group(n=37) and non-response group (n=63) according to their decrease in HBsAg (≥ 1 log10IU/mL) at week 48.Table 2 shows the dynamic changes in clinical indexes between groups,and Figure 2 shows cytokines at baseline,and weeks 12 and 24 during IFN therapy.

Figure 2.Comparison of cytokines between the HBsAg response group (R:n=37) and non-response group (NR:n=63) at baseline,and weeks 12 and 24 of IFN therapy.P <0.013 is considered statistically significant.
A statistically significant difference was observed in median HBsAg levels between groups at week 24(HBsAg 2.95 log10vs.3.68 log10IU/mL,Z=−3.548,P<0.001),week 24 (HBsAg 2.55vs.55 log10IU/mL,Z=−5.556,P<0.001),week 36 (2.28 log10vs.3.53 log10IU/mL,Z=−6.065,P<0.001),and week 48(HBsAg 1.92 log10vs.3.56 log10IU/mL,Z=−6.232,P<0.001).
A statistically significant difference was observed in the median TGF-β2 level (368.61vs.499.84 pg/mL,Z=−2.999,P=0.003) and TNF-α level at week 12,and the ALT and AST levels (ALT 60.80vs.40.30 U/L,Z=−3.240,P=0.001;AST 43.10vs.34.20 U/L,Z=−2.939,P=0.003) at week 24.A statistically significant difference was found in the median HBeAg levels between groups at week 36 (0.62vs.17.22 S/CO,Z=−2.718,P=0.007),and the median AST level significantly differed between groups (33.90vs.28.60 U/L,Z=−2.625,P=0.009).
Logistic Regression Analysis of Predictors of HBeAg Loss at Week 48
Table 3 shows an analysis of the predictors of HBeAg loss after 48 weeks of IFN treatment.Multivariate analysis indicated that HBeAg at week 12 was independently associated with 48-week HBeAg serological disappearance (OR=1.003,95%CI:1.000–1.005,P=0.039),with a cut-off value of 22.95 S/CO.The sensitivity was 63.20%,the specificity was 77.40%,and the AUC was 0.728 (95%CI:0.622–0.835).
Both the HBeAg level (OR=1.050,95%CI:1.014–1.087,P=0.006) and the HBeAg decline (OR=0.953,95%CI:0.921–0.987,P=0.007) at week 24 were independently associated with the serological disappearance of HBeAg at week 48.The cut-off value of HBeAg at week 24 for predicting the HBeAg disappearance at week 48 was 3.69 S/CO,the sensitivity was 75.70%,the specificity was 96.80%,and the AUC was 0.916 (95%CI:0.855–0.977).The cut-off value of the HBeAg decline level at week 24 for predicting the HBeAg disappearance at week 48 was 733.61 S/CO,the sensitivity was 54.10%,the specificity was 64.50%,and the AUC was 0.557 (95%CI:0.436–0.677).
There was no statistically significant difference in cytokines between patients with or without HBeAg disappearance during treatment (P>0.013).

Logistic Regression Analysis of Predictors of an HBsAg Decline ≥ 1 log10 IU/mL at Week 48
Table 4 shows an analysis of the predictors of HBsAg decline ≥ 1 log10IU/mL at week 48 after IFN treatment.The cut-off value of HBsAg levels at week 12 for predicting the HBsAg response (HBsAg decline ≥ 1 log10IU/mL from baseline) at week 48 was 3.375 log10IU/mL,the sensitivity was 89.20%,the specificity was 71.40%,and the AUC was 0.829(95%CI:0.740–0.918).The cut-off value of the HBsAg decline level at week 12 for predicting the HBsAg response at week 48 was 0.530 log10IU/mL,the sensitivity was 86.50%,the specificity was 81.00%,and the AUC was 0.858 (95%CI:0.778–0.938).The cut-off value of the HBeAg level at week 12 for predicting the HBsAg response at week 48 was 13.915 S/CO,the sensitivity was 40.50%,the specificity was 76.20%,and the AUC was 0.541 (95%CI:0.421–0.661).The cut-off value of the HBeAg decline level at week 12 for predicting the HBsAg response at week 48 was 552.055 S/CO,the sensitivity was 73.00%,the specificity was 50.80%,and the AUC was 0.576(95%CI:0.459–0.693).
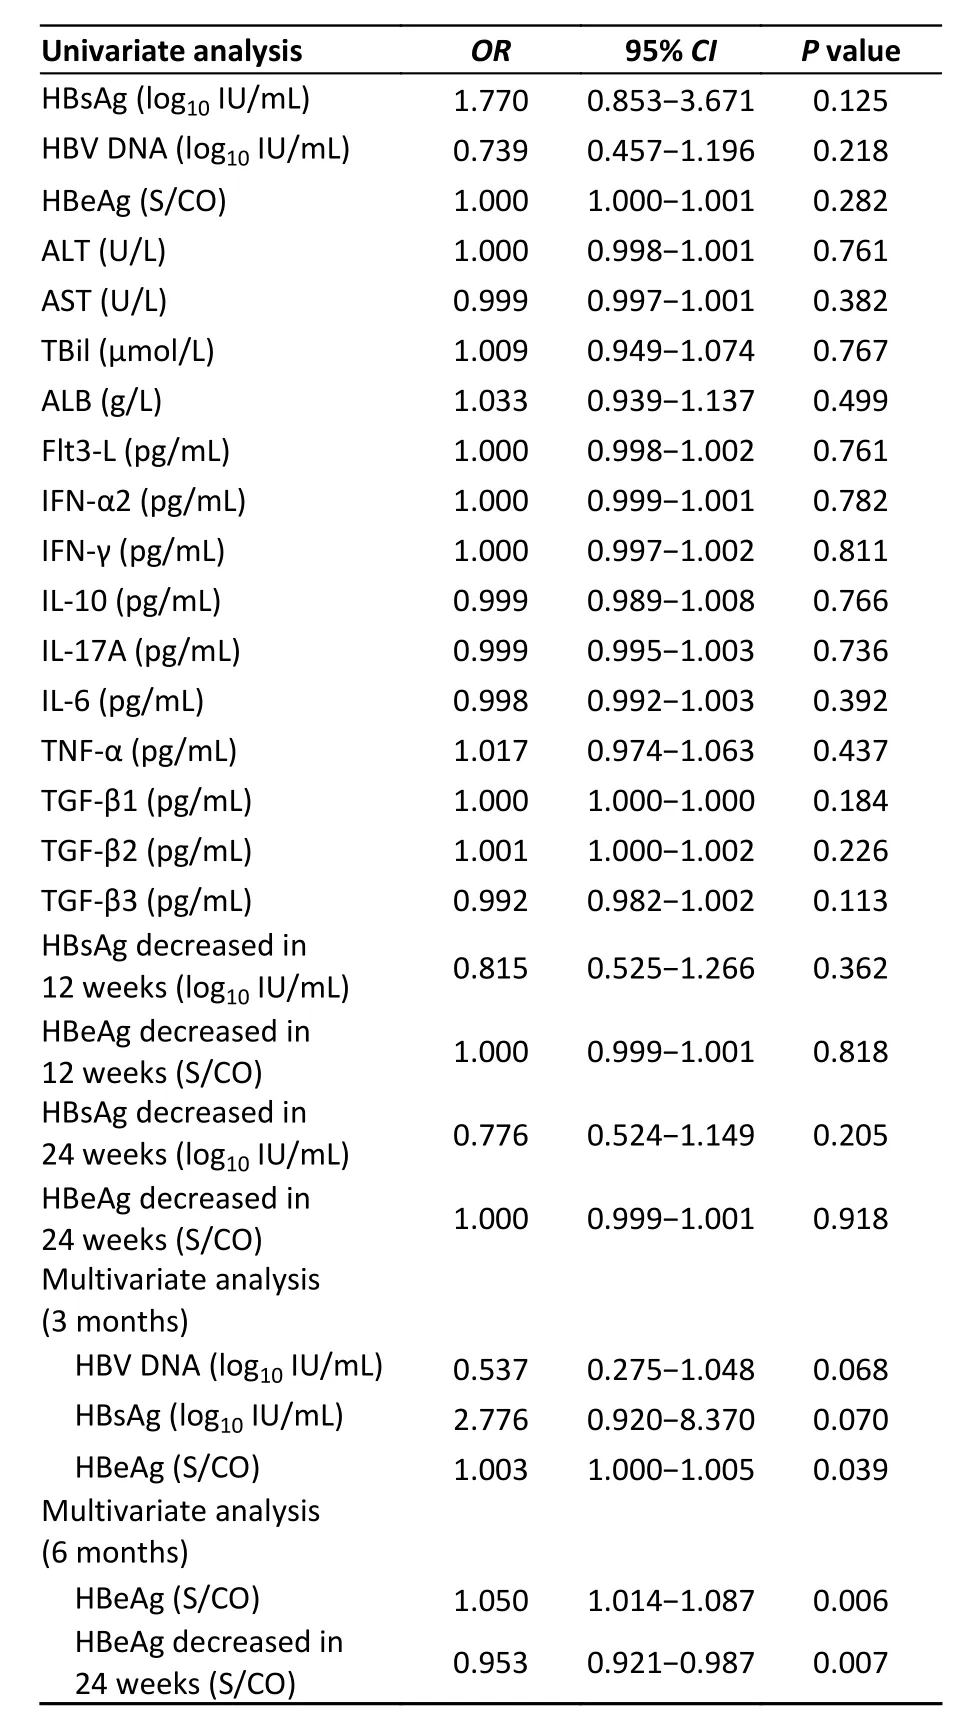
Table 3. Logistic regression analysis of predictors of HBeAg loss at week 48 of IFN treatment

Table 4. Logistic regression analysis of predictors of an HBsAg decline ≥ 1 log10 IU/mL at week 48 after IFN treatment
There was no statistically significant difference in cytokines between patients with and without HBsAg response during treatment (P>0.013);thus,the predictive value of cytokines could not be further analyzed.
DISCUSSION
Antiviral treatment with IFN is based on a dual mechanism involving directly inhibiting viral replication and eliminating virus-infected cells caused by immunoregulation[3,7,19].Higher HBeAg seroconversion rates and greater HBsAg disappearance can be achieved after IFN treatment than NA treatment[19-22].The efficacy of IFN in the treatment of hepatitis B is influenced by factors including patients’ immune function,HBV DNA load and antigen levels,and the viral genotype[19-22].To help more patients achieve maximal benefits from IFN therapy and avoid unnecessary treatment,the treatment strategy should be optimized according to relevant changes in cytokine profiles and virological markers during the treatment process.
In the analysis of correlations between cytokines and the response to IFN therapy,although the difference was not significant,the baseline IFN-γ level in the HBeAg responder group was higher than that in the non-responder group,and the levels of IL-10,IL-6,TGF-β1,and TGF-β2 in the responder group were lower than those in the non-responder group.Recovery from HBV infection and long-term immune control are mainly dependent on the HBV specific CD8+T cell response,whereas CD8+T cells are the main source of IFN-γ[23].These findings may explain why the baseline IFN-γ concentrations were higher in the IFN responders than in the non-responders.IFNγ-inducible protein-10 levels have been found to be associated with the response to IFN therapy[24].
In patients with CHB,the levels of HBsAg in the blood are significantly correlated with the content of HBV cccDNA in the liver,and immune control mainly depends on the inhibition of virus replication by virus-specific cytotoxic T lymphocytes and the degree of clearance of virus-infected hepatocytes.Therefore,the levels of HBsAg in the blood,particularly the decrease in HBsAg levels after treatment,can predict patients’ sustained viral responses after stopping treatment.Previous studies have reported that the decrease in HBsAg ≥1 log10IU/mL at the end of treatment compared with baseline predicts the rate of sustained viral response after discontinuation of drug therapy[25].In this study,HBsAg responders and non-responders were grouped according to whether they responded to IFN therapy with a decrease in HBsAg ≥ 1 log10IU/mL after 48 weeks.At week 48,37 of 100 patients achieved an HBsAg response.In our study,the overall response was better than that previously reported because some patients with poor early response to IFN had already been treated with ETV.Baseline levels of TGF-β2,which suppresses immune function,were significantly lower in the responder group than the non-responder group,and low TGF-β levels also contributed to the response to IFN therapy among responders.HBsAg at week 12,and HBsAg and HBeAg at weeks 24,36,and 48 in the response group were significantly lower than those in the non-response group.ALT and AST at weeks 24,36,and 48 in the response group were significantly higher than those in the non-response group.Elevation of ALT and AST in response to liver inflammation also indicated the activation of immune response to HBV infection.Patients with elevated transaminases during IFN treatment have better treatment responses[26].High baseline ALT levels in patients with CHB and elevated ALT levels during IFN treatment may indicate that IFN-α2 stimulates NK cells and CD8+T cells to kill and eliminate virus-infected hepatocytes.The IFN-α2 in the response group was higher than that in the nonresponse group at weeks 12 and 24.The TNF-α at week 12 was lower than that in the non-response group.TNF-α not only mediates liver inflammation and hepatocyte damage,but also participates in the host anti-HBV immune response,thus potentially explaining the higher levels of TNF-α in responders[27].Because our previous studies have found little correlation between ETV treatment and immune cell function,we did not consider the correlation between ETV response and cytokines during the treatment strategy adjustment[7,28].
Multivariate analysis in our study showed that the levels of HBeAg and HBsAg,and the decreased levels during treatment,predicted the efficacy of IFN therapy,and the changes in virological indicators during treatment predicted the efficacy of 48-week treatment.These findings suggest that attention should be paid to the changes in indicators such as HBeAg and HBsAg in clinical practice.Multivariate analysis indicated that ALB levels were significantly associated with the decrease <1 log10in HBsAg at week 48.The reasons for this association may be that lower albumin is associated with a greater inflammatory response and stronger immune response.As one of the main proteins in human body,albumin plays a major role in maintaining the colloid osmotic pressure of the blood.Moreover,albumin can bind almost all drugs and largely determines their pharmacokinetic characteristics[29].Multivariate analysis also indicated that the response to IFN therapy was not significantly associated with the levels of cytokines in peripheral blood during the treatment period;this finding may be associated with the substantial dispersion of cytokines and the small sample size,and will require further validation in future studies.
There were several limitations to our study.First,the sample size was relatively small,and the variety of cytokines tested was limited.Our results should be further validated through well-designed studies with large sample sizes.There was no significant correlation between the response to IFN and cytokines during the PEG-IFN treatment.More cytokines will be considered in our future studies.
In conclusion,our study investigated the changes in cytokines and virological markers in patients with CHB treated with PEG-IFN for 48 weeks.The results indicated no significant correlation between the responses to IFN and cytokines,whereas the changes in viral markers predicted the response to IFN at week 48.The disappearance of HBeAg was associated with HBeAg levels at weeks 12 and 24,and with the HBeAg decline at week 24.The HBsAg response was associated with HBsAg,the HBsAg decline,HBeAg,and the HBeAg decline at week 12 and HBsAg at week 24.
ACKNOWLEDGMENTS
We thank all patients and staff who participated in the study.
STATEMENT OF INTEREST
The manuscript was written by the authors without other writing assistance.All authors have no financial interests.
AUTHORSHIP STATEMENTS
LI Ming Hui,YI Wei,HUANG Rong Hai,and XIE Yao contributed to the study design.LI Ming Hui,SUN Fang Fang,CHEN Feng Xin,and XIE Yao contributed to the data analysis.LI Ming Hui,SUN Fang Fang,CHEN Feng Xin,HUANG Rong Hai,YI Wei,and XIE Yao contributed to the recruitment,enrollment,and assessment of participants,as well as data collection.ZENG Zhan,LIN Yan Jie,BI Xiao Yue,and YANG Liu contributed to following up with the patients.ZENG Zhan,DENG Wen,and JIANG Ting Ting managed all aspects of laboratory support.LI Ming Hui wrote the first draft of the manuscript.XIE Yao revised the manuscript and is the guarantor of the article.All authors approved the final version of the manuscript.
ETHICS APPROVAL AND CONSENT TO PARTICIPATE
This study was performed in line with the principles of Declaration of Helsinki.The experimental procedure was approved by the Ethics Committee of Beijing Ditan Hospital Affiliated to Capital University of Medical Sciences.All patients involved have signed informed consent.
 Biomedical and Environmental Sciences2022年4期
- Biomedical and Environmental Sciences的其它文章
- Neonatal Exposure to Propofol lnterferes with the Proliferation and Differentiation of Hippocampal Neural Stem Cells and the Neurocognitive Function of Rats in Adulthood via the Akt/p27 Signaling Pathway*
- Subchronic Oral Toxicity Evaluation of Sodium Dehydroacetate:A 90-day Repeated Dose Study in Rats*
- Exploration of lRES Elements within the ORF of the Coxsackievirus B3 Genome*
- Influence of Microcirculatory Dysfunction on Myocardial Injury after Cardiopulmonary Resuscitation
- lnvolvement of Stromal lnteraction Molecule 1 and lts Downstream Proteins in SiO2 Particle-lnduced Release of lnflammatory Mediators from Mouse Macrophage (RAW264.7)Cells*
- Dose-Dependent,Frequency-Dependent,and Cumulative Effects on Cardiomyocyte Injury and Autophagy of 2.856 GHz and 1.5 GHz Microwave in Wistar Rats